So we searched for charts that would tell not just the story of how the world is -- but where it's going. Some of these charts are optimistic, like the ones showing huge gains in life expectancy in poorer nations. Some are more worryisome -- wait till you see the one on endangered species. But together they tell a story of a world that's changing faster than at arguably any other time in human history.
1. Global inequality dwarfs anything we see in America.

Experts disagree about whether inequality among all the world's individuals hasn't changed much in recent decades — as Branko Milanovic, the lead economist at the World Bank's research group, shows in the above graph — or whether the rise of India and China has caused it to decline significantly. In either case, however, global inequality dwarfs what inequalities exist within nations.
Read more here.
2. But the world wasn't always so unequal.
This huge gap in the fortunes of people in various countries is a relatively recent development. Before the Industrial Revolution, there wasn't a whole lot of variation in living standards between, say, the United Kingdom and China. Afterward, the UK, soon followed by neighboring European countries, pulled away, while India and China (and, though not pictured above, Latin America and Africa) stagnated. This has come to be known as the "Great Divergence."

3. The richest people in poor countries are poorer than the poor of rich countries.
There are still some poor Americans who make less than the richest Indians, but the poorest residents of egalitarian rich countries like Denmark make significantly more than the richest residents of poor nations like Uganda or Tanzania.

4. Residents of poor countries could make many multiples of their salaries if they moved to rich ones.
The above chart shows estimates of how much more workers in the U.S. make compared to identical workers in developing countries. Mexican workers makes 2.5 to 3 times less than they would make in the U.S. for doing the same thing — and that's among the least egregious ratios. Nigerians and Yemenis stand to gain upwards of 10 times as much from moving to the U.S. Put another way: we could have a policy where Yemenis are allowed to move to the U.S. if they pay $14 out of every $15 they earn in taxes, and it'd still be a great deal for them.

(Note - "best" here means someone who does well outside of directly observable things like income, education, etc. Read the full paper for more details.)
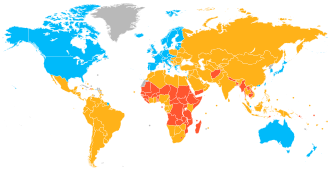
5. This kind of poverty causes bad health and early deaths.
The correlation between life expectancy and GDP per capita — depicted in the above plot of the nations of the world, sized by population — is exceptionally strong. That's no accident. With more income comes better sanitation, better health care, and other improvements that enable longer lifespans.

6. We are making progress, though, against global poverty.
If curent patterns persist, the global poverty rate (defined as the percentage of people who make under $1.25 a day) is set to fall from 22.4 percent in 2008 to 5.4 percent in 2030. If it speeds up, we could even see extreme poverty like this eliminated.

7. And we're extending lifespans too.
What's more, the biggest extensions are occurring in low-income countries, according to WHO data.

8. Now, the way that people in rich countries die…
At the dawn of the 20th century, infectious diseases were responsible for about half of deaths in the United States. By 2010, improved sanitation, access to antibiotics, and other advances had reduced the burden of infections and left heart disease and cancer as our main killers.

9. …looks very different from the way people in general die.
If you take a similar view of deaths worldwide, however, you see a picture that looks much more like the U.S. of 1900 — with plenty of infectious disease-caused deaths — than like that of 2010.

10. Literacy has also grown as countries get richer.
School enrollment has grown too, but it's more instructive to look at actual outcomes like literacy, given the poor quality of schooling in many parts of the world.

11. Much of recent economic progress in the world has happened in China and India.
The above two charts use two different methods to find the same thing: poverty reduction has been very rapid in China, less rapid but still quite fast in India, and slower in Brazil.

12. Leaving most of the remaining poor in sub-Saharan Africa.
Sub-Saharan Africa is seeing extreme poverty rates fall, but not as quickly as the rates in India and China are falling. Indeed, while the poverty rate in Africa is falling, the number of poor people is still rising, just not as fast as the overall population.

13. Meanwhile, we're not killing as many people in wars as we used to.
After the astonishing toll of World War II, we appear to have entered a much more peaceful era in world history, at least in terms of casualties.

14. The wars we do fight tend to be within, rather than between, countries.
And even intra-state (or "societal" in the above chart) wars are on the decline.

15. Homicide is down across the board too.
Since the end of the dark ages, homicide rates in Europe have been falling steadily. The same thing happened in America; data that goes this far back for the rest of the Americas, Africa, and Asia is depressingly hard to come by.

16. If you're a man, your odds of being killed in war have never been lower.
We still have far too much war. But it's worth remembering that the advent of modern states has resulted in a marked reduction in its incidence.

17. It's not all roses, of course. Greenhouse gases are making the world hotter than ever.
Don't let this winter's cold snap fool you. It really is getting much warmer, and the consequences are going to be fairly devastating.

18. Leading glaciers to melt and sea levels to rise.
A recent survey of experts found that their average estimate of how much the oceans will rise by 2100 is 1.3 to 2 feet. Feet!

19. Good 'ol fashioned smog is on the rise, too, as China and India industrialize.
Indeed, the OECD estimates that air pollution will kill many more people in 2050 than malaria or unsafe water/sanitation, as the above chart shows.

20. And acid rain's making a comeback for the same reason.
While emissions of sulfur dioxide — one of the main pollutants that causes acid rain — have fallen in the U.S. and Europe, they're rising in East Asia as China grows.

21. Deforestation is continuing apace.
While North and Central America had roughly the same forest area in 2010 as they did in 2000, every other continent — and especially South America and Africa — saw forest area shrink over that period.

22. But we're emitting fewer ozone depleting gases.
As a result of the Montreal Protocol, chlorofluorocarbons (CFCs), which contribute to ozone depletion, are on the way out. But their cousins, HCFCs, which also hurt the ozone layer, aren't going away as quickly.

23. Our endangered species problem, however, is getting worse.
The International Union for Conservation of Nature and Natural Resources calculates what it calls a "Red List Index," which estimates how threatened different taxonomic groups are. In recent years, the index has shown slight increases in the severity of threats to mammals, birds, amphibians, and fish, but truly dramatic increase in extinction risk for corals

24. Here in the U.S., our eating habits have changed considerably since the '50s.
Since 1980, we've seen more vegetable consumption relative to meat is interesting. Granted, a lot of that is stuff like potatoes that isn't exactly healthful, but shhhhh.

25. As are our transportation habits.
While there's been a very recent shift away from driving, the story of the past half-century has been people giving up public transit in favor of cars.

26. The global economic convergence is causing a lot of changes in already rich countries. Inequality is growing…
It's not just the U.S. Almost all other developed countries have seen inequality increase in recent decades.

27. …and the share of income going to workers is declining.
For decades, it was commonly thought that labor and capital's relative shares of GDP stayed constant over time. No longer: The labor share has been steadily declining of late, and no one really knows why.

28. That said, most rich countries have never had as much leisure time as they have now, as demonstrated by the recent decline in hours worked.
"If leisure is considered as nothing more than the time spent away from paid work, then naturally any change in the amount of annual hours worked will be reflected in variations of the amount of available leisure time," an OECD researcher writes in a recent report on leisure. And if you look at annual hours worked in most developed countries, they're falling noticeably. The big exception is the U.S., where hours worked have been broadly stable.

29. They also enjoy the fruits of Moore's law in ever-cheaper electronics.
Despite fears that we'd reach a point where silicon-based transistors just can't be packed any more densely onto chips that grow cheaper with every iteration, Moore's law is still very much in effect, as Wikipedian Wgsimon's plot of transistor counts over time shows. The result is ever-cheaper and ever-faster computers, phones, and other electronics.

30. Worldwide, access to the Internet is growing considerably.
Access to the Internet — which has existed for well under 40 years — is all but universal in the developed world, and while much is left to be done in developing countries, the trend is positive.

31. Global coal demand is rising.
It's easy to forget amidst the fracking boom here in the U.S. that the rest of the world still really, really wants coal. Like, a lot of coal. Too much coal, I'd say.

32. But it's true, natural gas is booming, particularly compared to oil.
Let's not minimize what's happening with natural gas, though. Its price is falling very quickly and, just as interesting, has decoupled from the price of oil.

33. Rich countries in general are spending more on health care — but none as much as the U.S.
What's more astounding is that the U.S. actually spends more government money per person on health care than any of these countries. And they have universal programs.

34. The world's still mostly Muslim and Christian.
This is the only pie chart on here, but it's an important one. For further context, around half of the world's Christians are Catholic, making Catholics about as big a grouping as unaffiliated people (a group that includes atheists, agnostics, etc.).

35. But Islam and unaffiliated are growing in ranks.
At least according to the World Religion Database — a peer-reviewed dataset put out through Boston University — Islam, Hinduism, and Christianity are gaining followers the fastest, or at least were between 2000 and 2010. Partly that's because the most reliable way for a religion to gain followers is by having existing followers produce offspring, and so already dominant religions (like those three) are likely to see faster growth than other religions. But it's a reminder that we're still a long way from a secular world.

36. The gap between men's and women's participation in the workforce is shrinking.
While labor force participation among women has stayed roughly constant in recent decades, male participation has fallen, so the gap between men's and women's participation rates has shrunk.

37. Though huge gaps in pay persist.
The U.S. isn't alone in paying women significantly less than men. Many other rich countries — including supposedly egalitarian ones like Finland and Germany — have even more severe gender pay gaps.

38. The center of the entertainment business is going eastward.
The above chart shows the percentage of box office receipts emanating from each region. The U.S. and Canada are seeing their share of receipts falling, while Asia's share is rising noticeably.

39. And despite the rise of Internet piracy, the entertainment sector is doing okay.
The entertainment industry — and in particular the music industry — underwent a collective freakout in the late 1990s and early 2000s as Napster, then Kazaa, then Gnutella and then BitTorrent made pirating songs, TV episodes, and movies increasingly easy. But their worst fears didn't come to pass. Revenue in the music industry — which, MP3s are so much smaller than video files, was hit first — remained roughly constant from 1998 to 2011, as you can see above. Sure, revenues from selling recorded music shrank, but that was offset by an increase in concert revenues.

40. Nuclear weapons are decreasing in numbers, but more countries than ever have them.
In the early 1960s, when American politicians worried that they suffered from a "missile gap" with the Soviet Union, the U.S. stockpile was much larger than the Soviets Union's. In the 1980s, by contrast, the Soviets pulled way ahead. And once the Cold War ended, both countries started disarming.


