Global Temperature Update – July 2014
With most of the US enjoying unseasonably cool summer temperatures, I thought it’d be a good time to update the global temperature and atmospheric CO2 graphs.
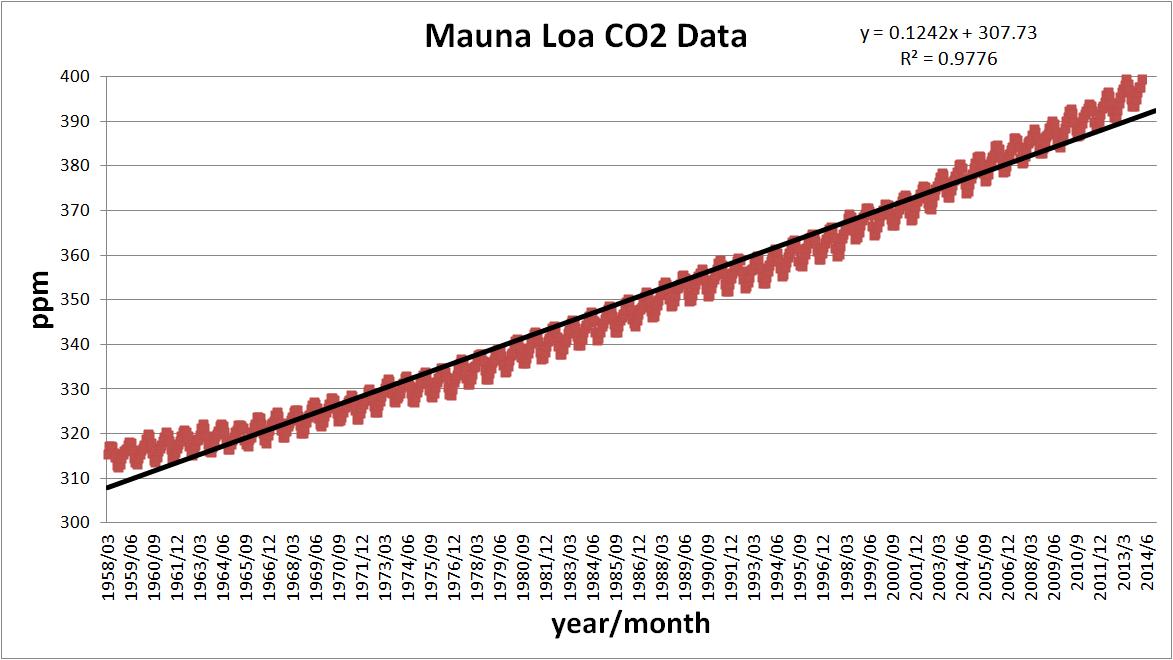
The Earth’s atmospheric CO2 concentration is still increasing at the same rate since 1958 (about 0.125 ppm per month).

The Anthropogenic Global Warming (AGW) cult tells us that this steady increase in CO2 should be driving our global temperature anomalies higher.
Keep in mind that we shouldn’t confuse ‘weather’ with ‘climate’ and a peer reviewed journal clearly states that we need 17 years of temperature data to assess whether humans are affecting global temperatures.
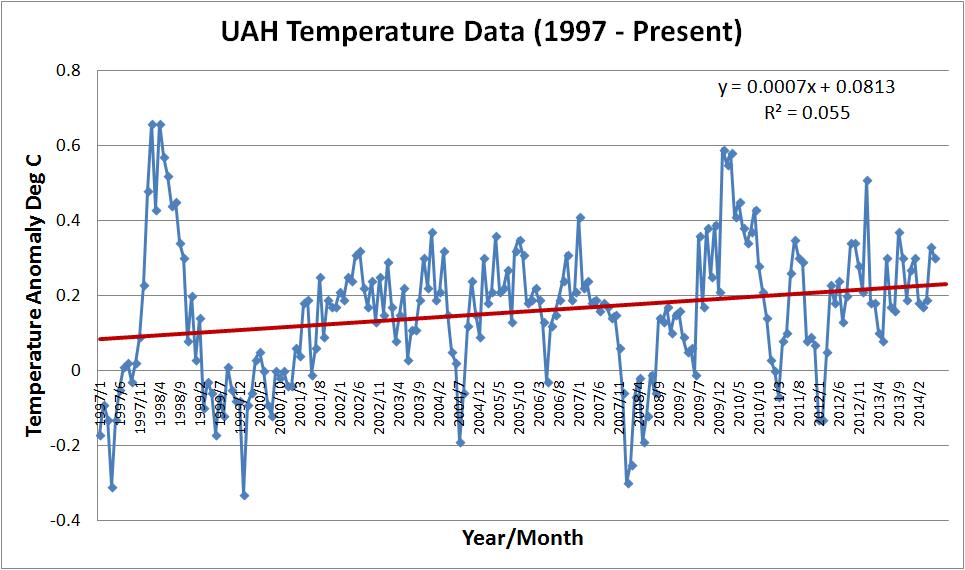
According to the University of Alabama Huntsville (UAH) temperature data, the global temperature anomalies have been flat for the last 17 years (0.0007° C increase per month or 0.0084° C per year).

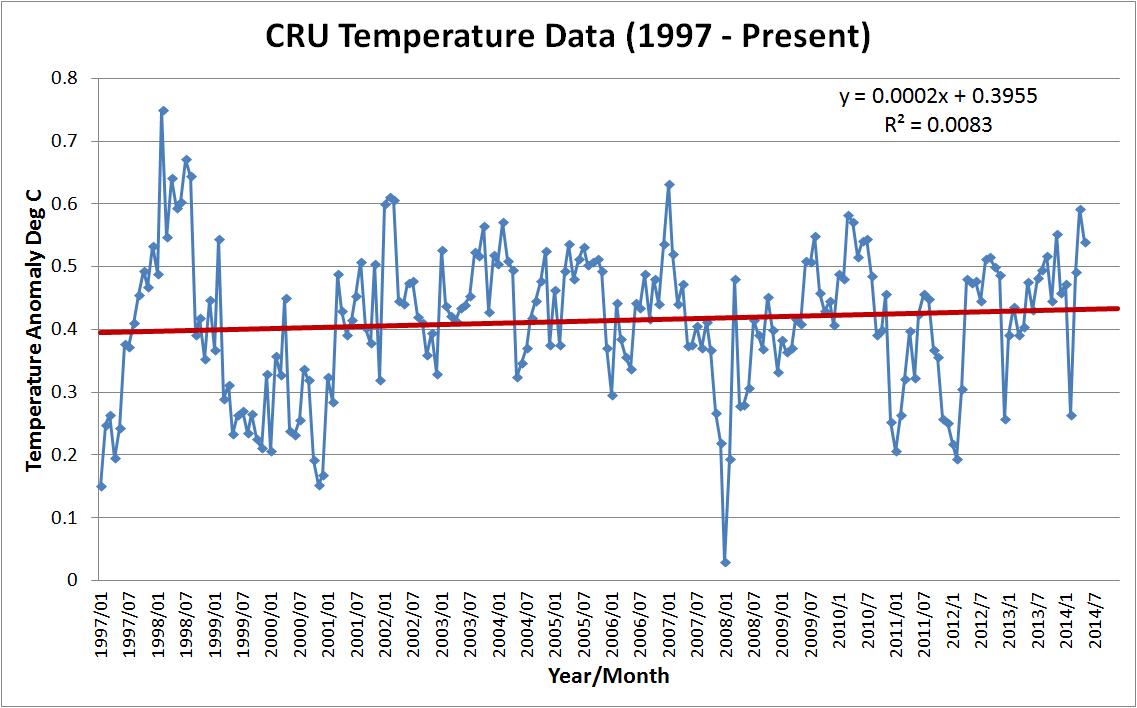
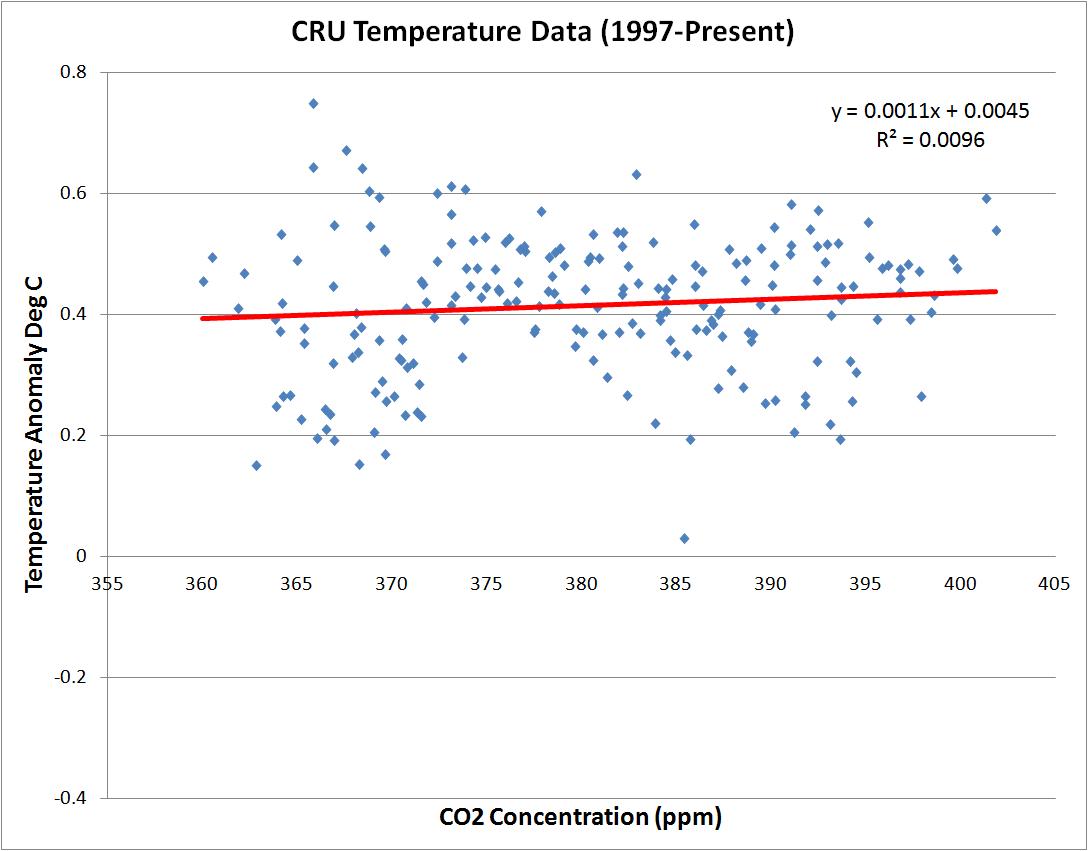
The Hadley Climate Research Unit (HADCRUT3) temperature data shows the same flat temperatures over this same time period (0.0002° C increase per month or 0.0024° C per year).

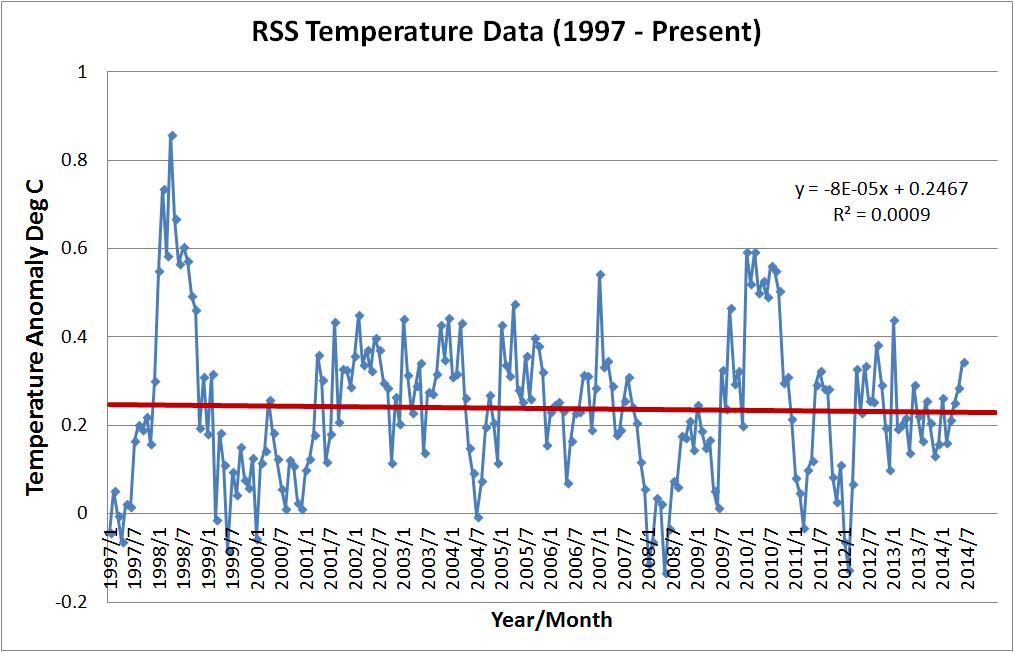
The Remote Sensing System (RSS) satellite temperature data shows even flatter temperatures over this same time period (0.00008° C increase per month or 0.00096° C per year).

All three of these ‘increases’ are within the margin of error for the measuring instruments so there is clearly no warming trend over the past 17 years even though atmospheric CO2 concentrations have continued their steady march upwards.
Now let’s look at these same three temperature data sets plotted against atmospheric CO2 concentration.


Remember that in 2007 the AGW cult predicted that the Earth would warm 0.02 C per year if the current rate of atmospheric CO2 concentrations continued. At best, these predications are off by a factor of 2.4 (from UAH data) but at worst they are off by a factor of 20.8 (from RSS data).
The Earth’s atmospheric CO2 concentration is still increasing at the same rate since 1958 (about 0.125 ppm per month).
The Anthropogenic Global Warming (AGW) cult tells us that this steady increase in CO2 should be driving our global temperature anomalies higher.
Keep in mind that we shouldn’t confuse ‘weather’ with ‘climate’ and a peer reviewed journal clearly states that we need 17 years of temperature data to assess whether humans are affecting global temperatures.
“Our results show that temperature records of at least 17 years in length are required for identifying human effects on global-mean tropospheric temperature.”So let’s see if that has happened.
According to the University of Alabama Huntsville (UAH) temperature data, the global temperature anomalies have been flat for the last 17 years (0.0007° C increase per month or 0.0084° C per year).
The Hadley Climate Research Unit (HADCRUT3) temperature data shows the same flat temperatures over this same time period (0.0002° C increase per month or 0.0024° C per year).
The Remote Sensing System (RSS) satellite temperature data shows even flatter temperatures over this same time period (0.00008° C increase per month or 0.00096° C per year).
All three of these ‘increases’ are within the margin of error for the measuring instruments so there is clearly no warming trend over the past 17 years even though atmospheric CO2 concentrations have continued their steady march upwards.
Now let’s look at these same three temperature data sets plotted against atmospheric CO2 concentration.
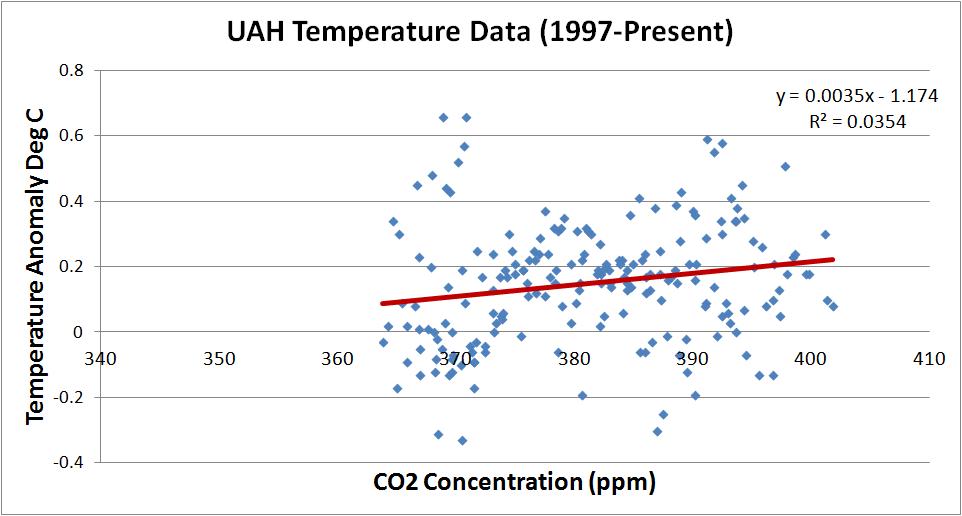
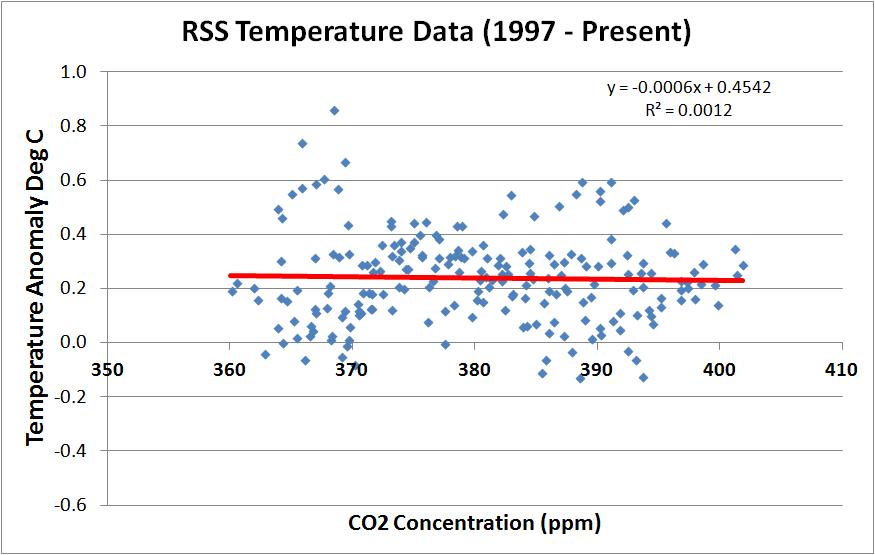
Remember that in 2007 the AGW cult predicted that the Earth would warm 0.02 C per year if the current rate of atmospheric CO2 concentrations continued. At best, these predications are off by a factor of 2.4 (from UAH data) but at worst they are off by a factor of 20.8 (from RSS data).


