From Wikipedia, the free encyclopedia
Network science is an interdisciplinary academic field which studies complex networks such as telecommunication networks, computer networks, biological networks, cognitive and semantic networks, and social networks. The field draws on theories and methods including graph theory from mathematics, statistical mechanics from physics, data mining and information visualization from computer science, inferential modeling from statistics, and social structure from sociology. The United States National Research Council defines network science as "the study of network representations of physical, biological, and social phenomena leading to predictive models of these phenomena."[1]
In the 1930s Jacob Moreno, a psychologist in the Gestalt tradition, arrived in the United States. He developed the sociogram and presented it to the public in April 1933 at a convention of medical scholars. Moreno claimed that "before the advent of sociometry no one knew what the interpersonal structure of a group 'precisely' looked like (Moreno, 1953). The sociogram was a representation of the social structure of a group of elementary school students. The boys were friends of boys and the girls were friends of girls with the exception of one boy who said he liked a single girl. The feeling was not reciprocated. This network representation of social structure was found so intriguing that it was printed in The New York Times (April 3, 1933, page 17). The sociogram has found many applications and has grown into the field of social network analysis.
Probabilistic theory in network science developed as an off-shoot of graph theory with Paul Erdős and Alfréd Rényi's eight famous papers on random graphs. For social networks the exponential random graph model or p* is a notational framework used to represent the probability space of a tie occurring in a social network. An alternate approach to network probability structures is the network probability matrix, which models the probability of edges occurring in a network, based on the historic presence or absence of the edge in a sample of networks.
In 1998, David Krackhardt and Kathleen Carley introduced the idea of a meta-network with the PCANS Model. They suggest that "all organizations are structured along these three domains, Individuals, Tasks, and Resources". Their paper introduced the concept that networks occur across multiple domains and that they are interrelated. This field has grown into another sub-discipline of network science called dynamic network analysis.
More recently other network science efforts have focused on mathematically describing different network topologies. Duncan Watts reconciled empirical data on networks with mathematical representation, describing the small-world network. Albert-László Barabási and Reka Albert developed the scale-free network which is a loosely defined network topology that contains hub vertices with many connections, that grow in a way to maintain a constant ratio in the number of the connections versus all other nodes. Although many networks, such as the internet, appear to maintain this aspect, other networks have long tailed distributions of nodes that only approximate scale free ratios.
As a result, the BAST issued the NRC study in 2005 titled Network Science (referenced above) that defined a new field of basic research in Network Science for the Army. Based on the findings and recommendations of that study and the subsequent 2007 NRC report titled Strategy for an Army Center for Network Science, Technology, and Experimentation, Army basic research resources were redirected to initiate a new basic research program in Network Science. To build a new theoretical foundation for complex networks, some of the key Network Science research efforts now ongoing in Army laboratories address:
In 2006, the U.S. Army and the United Kingdom (UK) formed the Network and Information Science International Technology Alliance, a collaborative partnership among the Army Research Laboratory, UK Ministry of Defense and a consortium of industries and universities in the U.S. and UK. The goal of the alliance is to perform basic research in support of Network- Centric Operations across the needs of both nations.
In 2009, the U.S. Army formed the Network Science CTA, a collaborative research alliance among the Army Research Laboratory, CERDEC, and a consortium of about 30 industrial R&D labs and universities in the U.S. The goal of the alliance is to develop a deep understanding of the underlying commonalities among intertwined social/cognitive, information, and communications networks, and as a result improve our ability to analyze, predict, design, and influence complex systems interweaving many kinds of networks.
Subsequently, as a result of these efforts, the U.S. Department of Defense has sponsored numerous research projects that support Network Science.
D of a network is defined as a ratio of the number of edges E to the number of possible edges, given by the binomial coefficient (N2) , giving D=2EN(N−1). Another possible equation is D=TN(N−1). , whereas the ties T are unidirectional (Wasserman & Faust 1994).[2] This gives a better overview over the network density, because unidirectional relationships can be measured.
N or, less commonly, the number of edges E which can range from N−1 (a tree) to E (a complete graph).
k of a node is the number of edges connected to it. Closely related to the density of a network is the average degree, <k> =2E . In the ER random graph model, we can compute <k> =p(N−1) where p is the probability of two nodes being connected.
The clustering coefficient of thei 'th node is
ki is the number of neighbours of the i 'th node, and ei is the number of connections between these neighbours. The maximum possible number of connections between neighbors is, of course,
It is important to remember that centrality indices are only accurate for identifying the most central nodes. The measures are seldom, if ever, meaningful for the remainder of network nodes.[3] [4] Also, their indications are only accurate within their assumed context for importance, and tend to "get it wrong" for other contexts.[5] For example, imagine two separate communities whose only link is an edge between the most junior member of each community. Since any transfer from one community to the other must go over this link, the two junior members will have high betweenness centrality. But, since they are junior, (presumably) they have few connections to the "important" nodes in their community, meaning their eigenvalue centrality would be quite low.
The concept of centrality in the context of static networks was extended, based on empirical and theoretical research, to dynamic centrality[6] in the context of time-dependent and temporal networks.[7][8][9]

The Erdős–Rényi model, named for Paul Erdős and Alfréd Rényi, is used for generating random graphs in which edges are set between nodes with equal probabilities. It can be used in the probabilistic method to prove the existence of graphs satisfying various properties, or to provide a rigorous definition of what it means for a property to hold for almost all graphs.
To generate an Erdős–Rényi model two parameters must be specified: the number of nodes in the graph generated as N and the probability that a link should be formed between any two nodes as p. A constant 〈k〉 may derived from these two components with the formula 〈k〉 = 2 ⋅ E / N = p ⋅ (N − 1), where E is the expected number of edges.
The Erdős–Rényi model has several interesting characteristics in comparison to other graphs. Because the model is generated without bias to particular nodes, the degree distribution is binomial in nature with regards to the formula:
The Watts and Strogatz model is a random graph generation model that produces graphs with small-world properties.
An initial lattice structure is used to generate a Watts-Strogatz model. Each node in the network is initially linked to its <k> closest neighbors. Another parameter is specified as the rewiring probability. Each edge has a probability p that it will be rewired to the graph as a random edge. The expected number of rewired links in the model is pE=pN<k>/2 .
As the Watts-Strogatz model begins as non-random lattice structure, it has a very high clustering coefficient along with high average path length. Each rewire is likely to create a shortcut between highly connected clusters. As the rewiring probability increases, the clustering coefficient decreases slower than the average path length. In effect, this allows the average path length of the network to decrease significantly with only slightly decreases in clustering coefficient. Higher values of p force more rewired edges, which in effect makes the Watts-Strogatz model a random network.
In the BA model, new nodes are added to the network one at a time. Each new node is connected tom existing nodes with a probability that is proportional to the number of links that the existing nodes already have. Formally, the probability pi that the new node is connected to node i is[10]
The degree distribution resulting from the BA model is scale free, in particular, it is a power law of the form:
Since the 1970s, the empirical study of networks has played a central role in social science, and many of the mathematical and statistical tools used for studying networks have been first developed in sociology.[14] Amongst many other applications, social network analysis has been used to understand the diffusion of innovations, news and rumors. Similarly, it has been used to examine the spread of both diseases and health-related behaviors. It has also been applied to the study of markets, where it has been used to examine the role of trust in exchange relationships and of social mechanisms in setting prices. Similarly, it has been used to study recruitment into political movements and social organizations. It has also been used to conceptualize scientific disagreements as well as academic prestige. More recently, network analysis (and its close cousin traffic analysis) has gained a significant use in military intelligence, for uncovering insurgent networks of both hierarchical and leaderless nature.[15][16]
Dynamic network techniques are particularly useful for assessing trends and changes in networks over time, identification of emergent leaders, and examining the co-evolution of people and ideas.
S=β(1/N)
The formula above describes the "force" of infection for each susceptible unit in an infectious population, where β is equivalent to the transmission rate of said disease.
To track the change of those susceptible in an infectious population:
ΔS=β×S1NΔt
ΔI=μIΔt
Over time, the number of those infected fluctuates by: the specified rate of recovery, represented byμ but deducted to one over the average infectious period 1τ , the numbered of infecious individuals, I , and the change in time, Δt .
R0 or the "average people infected by an infected individual."
R0=βτ=βμ
Each node,x , has a PageRank as defined by the sum of pages j that link to i times one over the outlinks or "out-degree" of j times the "importance" or PageRank of j .
xi=∑j→i1Njx(k)j
In an improvement over the aforementioned formula for determining PageRank includes adding these random jump components. Without the random jumps, some pages would receive a PageRank of 0 which would not be good.
The first isα , or the probability that a random jump will occur. Contrasting is the "damping factor", or 1−α .
R(p)=αN+(1−α)∑j→i1Njx(k)j
Another way of looking at it:
R(A)=∑RBB(outlinks)+...+Rnn(outlinks)
S(t) , infected, I(t) , and recovered, R(t) .
The compartments used for this model consist of three classes:
N=S(t)+I(t)+R(t) , Kermack and McKendrick derived the following equations:
β , which is considered the contact or infection rate of the disease. Therefore, an infected individual makes contact and is able to transmit the disease with βN others per unit time and the fraction of contacts by an infected with a susceptible is S/N . The number of new infections in unit time per infective then is βN(S/N) , giving the rate of new infections (or those leaving the susceptible category) as βN(S/N)I=βSI (Brauer & Castillo-Chavez, 2001). For the second and third equations, consider the population leaving the susceptible class as equal to the number entering the infected class. However, a number equal to the fraction (γ which represents the mean recovery rate, or 1/γ the mean infective period) of infectives are leaving this class per unit time to enter the removed class. These processes which occur simultaneously are referred to as the Law of Mass Action, a widely accepted idea that the rate of contact between two groups in a population is proportional to the size of each of the groups concerned (Daley & Gani, 2005). Finally, it is assumed that the rate of infection and recovery is much faster than the time scale of births and deaths and therefore, these factors are ignored in this model.
More can be read on this model on the Epidemic model page.
Background and history
The study of networks has emerged in diverse disciplines as a means of analyzing complex relational data. The earliest known paper in this field is the famous Seven Bridges of Königsberg written by Leonhard Euler in 1736. Euler's mathematical description of vertices and edges was the foundation of graph theory, a branch of mathematics that studies the properties of pairwise relations in a network structure. The field of graph theory continued to develop and found applications in chemistry (Sylvester, 1878).In the 1930s Jacob Moreno, a psychologist in the Gestalt tradition, arrived in the United States. He developed the sociogram and presented it to the public in April 1933 at a convention of medical scholars. Moreno claimed that "before the advent of sociometry no one knew what the interpersonal structure of a group 'precisely' looked like (Moreno, 1953). The sociogram was a representation of the social structure of a group of elementary school students. The boys were friends of boys and the girls were friends of girls with the exception of one boy who said he liked a single girl. The feeling was not reciprocated. This network representation of social structure was found so intriguing that it was printed in The New York Times (April 3, 1933, page 17). The sociogram has found many applications and has grown into the field of social network analysis.
Probabilistic theory in network science developed as an off-shoot of graph theory with Paul Erdős and Alfréd Rényi's eight famous papers on random graphs. For social networks the exponential random graph model or p* is a notational framework used to represent the probability space of a tie occurring in a social network. An alternate approach to network probability structures is the network probability matrix, which models the probability of edges occurring in a network, based on the historic presence or absence of the edge in a sample of networks.
In 1998, David Krackhardt and Kathleen Carley introduced the idea of a meta-network with the PCANS Model. They suggest that "all organizations are structured along these three domains, Individuals, Tasks, and Resources". Their paper introduced the concept that networks occur across multiple domains and that they are interrelated. This field has grown into another sub-discipline of network science called dynamic network analysis.
More recently other network science efforts have focused on mathematically describing different network topologies. Duncan Watts reconciled empirical data on networks with mathematical representation, describing the small-world network. Albert-László Barabási and Reka Albert developed the scale-free network which is a loosely defined network topology that contains hub vertices with many connections, that grow in a way to maintain a constant ratio in the number of the connections versus all other nodes. Although many networks, such as the internet, appear to maintain this aspect, other networks have long tailed distributions of nodes that only approximate scale free ratios.
Department of Defense Initiatives
The U.S. military first became interested in network-centric warfare as an operational concept based on network science in 1996. John A. Parmentola, the U.S. Army Director for Research and Laboratory Management, proposed to the Army’s Board on Science and Technology (BAST) on December 1, 2003 that Network Science become a new Army research area. The BAST, the Division on Engineering and Physical Sciences for the National Research Council (NRC) of the National Academies, serves as a convening authority for the discussion of science and technology issues of importance to the Army and oversees independent Army-related studies conducted by the National Academies. The BAST conducted a study to find out whether identifying and funding a new field of investigation in basic research, Network Science, could help close the gap between what is needed to realize Network-Centric Operations and the current primitive state of fundamental knowledge of networks.As a result, the BAST issued the NRC study in 2005 titled Network Science (referenced above) that defined a new field of basic research in Network Science for the Army. Based on the findings and recommendations of that study and the subsequent 2007 NRC report titled Strategy for an Army Center for Network Science, Technology, and Experimentation, Army basic research resources were redirected to initiate a new basic research program in Network Science. To build a new theoretical foundation for complex networks, some of the key Network Science research efforts now ongoing in Army laboratories address:
- Mathematical models of network behavior to predict performance with network size, complexity, and environment
- Optimized human performance required for network-enabled warfare
- Networking within ecosystems and at the molecular level in cells.
In 2006, the U.S. Army and the United Kingdom (UK) formed the Network and Information Science International Technology Alliance, a collaborative partnership among the Army Research Laboratory, UK Ministry of Defense and a consortium of industries and universities in the U.S. and UK. The goal of the alliance is to perform basic research in support of Network- Centric Operations across the needs of both nations.
In 2009, the U.S. Army formed the Network Science CTA, a collaborative research alliance among the Army Research Laboratory, CERDEC, and a consortium of about 30 industrial R&D labs and universities in the U.S. The goal of the alliance is to develop a deep understanding of the underlying commonalities among intertwined social/cognitive, information, and communications networks, and as a result improve our ability to analyze, predict, design, and influence complex systems interweaving many kinds of networks.
Subsequently, as a result of these efforts, the U.S. Department of Defense has sponsored numerous research projects that support Network Science.
Network properties
Often, networks have certain attributes that can be calculated to analyze the properties & characteristics of the network. These network properties often define network models and can be used to analyze how certain models contrast to each other. Many of the definitions for other terms used in network science can be found in Glossary of graph theory.Density
The densitySize
The size of a network can refer to the number of nodesAverage degree
The degreeAverage path length
Average path length is calculated by finding the shortest path between all pairs of nodes, adding them up, and then dividing by the total number of pairs. This shows us, on average, the number of steps it takes to get from one member of the network to another.Diameter of a network
As another means of measuring network graphs, we can define the diameter of a network as the longest of all the calculated shortest paths in a network. In other words, once the shortest path length from every node to all other nodes is calculated, the diameter is the longest of all the calculated path lengths. The diameter is representative of the linear size of a network.Clustering coefficient
The clustering coefficient is a measure of an "all-my-friends-know-each-other" property. This is sometimes described as the friends of my friends are my friends. More precisely, the clustering coefficient of a node is the ratio of existing links connecting a node's neighbors to each other to the maximum possible number of such links. The clustering coefficient for the entire network is the average of the clustering coefficients of all the nodes. A high clustering coefficient for a network is another indication of a small world.The clustering coefficient of the
Ci=2eiki(ki−1),
(k2)=k(k−1)2.
Connectedness
The way in which a network is connected plays a large part into how networks are analyzed and interpreted. Networks are classified in four different categories:- Clique/Complete Graph: a completely connected network, where all nodes are connected to every other node. These networks are symmetric in that all nodes have in-links and out-links from all others.
- Giant Component: A single connected component which contains most of the nodes in the network.
- Weakly Connected Component: A collection of nodes in which there exists a path from any node to any other, ignoring directionality of the edges.
- Strongly Connected Component: A collection of nodes in which there exists a directed path from any node to any other.
Node centrality
Centrality indices produce rankings which seek to identify the most important nodes in a network model. Different centrality indices encode different contexts for the word "importance." The betweenness centrality, for example, considers a node highly important if it form bridges between many other nodes. The eigenvalue centrality, in contrast, considers a node highly important if many other highly important nodes link to it. Hundreds of such measures have been proposed in the literature.It is important to remember that centrality indices are only accurate for identifying the most central nodes. The measures are seldom, if ever, meaningful for the remainder of network nodes.[3] [4] Also, their indications are only accurate within their assumed context for importance, and tend to "get it wrong" for other contexts.[5] For example, imagine two separate communities whose only link is an edge between the most junior member of each community. Since any transfer from one community to the other must go over this link, the two junior members will have high betweenness centrality. But, since they are junior, (presumably) they have few connections to the "important" nodes in their community, meaning their eigenvalue centrality would be quite low.
The concept of centrality in the context of static networks was extended, based on empirical and theoretical research, to dynamic centrality[6] in the context of time-dependent and temporal networks.[7][8][9]
Network models
Network models serve as a foundation to understanding interactions within empirical complex networks. Various random graph generation models produce network structures that may be used in comparison to real-world complex networks.Erdős–Rényi Random Graph model

This Erdős–Rényi model is generated with N = 4 nodes. For each edge in the complete graph formed by all N nodes, a random number is generated and compared to a given probability. If the random number is greater than p, an edge is formed on the model.
The Erdős–Rényi model, named for Paul Erdős and Alfréd Rényi, is used for generating random graphs in which edges are set between nodes with equal probabilities. It can be used in the probabilistic method to prove the existence of graphs satisfying various properties, or to provide a rigorous definition of what it means for a property to hold for almost all graphs.
To generate an Erdős–Rényi model two parameters must be specified: the number of nodes in the graph generated as N and the probability that a link should be formed between any two nodes as p. A constant 〈k〉 may derived from these two components with the formula 〈k〉 = 2 ⋅ E / N = p ⋅ (N − 1), where E is the expected number of edges.
The Erdős–Rényi model has several interesting characteristics in comparison to other graphs. Because the model is generated without bias to particular nodes, the degree distribution is binomial in nature with regards to the formula:
P(deg(v)=k)=(n−1k)pk(1−p)n−1−k .
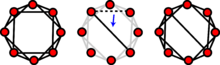
Watts-Strogatz Small World model

The Watts and Strogatz model uses the concept of rewiring to achieve its structure. The model generator will iterate through each edge in the original lattice structure. An edge may changed its connected vertices according to a given rewiring probability. <k>=4 in this example.
The Watts and Strogatz model is a random graph generation model that produces graphs with small-world properties.
An initial lattice structure is used to generate a Watts-Strogatz model. Each node in the network is initially linked to its <
As the Watts-Strogatz model begins as non-random lattice structure, it has a very high clustering coefficient along with high average path length. Each rewire is likely to create a shortcut between highly connected clusters. As the rewiring probability increases, the clustering coefficient decreases slower than the average path length. In effect, this allows the average path length of the network to decrease significantly with only slightly decreases in clustering coefficient. Higher values of p force more rewired edges, which in effect makes the Watts-Strogatz model a random network.
Barabási–Albert (BA) Preferential Attachment model
The Barabási–Albert model is a random network model used to demonstrate a preferential attachment or a "rich-get-richer" effect. In this model, an edge is most likely to attach to nodes with higher degrees. The network begins with an initial network of m0 nodes. m0 ≥ 2 and the degree of each node in the initial network should be at least 1, otherwise it will always remain disconnected from the rest of the network.In the BA model, new nodes are added to the network one at a time. Each new node is connected to
pi=ki∑jkj,

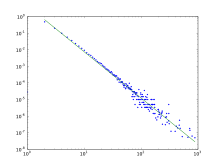
The degree distribution of the BA Model, which follows a power law. In loglog scale the power law function is a straight line.[11]
The degree distribution resulting from the BA model is scale free, in particular, it is a power law of the form:
P(k)∼k−3
Network analysis
Social network analysis
Social network analysis examines the structure of relationships between social entities.[13] These entities are often persons, but may also be groups, organizations, nation states, web sites, scholarly publications.Since the 1970s, the empirical study of networks has played a central role in social science, and many of the mathematical and statistical tools used for studying networks have been first developed in sociology.[14] Amongst many other applications, social network analysis has been used to understand the diffusion of innovations, news and rumors. Similarly, it has been used to examine the spread of both diseases and health-related behaviors. It has also been applied to the study of markets, where it has been used to examine the role of trust in exchange relationships and of social mechanisms in setting prices. Similarly, it has been used to study recruitment into political movements and social organizations. It has also been used to conceptualize scientific disagreements as well as academic prestige. More recently, network analysis (and its close cousin traffic analysis) has gained a significant use in military intelligence, for uncovering insurgent networks of both hierarchical and leaderless nature.[15][16]
Dynamic network analysis
Dynamic Network Analysis examines the shifting structure of relationships among different classes of entities in complex socio-technical systems effects, and reflects social stability and changes such as the emergence of new groups, topics, and leaders.[6][7][8][9] Dynamic Network Analysis focuses on meta-networks composed of multiple types of nodes (entities) and multiple types of links. These entities can be highly varied.[6] Examples include people, organizations, topics, resources, tasks, events, locations, and beliefs.Dynamic network techniques are particularly useful for assessing trends and changes in networks over time, identification of emergent leaders, and examining the co-evolution of people and ideas.
Biological network analysis
With the recent explosion of publicly available high throughput biological data, the analysis of molecular networks has gained significant interest. The type of analysis in this content are closely related to social network analysis, but often focusing on local patterns in the network. For example network motifs are small subgraphs that are over-represented in the network. Activity motifs are similar over-represented patterns in the attributes of nodes and edges in the network that are over represented given the network structure. The analysis of biological networks has led to the development of network medicine, which looks at the effect of diseases in the interactome.[17]Link analysis
Link analysis is a subset of network analysis, exploring associations between objects. An example may be examining the addresses of suspects and victims, the telephone numbers they have dialed and financial transactions that they have partaken in during a given timeframe, and the familial relationships between these subjects as a part of police investigation. Link analysis here provides the crucial relationships and associations between very many objects of different types that are not apparent from isolated pieces of information. Computer-assisted or fully automatic computer-based link analysis is increasingly employed by banks and insurance agencies in fraud detection, by telecommunication operators in telecommunication network analysis, by medical sector in epidemiology and pharmacology, in law enforcement investigations, by search engines for relevance rating (and conversely by the spammers for spamdexing and by business owners for search engine optimization), and everywhere else where relationships between many objects have to be analyzed.Network robustness
The structural robustness of networks[18] is studied using percolation theory. When a critical fraction of nodes is removed the network becomes fragmented into small clusters. This phenomenon is called percolation[19] and it represents an order-disorder type of phase transition with critical exponents.Pandemic Analysis
The SIR Model is one of the most well known algorithms on predicting the spread of global pandemics within an infectious population.Susceptible to Infected
The formula above describes the "force" of infection for each susceptible unit in an infectious population, where β is equivalent to the transmission rate of said disease.
To track the change of those susceptible in an infectious population:
Infected to Recovered
Over time, the number of those infected fluctuates by: the specified rate of recovery, represented by
Infectious Period
Whether a population will be overcome by a pandemic, with regards to the SIR model, is dependent on the value ofWeb Link Analysis
Several Web search ranking algorithms use link-based centrality metrics, including (in order of appearance) Marchiori's Hyper Search, Google's PageRank, Kleinberg's HITS algorithm, the CheiRank and TrustRank algorithms. Link analysis is also conducted in information science and communication science in order to understand and extract information from the structure of collections of web pages. For example the analysis might be of the interlinking between politicians' web sites or blogs.PageRank
PageRank works by randomly picking "nodes" or websites and then with a certain probability, "randomly jumping" to other nodes. By randomly jumping to these other nodes, it helps PageRank completely traverse the network as some webpages exist on the periphery and would not as readily be assessed.Each node,
Random Jumping
As explained above, PageRank enlists random jumps in attempts to assign PageRank to every website on the internet. These random jumps find websites that might not be found during the normal search methodologies such as Breadth-First Search and Depth-First Search.In an improvement over the aforementioned formula for determining PageRank includes adding these random jump components. Without the random jumps, some pages would receive a PageRank of 0 which would not be good.
The first is
Another way of looking at it:
Centrality measures
Information about the relative importance of nodes and edges in a graph can be obtained through centrality measures, widely used in disciplines like sociology. Centrality measures are essential when a network analysis has to answer questions such as: "Which nodes in the network should be targeted to ensure that a message or information spreads to all or most nodes in the network?" or conversely, "Which nodes should be targeted to curtail the spread of a disease?". Formally established measures of centrality are degree centrality, closeness centrality, betweenness centrality, eigenvector centrality, and katz centrality. The objective of network analysis generally determines the type of centrality measure(s) to be used.[13]- Degree centrality of a node in a network is the number of links (vertices) incident on the node.
- Closeness centrality determines how "close" a node is to other nodes in a network by measuring the sum of the shortest distances (geodesic paths) between that node and all other nodes in the network.
- Betweenness centrality determines the relative importance of a node by measuring the amount of traffic flowing through that node to other nodes in the network. This is done by measuring the fraction of paths connecting all pairs of nodes and containing the node of interest. Group Betweenness centrality measures the amount of traffic flowing through a group of nodes.[20]
- Eigenvector centrality is a more sophisticated version of degree centrality where the centrality of a node not only depends on the number of links incident on the node but also the quality of those links. This quality factor is determined by the eigenvectors of the adjacency matrix of the network.
- Katz centrality of a node is measured by summing the geodesic paths between that node and all (reachable) nodes in the network. These paths are weighted, paths connecting the node with its immediate neighbors carry higher weights than those which connect with nodes farther away from the immediate neighbors.
Spread of content in networks
Content in a complex network can spread via two major methods: conserved spread and non-conserved spread.[21] In conserved spread, the total amount of content that enters a complex network remains constant as it passes through. The model of conserved spread can best be represented by a pitcher containing a fixed amount of water being poured into a series of funnels connected by tubes . Here, the pitcher represents the original source and the water is the content being spread. The funnels and connecting tubing represent the nodes and the connections between nodes, respectively. As the water passes from one funnel into another, the water disappears instantly from the funnel that was previously exposed to the water. In non-conserved spread, the amount of content changes as it enters and passes through a complex network. The model of non-conserved spread can best be represented by a continuously running faucet running through a series of funnels connected by tubes . Here, the amount of water from the original source is infinite Also, any funnels that have been exposed to the water continue to experience the water even as it passes into successive funnels. The non-conserved model is the most suitable for explaining the transmission of most infectious diseases.The SIR Model
In 1927, W. O. Kermack and A. G. McKendrick created a model in which they considered a fixed population with only three compartments, susceptible:The compartments used for this model consist of three classes:
S(t) is used to represent the number of individuals not yet infected with the disease at time t, or those susceptible to the diseaseI(t) denotes the number of individuals who have been infected with the disease and are capable of spreading the disease to those in the susceptible categoryR(t) is the compartment used for those individuals who have been infected and then recovered from the disease. Those in this category are not able to be infected again or to transmit the infection to others.
S→I→R
dSdt=−βSI dIdt=βSI−γI dRdt=γI
More can be read on this model on the Epidemic model page.
Interdependent networks
An interdependent network is a system of coupled networks where nodes of one or more networks depend on nodes in other networks. Such dependencies are enhanced by the developments in modern technology. Dependencies may lead to cascading failures between the networks and a relatively small failure can lead to a catastrophic breakdown of the system. Blackouts are a fascinating demonstration of the important role played by the dependencies between networks. A recent study developed a framework to study the cascading failures in an interdependent networks system.[22][23]Network optimization
Network problems that involve finding an optimal way of doing something are studied under the name of combinatorial optimization. Examples include network flow, shortest path problem, transport problem, transshipment problem, location problem, matching problem, assignment problem, packing problem, routing problem, Critical Path Analysis and PERT (Program Evaluation & Review Technique).Network science research centers
- Duke Network Analysis Center[24]
- IBM's Network Science Research Center (NSRC)[25]
- Network Science Collaborative Technology Alliance (US Army Research Laboratory)[26]
- Network Science and Technology (NEST) Center (Rensselaer Polytechnic Institute)[27]
- CEU Center for Network Science (Central European University , founded in 2009)
- Center for Networks and Relational Analysis (University of California-Irvine)[28]
- Interdisciplinary Center for Network Science and Applications (iCeNSA) (University of Notre Dame[29]
- Technology Center for Networks & Pathways (Johns Hopkins University[30]
- Yale Institute of Network Science (YINS)[31]
- Social Cognitive Networks Academic Research Center at RPI (SNARC)[32]
- Warren Center for Network and Data Sciences at Penn (YINS)[33]
Network analysis and visualization tools
- Graph-tool and NetworkX, free and efficient Python modules for manipulation and statistical analysis of networks. [2] [3]
- igraph, an open source C library for the analysis of large-scale complex networks, with interfaces to R, Python and Ruby.
- Orange, a free data mining software suite, module orngNetwork
- Pajek, program for (large) network analysis and visualization.
- Tulip, a free data mining and visualization software dedicated to the analysis and visualization of relational data. [4]
- SEMOSS, an RDF-based open source context-aware analytics tool written in Java leveraging the SPARQL query language.
- ORA, a tool for Dynamic Network Analysis and network visualization.[34]


