From Wikipedia, the free encyclopedia
A parabola (/pəˈræbələ/; plural parabolas or parabolae, adjective parabolic, from Greek: παραβολή) is a two-dimensional, mirror-symmetrical curve, which is approximately U-shaped when oriented as shown in the diagram below, but which can be in any orientation in its plane. It fits any of several superficially different mathematical descriptions which can all be proved to define curves of exactly the same shape.
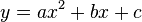
One description of a parabola involves a point (the focus) and a line (the directrix). The focus does not lie on the directrix. The parabola is the locus of points in that plane that are equidistant from both the directrix and the focus. Another description of a parabola is as a conic section, created from the intersection of a right circular conical surface and a plane which is parallel to another plane which is tangential to the conical surface.[a] A third description is algebraic. A parabola is a graph of a quadratic function, such as

The line perpendicular to the directrix and passing through the focus (that is, the line that splits the parabola through the middle) is called the "axis of symmetry". The point on the axis of symmetry that intersects the parabola is called the "vertex", and it is the point where the curvature is greatest. The distance between the vertex and the focus, measured along the axis of symmetry, is the "focal length". The "latus rectum" is the chord of the parabola which is parallel to the directrix and passes through the focus. Parabolas can open up, down, left, right, or in some other arbitrary direction. Any parabola can be repositioned and rescaled to fit exactly on any other parabola — that is, all parabolas are geometrically similar.
Parabolas have the property that, if they are made of material that reflects light, then light which travels parallel to the axis of symmetry of a parabola and strikes its concave side is reflected to its focus, regardless of where on the parabola the reflection occurs. Conversely, light that originates from a point source at the focus is reflected into a parallel ("collimated") beam, leaving the parabola parallel to the axis of symmetry. The same effects occur with sound and other forms of energy. This reflective property is the basis of many practical uses of parabolas.
The parabola has many important applications, from a parabolic antenna or parabolic microphone to automobile headlight reflectors to the design of ballistic missiles. They are frequently used in physics, engineering, and many other areas.
Strictly, the adjective parabolic should be applied only to things that are shaped as a parabola, which is a two-dimensional shape. However, as shown in the last paragraph, the same adjective is commonly used for three-dimensional objects, such as parabolic reflectors, which are really paraboloids. Sometimes, the noun parabola is also used to refer to these objects. Though not perfectly correct, this usage is generally understood.

Introductory images

- Parabolic Cartesian graph of the function y=6x2+4x-8
-
 A parabola obtained as the intersection of a cone with a (red) plane parallel to a (checkered) plane which is tangential to the cone's surface.
 -
 Parabolic curve showing directrix (L) and focus (F). The distance from any point on the parabola to the focus (PnF) equals the perpendicular distance from the same point on the parabola to the directrix (PnQn).
 -
 For description, see text below.


Description of final image
Parabolic curve showing chord (L), focus (F), and vertex (V). L is an arbitrary chord of the parabola perpendicular to its axis of symmetry, which passes through V and F. (The ends of the chord are not shown here.) The lengths of all paths Qn - Pn - F are the same, equalling the distance between the chord L and the directrix. (See previous image.) This is similar to saying that a parabola is an ellipse, but with one focal point at infinity. It also directly implies, by the wave nature of light, that parallel light arriving along the lines Qn - Pn will be reflected to converge at F. A linear wavefront along L is concentrated, after reflection, to the one point where all parts of it have travelled equal distances and are in phase, namely F. No consideration of angles is requiredHistory

The earliest known work on conic sections was by Menaechmus in the fourth century BC. He discovered a way to solve the problem of doubling the cube using parabolas. (The solution, however, does not meet the requirements imposed by compass and straightedge construction). The area enclosed by a parabola and a line segment, the so-called "parabola segment", was computed by Archimedes via the method of exhaustion in the third century BC, in his The Quadrature of the Parabola. The name "parabola" is due to Apollonius who discovered many properties of conic sections. It means "application", referring to "application of areas" concept, that has a connection with this curve, as Apollonius had proved.[1] The focus–directrix property of the parabola and other conics is due to Pappus.
Galileo showed that the path of a projectile follows a parabola, a consequence of uniform acceleration due to gravity.
The idea that a parabolic reflector could produce an image was already well known before the invention of the reflecting telescope.[2] Designs were proposed in the early to mid seventeenth century by many mathematicians including René Descartes, Marin Mersenne,[3] and James Gregory.[4] When Isaac Newton built the first reflecting telescope in 1668, he skipped using a parabolic mirror because of the difficulty of fabrication, opting for a spherical mirror. Parabolic mirrors are used in most modern reflecting telescopes and in satellite dishes and radar receivers.[5]
Equation in Cartesian coordinates
Let the directrix be the line x = −p and let the focus be the point (p, 0). If (x, y) is a point on the parabola then, by definition of a parabola, it is the same distance from the directrix as the focus; in other words:


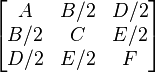
More generally, a parabola is a curve in the Cartesian plane defined by an irreducible equation — one that does not factor as a product of two not necessarily distinct linear equations — of the general conic form


Conic section and quadratic form
 |
Cone with cross-sections (To enlarge, click on diagram. To shrink, go to previous page.)
|
Thus:
 (The triangle BPM is isosceles.)
 (The triangle BPM is
  (PMCK is a parallelogram.)
 (PMCK is a

Focal length
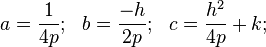
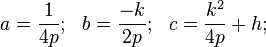
It is proved below that if a parabola has an equation of the form where
where  is a positive constant, then
  where
where  is its focal length. Comparing this with the last equation above shows that the focal length of the above parabola is
  .
.Position of the focus
In the diagram, the point F is the foot of the perpendicular from the point V to the plane of the parabola.[c] By symmetry, F is on the axis of symmetry of the parabola. Angle VPF is complementary to θ, and angle PVF is complementary to angle VPF, therefore angle PVF is θ. Since the length of PV is r, the distance of F from the vertex of the parabola is r sin θ. It is shown above that this distance equals the focal length of the parabola, which is the distance from the vertex to the focus. The focus and the point F are therefore equally distant from the vertex, along the same line, which implies that they are the same point. Therefore the position of the focus is at F.Other geometric definitions
A parabola may also be characterized as a conic section with an eccentricity of 1. As a consequence of this, all parabolas are similar, meaning that while they can be different sizes, they are all the same shape. Another consequence is that the universal parabolic constant is the same for all parabolas.[7] A parabola can also be obtained as the limit of a sequence of ellipses where one focus is kept fixed as the other is allowed to move arbitrarily far away in one direction. In this sense, a parabola may be considered an ellipse that has one focus at infinity. The parabola is an inverse transform of a cardioid.A parabola has a single axis of reflective symmetry, which passes through its focus and is perpendicular to its directrix. The point of intersection of this axis and the parabola is called the vertex. A parabola spun about this axis in three dimensions traces out a shape known as a paraboloid of revolution.
The parabola is found in numerous situations in the physical world (see below).
Equations
Cartesian
In the following equations and
and  are the coordinates of the vertex
  of the parabola and
  is the distance from the vertex to the focus and the vertex to the directrix.
Vertical axis of symmetry


 .
.

 .
.
Horizontal axis of symmetry


 .
.

 .
.
General parabola
The general form for a parabola is

 .
.
 .
.

Latus rectum, semilatus rectum, and polar coordinates
In Polar coordinate system, a parabola with the focus at the origin and the directrix parallel to the y-axis, is given by the equation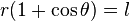
The latus rectum is the chord that passes through the focus and is perpendicular to the axis of symmetry. It has a length of 2l.
Dimensions of parabolas with axes of symmetry parallel to the y-axis
These parabolas have equations of the form . By interchanging
  and
and  the parabolas' axes of symmetry become parallel to the x-axis.
 |
Some features of a parabola
|
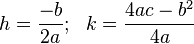
Coordinates of the vertex
The x-coordinate at the vertex can be found by completing the square to put the equation in vertex form, or by differentiating the original equation, setting the resulting  equal to zero (a critical point), and solving for . Both methods yield:
  .
.Substituting this into the original equation yields:


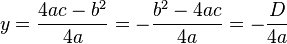 , where
  is the discriminant.
 , where
  .
.Coordinates of the focus
Since the axis of symmetry of this parabola is parallel with the y-axis, the x-coordinates of the focus and the vertex are equal. The coordinates of the vertex are calculated in the preceding section. The x-coordinate of the focus is therefore also
To find the y-coordinate of the focus, consider the point, P, located on the parabola where the slope is 1, so the tangent to the parabola at P is inclined at 45 degrees to the axis of symmetry. Using the reflective property of a parabola, we know that light which is initially travelling parallel to the axis of symmetry is reflected at P toward the focus. The 45-degree inclination causes the light to be turned 90 degrees by the reflection, so it travels from P to the focus along a line that is perpendicular to the axis of symmetry and to the y-axis. This means that the y-coordinate of P must equal that of the focus.
By differentiating the equation of the parabola and setting the slope to 1, we find the x-coordinate of P:


 in the equation of the parabola, we find the y-coordinate of P, and also of the focus:


 is the discriminant, as used in the "Coordinates of the vertex" section.
The focus is therefore the point:

Axis of symmetry, focal length, latus rectum, and directrix
The above coordinates of the focus of a parabola of the form:

The axis of symmetry is the line which passes through both the focus and the vertex. In this case, it is vertical, with equation:
 .
.
 .
.

 See the section "Conic section and quadratic form", above.
The point where the slope of the parabola is 1 lies at one end of the latus rectum. The length of the semilatus rectum (half of the latus rectum) is the difference between the x-coordinates of this point, which is considered as P in the above derivation of the coordinates of the focus, and of the focus itself. Thus, the length of the semilatus rectum is:


 , where
  is the focal length.
 , where
 Measured along the axis of symmetry, the vertex is the midpoint between the focus and the directrix. Therefore, the equation of the directrix is:

Proof of the reflective property

The reflective property states that, if a parabola can reflect light, then light which enters it travelling parallel to the axis of symmetry is reflected to the focus. This is derived from the wave nature of light in the caption to a diagram near the top of this article. This derivation is valid, but may not be satisfying to readers who would prefer a mathematical approach. In the following proof, the fact that every point on the parabola is equidistant from the focus and from the directrix is taken as axiomatic.
Consider the parabola
Since all parabolas are similar, this simple case represents all others. The right-hand side of the diagram shows part of this parabola.Construction and definitions
The point E is an arbitrary point on the parabola, with coordinates
 The focus is F, the vertex is A (the origin), and the line FA (the y-axis) is the axis of symmetry. The line EC is parallel to the axis of symmetry, and intersects the x-axis at D. The point C is located on the directrix (which is not shown, to minimize clutter). The point B is the midpoint of the line segment FC.
Deductions
Measured along the axis of symmetry, the vertex, A, is equidistant from the focus, F, and from the directrix. Correspondingly, since C is on the directrix, the y-coordinates of F and C are equal in absolute value and opposite in sign. B is the midpoint of FC, so its y-coordinate is zero, so it lies on the x-axis. Its x-coordinate is half that of E, D, and C, i.e.
 The slope of the line BE is the quotient of the lengths of ED and BD, which is
  which comes to
But
 is also the slope (first derivative) of the parabola at E. Therefore the line BE is the tangent to the parabola at E.
The distances EF and EC are equal because E is on the parabola, F is the focus and C is on the directrix. Therefore, since B is the midpoint of FC, triangles FEB and CEB are congruent (three sides), which implies that the angles marked
 are congruent. (The angle above E is vertically opposite angle BEC.) This means that a ray of light which enters the parabola and arrives at E travelling parallel to the axis of symmetry will be reflected by the line BE so it travels along the line EF, as shown in red in the diagram (assuming that the lines can somehow reflect light). Since BE is the tangent to the parabola at E, the same reflection will be done by an infinitesimal arc of the parabola at E.
Therefore, light that enters the parabola and arrives at E travelling parallel to the axis of symmetry of the parabola is reflected by the parabola toward its focus.
The point E has no special characteristics. This conclusion about reflected light applies to all points on the parabola, as is shown on the left side of the diagram. This is the reflective property.
Other consequences
There are other theorems that can be deduced simply from the above argument.Tangent bisection property
The above proof, and the accompanying diagram, show that the tangent BE bisects the angle FEC. In other words, the tangent to the parabola at any point bisects the angle between the lines joining the point to the focus, and perpendicularly to the directrix.Intersection of a tangent and perpendicular from focus

Since triangles FBE and CBE are congruent, FB is perpendicular to the tangent BE. Since B is on the x-axis, which is the tangent to the parabola at its vertex, it follows that the point of intersection between any tangent to a parabola and the perpendicular from the focus to that tangent lies on the line that is tangential to the parabola at its vertex.
See animated diagram.[8]
Reflection of light striking the convex side
If light travels along the line CE, it moves parallel to the axis of symmetry and strikes the convex side of the parabola at E. It is clear from the above diagram that this light will be reflected directly away from the focus, along an extension of the segment FE.Alternative proofs

The above proofs of the reflective and tangent bisection properties use a line of calculus. For readers who are not comfortable with calculus, the following alternative is presented.
In this diagram, F is the focus of the parabola, and T and U lie on its directrix. P is an arbitrary point on the parabola. PT is perpendicular to the directrix, and the line MP bisects angle FPT. Q is another point on the parabola, with QU perpendicular to the directrix. We know that FP=PT and FQ=QU. Clearly, QT>QU, so QT>FQ. All points on the bisector MP are equidistant from F and T, but Q is closer to F than to T. This means that Q is to the "left" of MP, i.e. on the same side of it as the focus. The same would be true if Q were located anywhere else on the parabola (except at the point P), so the entire parabola, except the point P, is on the focus side of MP. Therefore MP is the tangent to the parabola at P. Since it bisects the angle FPT, this proves the tangent bisection property.
The logic of the last paragraph can be applied to modify the above proof of the reflective property. It effectively proves the line BE to be the tangent to the parabola at E if the angles
are equal. The reflective property follows as shown previously.Tangent properties
Let the line of symmetry intersect the parabola at point Q, and denote the focus as point F and its distance from point Q as f. Let the perpendicular to the line of symmetry, through the focus, intersect the parabola at a point T.
Then (1) the distance from F to T is 2f, and (2) a tangent to the parabola at point T intersects the line of symmetry at a 45° angle.[9]:p.26
Orthoptic property
If two tangents to a parabola are perpendicular to each other, then they intersect on the directrix. Conversely, two tangents which intersect on the directrix are perpendicular.
Proof
Without loss of generality, consider the parabola
 Suppose that two tangents contact this parabola at the points
  and
and  Their slopes are
  and
and  respectively. Thus the equation of the first tangent is of the form
  where
where  is a constant. In order to make the line pass through
  the value of must be
  so the equation of this tangent is
  Likewise, the equation of the other tangent is
  At the intersection point of the two tangents,
  Thus
Thus  Factoring the difference of squares, cancelling, and dividing by 2 gives
  Substituting this into one of the equations of the tangents gives an expression for the y-coordinate of the intersection point:
  Simplifying this gives
We now use the fact that these tangents are perpendicular. The product of the slopes of perpendicular lines is −1, assuming that both of the slopes are finite. The slopes of our tangents are
and , so  so
so  Thus the y-coordinate of the intersection point of the tangents is given by
  This is also the equation of the directrix of this parabola, so the two perpendicular tangents intersect on the directrix.
Lambert's theorem
Let three tangents to a parabola form a triangle. Then Lambert's theorem states that the focus of the parabola lies on the circumcircle of the triangle.[8]:Corollary 20 [10]Tsukerman's converse to Lambert's theorem states that, given three lines that bound a triangle, if two of the lines are tangent to a parabola whose focus lies on the circumcircle of the triangle, then the third line is also tangent to the parabola.[11]
Focal length calculated from parameters of a chord
Suppose a chord crosses a parabola perpendicular to its axis of symmetry. Let the length of the chord between the points where it intersects the parabola be and the distance from the vertex of the parabola to the chord, measured along the axis of symmetry, be
  The focal length,
  of the parabola is given by:
Suppose a system of Cartesian coordinates is used such that the vertex of the parabola is at the origin, and the axis of symmetry is the y-axis. The parabola opens upward. It is shown elsewhere in this article that the equation of the parabola is 4fy=x2, where f is the focal length. At the positive-x end of the chord, x=c/2 and y=d. Since this point is on the parabola, these coordinates must satisfy the equation above. Therefore, by substitution, 4fd=(c/2)2. From this, f=c2/(16d).
Area enclosed between a parabola and a chord
Parabola (magenta) and line (lower light blue) including a chord (blue). The area enclosed between them is in pink. The chord itself ends at the points where the line intersects the parabola.
|
 |
The area enclosed between a parabola and a chord (see diagram) is two-thirds of the area of a parallelogram which surrounds it. One side of the parallelogram is the chord, and the opposite side is a tangent to the parabola.[12][13] The slope of the other parallel sides is irrelevant to the area. Often, as here, they are drawn parallel with the parabola's axis of symmetry, but this is arbitrary.
A theorem equivalent to this one, but different in details, was derived by Archimedes in the 3rd Century BCE. He used the areas of triangles, rather than that of the parallelogram.[d] See the article "The Quadrature of the Parabola".
If the chord has length b, and is perpendicular to the parabola's axis of symmetry, and if the perpendicular distance from the parabola's vertex to the chord is h, the parallelogram is a rectangle, with sides of b and h. The area, A, of the parabolic segment enclosed by the parabola and the chord is therefore:
 .
.
In general, the enclosed area can be calculated as follows. First, locate the point on the parabola where its slope equals that of the chord. This can be done with calculus, or by using a line that is parallel with the axis of symmetry of the parabola and passes through the midpoint of the chord. The required point is where this line intersects the parabola.[e] Then, using the formula given in the article "Distance from a point to a line", calculate the perpendicular distance from this point to the chord. Multiply this by the length of the chord to get the area of the parallelogram, then by to get the required enclosed area.
A theorem equivalent to this one, but different in details, was derived by Archimedes in the 3rd Century BCE. He used the areas of triangles, rather than that of the parallelogram.[d] See the article "The Quadrature of the Parabola".
If the chord has length b, and is perpendicular to the parabola's axis of symmetry, and if the perpendicular distance from the parabola's vertex to the chord is h, the parallelogram is a rectangle, with sides of b and h. The area, A, of the parabolic segment enclosed by the parabola and the chord is therefore:

 .
.In general, the enclosed area can be calculated as follows. First, locate the point on the parabola where its slope equals that of the chord. This can be done with calculus, or by using a line that is parallel with the axis of symmetry of the parabola and passes through the midpoint of the chord. The required point is where this line intersects the parabola.[e] Then, using the formula given in the article "Distance from a point to a line", calculate the perpendicular distance from this point to the chord. Multiply this by the length of the chord to get the area of the parallelogram, then by
 to get the required enclosed area.
Corollary concerning midpoints and endpoints of chords
A corollary of the above discussion is that if a parabola has several parallel chords, their midpoints all lie on a line which is parallel to the axis of symmetry. If tangents to the parabola are drawn through the endpoints of any of these chords, the two tangents intersect on this same line parallel to the axis of symmetry.[f]Length of an arc of a parabola
If a point X is located on a parabola which has focal length and if is the perpendicular distance from X to the axis of symmetry of the parabola, then the lengths of arcs of the parabola which terminate at X can be calculated from and as follows, assuming they are all expressed in the same units.[g]

 , is the length of the arc between X and the vertex of the parabola.
The length of the arc between X and the symmetrically opposite point on the other side of the parabola is

The perpendicular distance,
, can be given a positive or negative sign to indicate on which side of the axis of symmetry X is situated. Reversing the sign of reverses the signs of and without changing their absolute values. If these quantities are signed, the length of the arc between any two points on the parabola is always shown by the difference between their values of  The calculation can be simplified by using the properties of logarithms:
This calculation can be used for a parabola in any orientation. It is not restricted to the situation where the axis of symmetry is parallel to the y-axis.
Focal length and radius of curvature at the vertex
The focal length of a parabola is half of its radius of curvature at its vertex.Proof
-
 Image is inverted. A"B" is x-axis. C is origin. O is centre. A is (x,y). OA=OC=R. PA=x. CP=y. OP=(R-y). Other points and lines are irrelevant for this purpose.
 -
 The radius of curvature at the vertex is twice the focal length. The measurements shown on the above diagram are in units of the latus rectum, which is four times the focal length.
 -


 on a circle of radius
  and with centre at the point
  The circle passes through the origin. If the point is near the origin, the Pythagorean Theorem shows that:


But, if
is extremely close to the origin, since the x-axis is a tangent to the circle, is very small compared with  so
so  is negligible compared with the other terms. Therefore, extremely close to the origin:
 .....(Equation 1)
 .....(Equation 1)
 ......(Equation 2)
 ......(Equation 2)
 . (See preceding sections of this article.)
Equations 1 and 2 are equivalent if
 Therefore this is the condition for the circle and parabola to coincide at and extremely close to the origin. The radius of curvature at the origin, which is the vertex of the parabola, is twice the focal length.
Corollary
A concave mirror which is a small segment of a sphere behaves approximately like a parabolic mirror, focusing parallel light to a point which is midway between the centre and the surface of the sphere.
Mathematical generalizations
In algebraic geometry, the parabola is generalized by the rational normal curves, which have coordinates the standard parabola is the case
  and the case
  is known as the twisted cubic. A further generalization is given by the Veronese variety, when there is more than one input variable.
In the theory of quadratic forms, the parabola is the graph of the quadratic form
 (or other scalings), while the elliptic paraboloid is the graph of the positive-definite quadratic form
  (or scalings) and the hyperbolic paraboloid is the graph of the indefinite quadratic form
  Generalizations to more variables yield further such objects.
The curves
 for other values of p are traditionally referred to as the higher parabolas, and were originally treated implicitly, in the form
  for p and q both positive integers, in which form they are seen to be algebraic curves. These correspond to the explicit formula
  for a positive fractional power of x. Negative fractional powers correspond to the implicit equation
  and are traditionally referred to as higher hyperbolas. Analytically, x can also be raised to an irrational power (for positive values of x); the analytic properties are analogous to when x is raised to rational powers, but the resulting curve is no longer algebraic, and cannot be analyzed via algebraic geometry.
Parabolas in the physical world
In nature, approximations of parabolas and paraboloids are found in many diverse situations. The best-known instance of the parabola in the history of physics is the trajectory of a particle or body in motion under the influence of a uniform gravitational field without air resistance (for instance, a baseball flying through the air, neglecting air friction).The parabolic trajectory of projectiles was discovered experimentally by Galileo in the early 17th century, who performed experiments with balls rolling on inclined planes. He also later proved this mathematically in his book Dialogue Concerning Two New Sciences.[14][h] For objects extended in space, such as a diver jumping from a diving board, the object itself follows a complex motion as it rotates, but the center of mass of the object nevertheless forms a parabola. As in all cases in the physical world, the trajectory is always an approximation of a parabola. The presence of air resistance, for example, always distorts the shape, although at low speeds, the shape is a good approximation of a parabola. At higher speeds, such as in ballistics, the shape is highly distorted and does not resemble a parabola.
Another hypothetical situation in which parabolas might arise, according to the theories of physics described in the 17th and 18th Centuries by Sir Isaac Newton, is in two-body orbits; for example the path of a small planetoid or other object under the influence of the gravitation of the Sun. Parabolic orbits do not occur in nature; simple orbits most commonly resemble hyperbolas or ellipses. The parabolic orbit is the degenerate intermediate case between those two types of ideal orbit. An object following a parabolic orbit would travel at the exact escape velocity of the object it orbits; objects in elliptical or hyperbolic orbits travel at less or greater than escape velocity, respectively. Long-period comets travel close to the Sun's escape velocity while they are moving through the inner solar system, so their paths are close to being parabolic.
Approximations of parabolas are also found in the shape of the main cables on a simple suspension bridge. The curve of the chains of a suspension bridge is always an intermediate curve between a parabola and a catenary, but in practice the curve is generally nearer to a parabola, and in calculations the second degree parabola is used.[15][16] Under the influence of a uniform load (such as a horizontal suspended deck), the otherwise catenary-shaped cable is deformed toward a parabola. Unlike an inelastic chain, a freely hanging spring of zero unstressed length takes the shape of a parabola. Suspension-bridge cables are, ideally, purely in tension, without having to carry other, e.g. bending, forces. Similarly, the structures of parabolic arches are purely in compression.
Paraboloids arise in several physical situations as well. The best-known instance is the parabolic reflector, which is a mirror or similar reflective device that concentrates light or other forms of electromagnetic radiation to a common focal point, or conversely, collimates light from a point source at the focus into a parallel beam. The principle of the parabolic reflector may have been discovered in the 3rd century BC by the geometer Archimedes, who, according to a legend of debatable veracity,[17] constructed parabolic mirrors to defend Syracuse against the Roman fleet, by concentrating the sun's rays to set fire to the decks of the Roman ships. The principle was applied to telescopes in the 17th century. Today, paraboloid reflectors can be commonly observed throughout much of the world in microwave and satellite-dish receiving and transmitting antennas.
In parabolic microphones, a parabolic reflector that reflects sound, but not necessarily electromagnetic radiation, is used to focus sound onto a microphone, giving it highly directional performance.
Paraboloids are also observed in the surface of a liquid confined to a container and rotated around the central axis. In this case, the centrifugal force causes the liquid to climb the walls of the container, forming a parabolic surface.
This is the principle behind the liquid mirror telescope.
Aircraft used to create a weightless state for purposes of experimentation, such as NASA's "Vomit Comet," follow a vertically parabolic trajectory for brief periods in order to trace the course of an object in free fall, which produces the same effect as zero gravity for most purposes.
In the United States, vertical curves in roads are usually parabolic by design.
Gallery
-
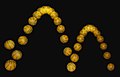 A bouncing ball captured with a stroboscopic flash at 25 images per second. Note that the ball becomes significantly non-spherical after each bounce, especially after the first. That, along with spin and air resistance, causes the curve swept out to deviate slightly from the expected perfect parabola.
 -
 Parabolic trajectories of water in a fountain.
 -
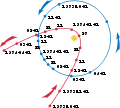 The path (in red) of Comet Kohoutek as it passed through the inner solar system, showing its nearly parabolic shape. The blue orbit is the Earth's
 -
 Hercilio Luz Bridge, Florianópolis, Brazil. The supporting cables of suspension bridges follow a curve which is intermediate between a parabola and a catenary.[15]
 -
 The Rainbow Bridge across the Niagara River, connecting Canada (left) to the United States (right). The parabolic arch is in compression, and carries the weight of the road.
 -
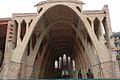 Parabolic arches used in architecture
 -
 Parabolic shape formed by a liquid surface under rotation. Two liquids of different densities completely fill a narrow space between two sheets of transparent plastic. The gap between the sheets is closed at the bottom, sides and top. The whole assembly is rotating around a vertical axis passing through the centre. (See Rotating furnace)
 -
 Parabolic microphone with optically transparent plastic reflector, used to overhear referee conversations at an American college football game.
 -
 Array of parabolic troughs to collect solar energy
 -
 Edison's searchlight, mounted on a cart. The light had a parabolic reflector.
 -
 Physicist Stephen Hawking in an aircraft flying a parabolic trajectory to produce zero-gravity


.jpg)


 has a
has a  is infinite: any similar graph is said to exhibit hyperbolic growth.
 , the function will exhibit hyperbolic growth, with a singularity at
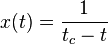
 : in the
  , the function goes to infinity.
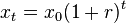
 is a
is a 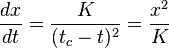


 .
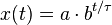
. , then the log (to any base) of x
 satisfies the


