Search This Blog

Tuesday, July 2, 2019

Climate change and ecosystems

From Wikipedia, the free encyclopedia

Rainforest ecosystems are rich in biodiversity. This is the Gambia River in Senegal's Niokolo-Koba National Park.
 
This article is about climate change and ecosystems. Future climate change is expected to affect particular ecosystems, including tundra, mangroves, coral reefs, and caves.

General

Unchecked global warming could affect most terrestrial ecoregions. Increasing global temperature means that ecosystems will change; some species are being forced out of their habitats (possibly to extinction) because of changing conditions, while others are flourishing. Secondary effects of global warming, such as lessened snow cover, rising sea levels, and weather changes, may influence not only human activities but also the ecosystem

For the IPCC Fourth Assessment Report, experts assessed the literature on the impacts of climate change on ecosystems. Rosenzweig et al. (2007) concluded that over the last three decades, human-induced warming had likely had a discernible influence on many physical and biological systems (p. 81). Schneider et al. (2007) concluded, with very high confidence, that regional temperature trends had already affected species and ecosystems around the world (p. 792). With high confidence, they concluded that climate change would result in the extinction of many species and a reduction in the diversity of ecosystems (p. 792).
  • Terrestrial ecosystems and biodiversity: With a warming of 3 °C, relative to 1990 levels, it is likely that global terrestrial vegetation would become a net source of carbon (Schneider et al., 2007:792). With high confidence, Schneider et al. (2007:788) concluded that a global mean temperature increase of around 4 °C (above the 1990-2000 level) by 2100 would lead to major extinctions around the globe.
  • Marine ecosystems and biodiversity: With very high confidence, Schneider et al. (2007:792) concluded that a warming of 2 °C above 1990 levels would result in mass mortality of coral reefs globally. In addition, several studies dealing with planktonic organisms and modelling have shown that temperature plays a transcendental role in marine microbial food webs, which may have a deep influence on the biological carbon pump of marine planktonic pelagic and mesopelagic ecosystems.
  • Freshwater ecosystems: Above about a 4 °C increase in global mean temperature by 2100 (relative to 1990-2000), Schneider et al. (2007:789) concluded, with high confidence, that many freshwater species would become extinct.

Impacts

Studying the association between Earth climate and extinctions over the past 520 million years, scientists from the University of York write, "The global temperatures predicted for the coming centuries may trigger a new ‘mass extinction event’, where over 50 per cent of animal and plant species would be wiped out."

Many of the species at risk are Arctic and Antarctic fauna such as polar bears and emperor penguins. In the Arctic, the waters of Hudson Bay are ice-free for three weeks longer than they were thirty years ago, affecting polar bears, which prefer to hunt on sea ice. Species that rely on cold weather conditions such as gyrfalcons, and snowy owls that prey on lemmings that use the cold winter to their advantage may be hit hard. Marine invertebrates enjoy peak growth at the temperatures they have adapted to, regardless of how cold these may be, and cold-blooded animals found at greater latitudes and altitudes generally grow faster to compensate for the short growing season. Warmer-than-ideal conditions result in higher metabolism and consequent reductions in body size despite increased foraging, which in turn elevates the risk of predation. Indeed, even a slight increase in temperature during development impairs growth efficiency and survival rate in rainbow trout.

Rising temperatures are beginning to have a noticeable impact on birds, and butterflies have shifted their ranges northward by 200 km in Europe and North America. Plants lag behind, and larger animals' migration is slowed down by cities and roads. In Britain, spring butterflies are appearing an average of 6 days earlier than two decades ago.

A 2002 article in Nature surveyed the scientific literature to find recent changes in range or seasonal behaviour by plant and animal species. Of species showing recent change, 4 out of 5 shifted their ranges towards the poles or higher altitudes, creating "refugee species". Frogs were breeding, flowers blossoming and birds migrating an average 2.3 days earlier each decade; butterflies, birds and plants moving towards the poles by 6.1 km per decade. A 2005 study concludes human activity is the cause of the temperature rise and resultant changing species behaviour, and links these effects with the predictions of climate models to provide validation for them. Scientists have observed that Antarctic hair grass is colonizing areas of Antarctica where previously their survival range was limited.

Mechanistic studies have documented extinctions due to recent climate change: McLaughlin et al. documented two populations of Bay checkerspot butterfly being threatened by precipitation change. Parmesan states, "Few studies have been conducted at a scale that encompasses an entire species" and McLaughlin et al. agreed "few mechanistic studies have linked extinctions to recent climate change." Daniel Botkin and other authors in one study believe that projected rates of extinction are overestimated. For "recent" extinctions, see Holocene extinction

Many species of freshwater and saltwater plants and animals are dependent on glacier-fed waters to ensure a cold water habitat that they have adapted to. Some species of freshwater fish need cold water to survive and to reproduce, and this is especially true with salmon and cutthroat trout. Reduced glacier runoff can lead to insufficient stream flow to allow these species to thrive. Ocean krill, a cornerstone species, prefer cold water and are the primary food source for aquatic mammals such as the blue whale. Alterations to the ocean currents, due to increased freshwater inputs from glacier melt, and the potential alterations to thermohaline circulation of the worlds oceans, may affect existing fisheries upon which humans depend as well. 

The white lemuroid possum, only found in the Daintree mountain forests of northern Queensland, may be the first mammal species to be driven extinct by global warming in Australia. In 2008, the white possum has not been seen in over three years. The possums cannot survive extended temperatures over 30 °C (86 °F), which occurred in 2005.

A 27-year study of the largest colony of Magellanic penguins in the world, published in 2014, found that extreme weather caused by climate change is responsible for killing 7% of penguin chicks per year on average, and in some years studied climate change accounted for up to 50% of all chick deaths. Since 1987, the number of breeding pairs in the colony has reduced by 24%.

Climate change is leading to a mismatch between the snow camouflage of arctic animals such as snowshoe hares with the increasingly snow-free landscape.

Forests

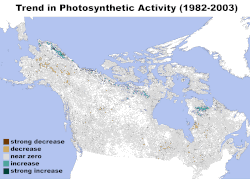
Change in Photosynthetic Activity in Northern Forests 1982-2003; NASA Earth Observatory
 
Pine forests in British Columbia have been devastated by a pine beetle infestation, which has expanded unhindered since 1998 at least in part due to the lack of severe winters since that time; a few days of extreme cold kill most mountain pine beetles and have kept outbreaks in the past naturally contained. The infestation, which (by November 2008) has killed about half of the province's lodgepole pines (33 million acres or 135,000 km²) is an order of magnitude larger than any previously recorded outbreak. One reason for unprecedented host tree mortality may be due to that the mountain pine beetles have higher reproductive success in lodgepole pine trees growing in areas where the trees have not experienced frequent beetle epidemics, which includes much of the current outbreak area. In 2007 the outbreak spread, via unusually strong winds, over the continental divide to Alberta. An epidemic also started, be it at a lower rate, in 1999 in Colorado, Wyoming, and Montana. The United States forest service predicts that between 2011 and 2013 virtually all 5 million acres (20,000 km2) of Colorado’s lodgepole pine trees over five inches (127 mm) in diameter will be lost.

As the northern forests are a carbon sink, while dead forests are a major carbon source, the loss of such large areas of forest has a positive feedback on global warming. In the worst years, the carbon emission due to beetle infestation of forests in British Columbia alone approaches that of an average year of forest fires in all of Canada or five years worth of emissions from that country's transportation sources.

Besides the immediate ecological and economic impact, the huge dead forests provide a fire risk. Even many healthy forests appear to face an increased risk of forest fires because of warming climates. The 10-year average of boreal forest burned in North America, after several decades of around 10,000 km² (2.5 million acres), has increased steadily since 1970 to more than 28,000 km² (7 million acres) annually. Though this change may be due in part to changes in forest management practices, in the western U.S., since 1986, longer, warmer summers have resulted in a fourfold increase of major wildfires and a sixfold increase in the area of forest burned, compared to the period from 1970 to 1986. A similar increase in wildfire activity has been reported in Canada from 1920 to 1999.

Forest fires in Indonesia have dramatically increased since 1997 as well. These fires are often actively started to clear forest for agriculture. They can set fire to the large peat bogs in the region and the CO₂released by these peat bog fires has been estimated, in an average year, to be 15% of the quantity of CO₂produced by fossil fuel combustion.

A 2018 study found that trees grow faster due to increased carbon dioxide levels, however, the trees are also eight to twelve percent lighter and denser since 1900. The authors note, "Even though a greater volume of wood is being produced today, it now contains less material than just a few decades ago."

Mountains

Mountains cover approximately 25 percent of earth's surface and provide a home to more than one-tenth of global human population. Changes in global climate pose a number of potential risks to mountain habitats. Researchers expect that over time, climate change will affect mountain and lowland ecosystems, the frequency and intensity of forest fires, the diversity of wildlife, and the distribution of fresh water. 

Studies suggest a warmer climate in the United States would cause lower-elevation habitats to expand into the higher alpine zone. Such a shift would encroach on the rare alpine meadows and other high-altitude habitats. High-elevation plants and animals have limited space available for new habitat as they move higher on the mountains in order to adapt to long-term changes in regional climate. 

Changes in climate will also affect the depth of the mountains snowpacks and glaciers. Any changes in their seasonal melting can have powerful impacts on areas that rely on freshwater runoff from mountains. Rising temperature may cause snow to melt earlier and faster in the spring and shift the timing and distribution of runoff. These changes could affect the availability of freshwater for natural systems and human uses.

Oceans

Ocean Acidification

Estimated annual mean sea surface anthropogenic dissolved inorganic carbon concentration for the present day (normalised to year 2002) from the Global Ocean Data Analysis Project v2 (GLODAPv2) climatology.
 
Annual mean sea surface dissolved oxygen from the World Ocean Atlas 2009. Dissolved oxygen here is in mol O2m-3.
 
Ocean acidification poses a severe threat to the earth's natural process of regulating atmospheric C02 levels, causing a decrease in water's ability to dissolve oxygen and created oxygen-vacant bodies of water called "dead zones." The ocean absorbs up to 55% of atmospheric carbon dioxide, lessoning the effects of climate change. This diffusion of carbon dioxide into seawater results in three acidic molecules: bicarbonate ion (HCO3-), aqueous carbon dioxide (CO2aq), and carbonic acid (H2CO3). These three compounds increase the ocean's acidity, decreasing its ph by up to 0.1 per 100ppm (part per million) of atmospheric CO2. The increase of ocean acidity also decelerates the rate of calcification in salt water, leading to slower growing reefs which support a whopping 25% of marine life. As seen with the great barrier reef, the increase in ocean acidity in not only killing the coral, but also the wildly diverse population of marine inhabitants which coral reefs support.

Dissolved Oxygen

Another issue faced by increasing global temperatures is the decrease of the ocean's ability to dissolve oxygen, one with potentially more severe consequences than other repercussions of global warming. Ocean depths between 100 meters and 1,000 meters are known as "oceanic mid zones" and host a plethora of biologically diverse species, one of which being zooplankton. Zooplankton feed on smaller organisms such as phytoplankton, which are an integral part of the marine food web. Phytoplankton perform photosynthesis, receiving energy from light, and provide sustenance and energy for the larger zooplankton, which provide sustenance and energy for the even larger fish, and so on up the food chain. The increase in oceanic temperatures lowers the ocean's ability to retain oxygen generated from phytoplankton, and therefore reduces the amount of bioavailable oxygen that fish and other various marine wildlife rely on for their survival. This creates marine dead zones, and the phenomenon has already generated multiple marine dead zones around the world, as marine currents effectively "trap" the deoxygenated water.

Combined Impact

Eventually the planet will warm to such a degree that the ocean's ability to dissolve water will no longer exist, resulting in a worldwide dead zone. Dead zones, in combination with ocean acidification, will usher in an era where marine life in most forms will cease to exist, causing a sharp decline in the amount of oxygen generated through bio carbon sequestration, perpetuating the cycle. This disruption to the food chain will cascade upward, thinning out populations of primary consumers, secondary consumers, tertiary consumers, etc., as primary consumers being the initial victims of these phenomenon.

Fresh Water

Disruption to Water-Cycle

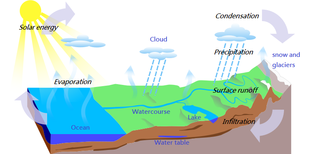
The Water Cycle
 
Fresh water covers only 0.8% of the Earth's surface, but contains up to 6% of all life on the planet. However, the impacts climate change deal to its ecosystems are often overlooked. Very few studies showcase the potential results of climate change on large-scale ecosystems which are reliant on freshwater, such as river ecosystems, lake ecosystems, desert ecosystems, etc. However, a comprehensive study published in 2009 delves into the effects to be felt by lotic (flowing) and lentic (still) freshwater ecosystems in the American Northeast. According to the study, persistent rainfall, typically felt year round, will begin to diminish and rates of evaporation will increase, resulting in drier summers and more sporadic periods of precipitation throughout the year. Additionally, a decrease in snowfall is expected, which leads to less runoff in the spring when snow thaws and enters the watershed, resulting in lower-flowing fresh water rivers. This decrease in snowfall also leads to increased runoff during winter months, as rainfall cannot permeate the frozen ground usually covered by water-absorbing snow.  These effects on the water cycle will wreak havoc for indigenous species residing in fresh water lakes and streams.

Salt Water Contamination and Cool Water Species

Eagle River in central Alaska, home to various indigenous freshwater species.
 
Species of fish living in cold or cool water can see a reduction in population of up to 50% in the majority of U.S. fresh water streams, according to most climate change models. The increase in metabolic demands due to higher water temperatures, in combination with decreasing amounts of food will be the main contributors to their decline. Additionally, many fish species (such as salmon) utilize seasonal water levels of streams as a means of reproducing, typically breeding when water flow is high and migrating to the ocean after spawning. Because snowfall is expected to be reduced due to climate change, water runoff is expected to decrease which leads to lower flowing streams, effecting the spawning of millions of salmon. To add to this, rising seas will begin to flood coastal river systems, converting them from fresh water habitats to saline environments where indigenous species will likely perish. In southeast Alaska, the sea rises by 3.96cm/year, redepositing sediment in various river channels and bringing salt water inland. This rise in sea level not only contaminates streams and rivers with saline water, but also the reservoirs they are connected to, where species such as Sockeye Salmon live. Although this species of Salmon can survive in both salt and fresh water, the loss of a body of fresh water stops them from reproducing in the spring, as the spawning process requires fresh water. Undoubtedly, the loss of fresh water systems of lakes and rivers in Alaska will result in the imminent demise of the state's once-abundant population of salmon.

Combined Impact

In general, as the planet warms, the amount of fresh water bodies across the planet decreases, as evaporation rates increase, rain patterns become more sporadic , and watershed patterns become fragmented, resulting in less cyclical water flow in river and stream systems. This disruption to fresh water cycles disrupts the feeding, mating, and migration patterns of organisms reliant on fresh water ecosystems. Additionally, the encroachment of saline water into fresh water river systems endangers indigenous species which can only survive in fresh water.

Ecological productivity

  • According to a paper by Smith and Hitz (2003:66), it is reasonable to assume that the relationship between increased global mean temperature and ecosystem productivity is parabolic. Higher carbon dioxide concentrations will favourably affect plant growth and demand for water. Higher temperatures could initially be favourable for plant growth. Eventually, increased growth would peak then decline.
  • According to IPCC (2007:11), a global average temperature increase exceeding 1.5–2.5 °C (relative to the period 1980–99), would likely have a predominantly negative impact on ecosystem goods and services, e.g., water and food supply.
  • Research done by the Swiss Canopy Crane Project suggests that slow-growing trees only are stimulated in growth for a short period under higher CO2 levels, while faster growing plants like liana benefit in the long term. In general, but especially in rainforests, this means that liana become the prevalent species; and because they decompose much faster than trees their carbon content is more quickly returned to the atmosphere. Slow growing trees incorporate atmospheric carbon for decades.

Species migration

In 2010, a gray whale was found in the Mediterranean Sea, even though the species had not been seen in the North Atlantic Ocean since the 18th century. The whale is thought to have migrated from the Pacific Ocean via the Arctic. Climate Change & European Marine Ecosystem Research (CLAMER) has also reported that the Neodenticula seminae alga has been found in the North Atlantic, where it had gone extinct nearly 800,000 years ago. The alga has drifted from the Pacific Ocean through the Arctic, following the reduction in polar ice.

In the Siberian subarctic, species migration is contributing to another warming albedo-feedback, as needle-shedding larch trees are being replaced with dark-foliage evergreen conifers which can absorb some of the solar radiation that previously reflected off the snowpack beneath the forest canopy. It has been projected many fish species will migrate towards the North and South poles as a result of climate change, and that many species of fish near the Equator will go extinct as a result of global warming.

Migratory birds are especially at risk for endangerment due to the extreme dependability on temperature and air pressure for migration, foraging, growth, and reproduction. Much research has been done on the effects of climate change on birds, both for future predictions and for conservation. The species said to be most at risk for endangerment or extinction are populations that are not of conservation concern. It is predicted that a 3.5 degree increase in surface temperature will occur by year 2100, which could result in between 600 and 900 extinctions, which mainly will occur in the tropical environments.

Agriculture

Droughts have been occurring more frequently because of global warming and they are expected to become more frequent and intense in Africa, southern Europe, the Middle East, most of the Americas, Australia, and Southeast Asia. Their impacts are aggravated because of increased water demand, population growth, urban expansion, and environmental protection efforts in many areas. Droughts result in crop failures and the loss of pasture grazing land for livestock.
 
Droughts are becoming more frequent and intense in arid and semiarid western North America as temperatures have been rising, advancing the timing and magnitude of spring snow melt floods and reducing river flow volume in summer. Direct effects of climate change include increased heat and water stress, altered crop phenology, and disrupted symbiotic interactions. These effects may be exacerbated by climate changes in river flow, and the combined effects are likely to reduce the abundance of native trees in favor of non-native herbaceous and drought-tolerant competitors, reduce the habitat quality for many native animals, and slow litter decomposition and nutrient cycling. Climate change effects on human water demand and irrigation may intensify these effects. By 2012, North American corn prices had risen to a record $8.34 per bushel in August, leaving 20 of the 211 U.S. ethanol fuel plants idle.

Tipping points in the climate system

From Wikipedia, the free encyclopedia

Possible tipping elements in the climate system.

A tipping point in the climate system is a threshold that, when exceeded, can lead to large changes in the state of the system. Potential tipping points have been identified in the physical climate system, in impacted ecosystems, and sometimes in both. For instance, feedback from the global carbon cycle is a driver for the transition between glacial and interglacial periods, with orbital forcing providing the initial trigger. Earth's geologic temperature record includes many more examples of geologically rapid transitions between different climate states.

Climate tipping points are of particular interest in reference to concerns about climate change in the modern era. Possible tipping point behaviour has been identified for the global mean surface temperature by studying self-reinforcing feedbacks and the past behavior of Earth's climate system. Self-reinforcing feedbacks in the carbon cycle and planetary reflectivity could trigger a cascading set of tipping points that lead the world into a hothouse climate state.

Large-scale components of the Earth system that may pass a tipping point have been referred to as tipping elements. Tipping elements are found in the Greenland and Antarctic ice sheets, possibly causing tens of meters of sea level rise. These tipping points are not always abrupt. For example, at some level of temperature rise the melt of a large part of the Greenland ice sheet and/or West Antarctic Ice Sheet will become inevitable; but the ice sheet itself may persist for many centuries. Some tipping elements, like the collapse of ecosystems, are irreversible.

Definition

The IPCC AR5 defines a tipping point as an irreversible change in the climate system. It states that the precise levels of climate change sufficient to trigger a tipping point remain uncertain, but that the risk associated with crossing multiple tipping points increases with rising temperature. A more broad definition of tipping points is sometimes used as well, which includes abrupt but reversible tipping points.

Tipping point behaviour in the climate can also be described in mathematical terms. Tipping points are then seen as any type of bifurcation with hysteresis. Hysteresis is the dependence of the state of a system on its history. For instance, depending on how warm and cold it was in the past, there can be differing amounts of ice present on the poles at the same concentration of greenhouse gases or temperature.

In the context of climate change, an "adaptation tipping point" has been defined as "the threshold value or specific boundary condition where ecological, technical, economic, spatial or socially acceptable limits are exceeded."

Tipping points for global temperature

There are many positive and negative feedbacks to global temperatures and the carbon cycle that have been identified. The IPCC reports that feedbacks to increased temperatures are net positive for the remainder of this century, with the impact of cloud cover the largest uncertainty. IPCC carbon cycle models show higher ocean uptake of carbon corresponding to higher concentration pathways, but land carbon uptake is uncertain due to the combined effect of climate change and land use changes.

The geologic record of temperature and greenhouse gas concentration allows climate scientists to gather information on climate feedbacks that lead to different climate states, such as the Late Quaternary (past 1.2 million years), the Pliocene period five million years ago and the Cretaceous period, 100 million years ago. Combining this information with the understanding of current climate change resulted in the finding that "A 2 °C warming could activate important tipping elements, raising the temperature further to activate other tipping elements in a domino-like cascade that could take the Earth System to even higher temperatures".

The speed of tipping point feedbacks is a critical concern and the geologic record often fails to provide clarity as to whether past temperature changes have taken only a few decades or many millennia of time. For instance, a tipping point that was once feared to be abrupt and overwhelming is the release of clathrate compounds buried in seabeds and seabed permafrost, but that feedback is now thought to be chronic and long term.

Some individual feedbacks may be strong enough to trigger tipping points on their own. A 2019 study predicts that if greenhouse gases reach three times the current level of atmospheric carbon dioxide that stratocumulus clouds could abruptly disperse, contributing an additional 8 degrees Celsius of warming.

Runaway greenhouse effect

The runaway greenhouse effect is used in astronomical circles to refer to a greenhouse effect that is so extreme that oceans boil away and render a planet uninhabitable, an irreversible climate state that happened on Venus. The IPCC Fifth Assessment Report states that "a 'runaway greenhouse effect'—analogous to Venus—appears to have virtually no chance of being induced by anthropogenic activities." Venus-like conditions on the Earth require a large long-term forcing that is unlikely to occur until the sun brightens by a few tens of percents, which will take a few billion years.

While a runaway greenhouse effect on Earth is virtually impossible, there are indications that Earth could enter a moist greenhouse state that renders large parts of Earth uninhabitable if the climate forcing is large enough to make water vapour (H2O) a major atmospheric constituent. Conceivable levels of human-made climate forcing would increase water vapour to about 1% of the atmosphere's mass, thus increasing the rate of hydrogen escape to space. If such a forcing were entirely due to CO2, the weathering process would remove the excess atmospheric CO2 well before the ocean was significantly depleted.

Tipping elements

Large scale tipping elements

A smooth or abrupt change in temperature can trigger global-scale tipping points. In the cryosphere these include the irreversible melting of Greenland and Antarctic ice sheets. In Greenland, a positive feedback cycle exists between melting and surface elevation. At lower elevations, temperatures are higher, leading to additional melting. This feedback loop can become so strong that irreversible melting occurs. Marine ice sheet instability could trigger a tipping point in West Antarctica. Crossing either of these tipping points leads to accelerated global sea level rise.

When fresh water gets released as a consequence of Greenland melting, a threshold may be crossed which leads to disruption of the thermohaline circulation. The thermohaline circulation transports heat northward which is important for temperature regulation in the Atlantic region. Risks for a complete shutdown are low to moderate under the Paris agreement levels of warming.

Other examples of possible large scale tipping elements are a shift in El Niño–Southern Oscillation. After crossing a tipping point, the warm phase (El Niño) would start to occur more often. Lastly, the southern ocean, which now absorbs a lot of carbon, might switch to a state where it does not do this anymore.

Regional tipping elements

Climate change can trigger regional tipping points as well. Examples are the disappearance of Arctic sea ice, the establishment of woody species in tundra, permafrost loss, the collapse of the monsoon of South Asia and a strengthening of the West African monsoon which would lead to greening of the Sahara and Sahel. Deforestation may trigger a tipping point in rainforests. As rain forests recycle a large part of their rainfall, when a portion of the forest is destroyed local droughts may threaten the remainder. Finally, boreal forests are considered a tipping element as well. Local warming causes trees to die at a higher rate than before, in proportion to the rise in temperature. As more trees die, the woodland becomes more open, leading to further warming and making forests more susceptible to fire. The tipping point is difficult to predict, but is estimated to be between 3–4 °C of global temperature rise.

Cascading tipping points

Crossing a threshold in one part of the climate system may trigger another tipping element to tip into a new state. These are so-called cascading tipping points. Ice loss in West Antarctica and Greenland will significantly alter ocean circulation. Sustained warming of the northern high latitudes as a result of this process could activate tipping elements in that region, such as permafrost degradation, loss of Arctic sea ice, and Boreal forest dieback. This illustrates that even at relatively low levels of global warming, relatively stable tipping elements may be activated.

Early warning signals

For some of the tipping points described above, it may be possible to detect whether that part of the climate system is getting closer to a tipping point. All parts of the climate system are sometimes disturbed by weather events. After the disruption, the system moves back to its equilibrium. A storm may damage sea ice, which grows back after the storm has passed. If a system is getting closer to tipping, this restoration to its normal state might take increasingly longer, which can be used as a warning sign of tipping.

Tipping point effects

If the climate tips into a hothouse Earth scenario, some scientists warn of food and water shortages, hundreds of millions of people being displaced by rising sea levels, unhealthy and unlivable conditions, and coastal storms having larger impacts. Runaway climate change of 4–5 °C can make swathes of the planet around the equator uninhabitable, with sea levels up to 60 metres (197 ft) higher than they are today threatening coastal cities. Humans cannot survive if the air is too moist and hot, which would happen for the majority of human populations if global temperatures rise by 11–12 °C, as land masses warm faster than the global average. Effects like these have been popularized in books like The Uninhabitable Earth, which climate change deniers refer to as sensationalized "climate disaster porn".

Climate change feedback

From Wikipedia, the free encyclopedia

Photo shows what appears to be permafrost thaw ponds in Hudson Bay, Canada, near Greenland. (2008) Global warming will increase permafrost and peatland thaw, which can result in collapse of plateau surfaces.
 
Climate change feedback is important in the understanding of global warming because feedback processes may amplify or diminish the effect of each climate forcing, and so play an important part in determining the climate sensitivity and future climate state. Feedback in general is the process in which changing one quantity changes a second quantity, and the change in the second quantity in turn changes the first. Positive feedback amplifies the change in the first quantity while negative feedback reduces it.

The term "forcing" means a change which may "push" the climate system in the direction of warming or cooling. An example of a climate forcing is increased atmospheric concentrations of greenhouse gases. By definition, forcings are external to the climate system while feedbacks are internal; in essence, feedbacks represent the internal processes of the system. Some feedbacks may act in relative isolation to the rest of the climate system; others may be tightly coupled; hence it may be difficult to tell just how much a particular process contributes.

Forcings and feedbacks together determine how much and how fast the climate changes. The main positive feedback in global warming is the tendency of warming to increase the amount of water vapor in the atmosphere, which in turn leads to further warming. The main negative feedback comes from the Stefan–Boltzmann law, the amount of heat radiated from the Earth into space changes with the fourth power of the temperature of Earth's surface and atmosphere. Observations and modelling studies indicate that there is a net positive feedback to warming. Large positive feedbacks can lead to effects that are abrupt or irreversible, depending upon the rate and magnitude of the climate change."

Positive

Carbon cycle feedbacks

There have been predictions, and some evidence, that global warming might cause loss of carbon from terrestrial ecosystems, leading to an increase of atmospheric CO
2
levels. Several climate models indicate that global warming through the 21st century could be accelerated by the response of the terrestrial carbon cycle to such warming. All 11 models in the C4MIP study found that a larger fraction of anthropogenic CO2 will stay airborne if climate change is accounted for. By the end of the twenty-first century, this additional CO2 varied between 20 and 200 ppm for the two extreme models, the majority of the models lying between 50 and 100 ppm. The higher CO2 levels led to an additional climate warming ranging between 0.1° and 1.5 °C. However, there was still a large uncertainty on the magnitude of these sensitivities. Eight models attributed most of the changes to the land, while three attributed it to the ocean. The strongest feedbacks in these cases are due to increased respiration of carbon from soils throughout the high latitude boreal forests of the Northern Hemisphere. One model in particular (HadCM3) indicates a secondary carbon cycle feedback due to the loss of much of the Amazon Rainforest in response to significantly reduced precipitation over tropical South America. While models disagree on the strength of any terrestrial carbon cycle feedback, they each suggest any such feedback would accelerate global warming. 

Observations show that soils in the U.K have been losing carbon at the rate of four million tonnes a year for the past 25 years according to a paper in Nature by Bellamy et al. in September 2005, who note that these results are unlikely to be explained by land use changes. Results such as this rely on a dense sampling network and thus are not available on a global scale. Extrapolating to all of the United Kingdom, they estimate annual losses of 13 million tons per year. This is as much as the annual reductions in carbon dioxide emissions achieved by the UK under the Kyoto Treaty (12.7 million tons of carbon per year).

It has also been suggested (by Chris Freeman) that the release of dissolved organic carbon (DOC) from peat bogs into water courses (from which it would in turn enter the atmosphere) constitutes a positive feedback for global warming. The carbon currently stored in peatlands (390–455 gigatonnes, one-third of the total land-based carbon store) is over half the amount of carbon already in the atmosphere. DOC levels in water courses are observably rising; Freeman's hypothesis is that, not elevated temperatures, but elevated levels of atmospheric CO2 are responsible, through stimulation of primary productivity.

Tree deaths are believed to be increasing as a result of climate change, which is a positive feedback effect.

Arctic methane release

Warming is also the triggering variable for the release of carbon (potentially as methane) in the arctic. Methane released from thawing permafrost such as the frozen peat bogs in Siberia, and from methane clathrate on the sea floor, creates a positive feedback.
Methane release from melting permafrost peat bogs
Western Siberia is the world's largest peat bog, a one million square kilometer region of permafrost peat bog that was formed 11,000 years ago at the end of the last ice age. The melting of its permafrost is likely to lead to the release, over decades, of large quantities of methane. As much as 70,000 million tonnes of methane, an extremely effective greenhouse gas, might be released over the next few decades, creating an additional source of greenhouse gas emissions. Similar melting has been observed in eastern Siberia. Lawrence et al. (2008) suggest that a rapid melting of Arctic sea ice may start a feedback loop that rapidly melts Arctic permafrost, triggering further warming.
Methane release from hydrates
Methane clathrate, also called methane hydrate, is a form of water ice that contains a large amount of methane within its crystal structure. Extremely large deposits of methane clathrate have been found under sediments on the sea and ocean floors of Earth. The sudden release of large amounts of natural gas from methane clathrate deposits, in a runaway global warming event, has been hypothesized as a cause of past and possibly future climate changes. The release of this trapped methane is a potential major outcome of a rise in temperature; it is thought that this might increase the global temperature by an additional 5° in itself, as methane is much more powerful as a greenhouse gas than carbon dioxide. The theory also predicts this will greatly affect available oxygen content of the atmosphere. This theory has been proposed to explain the most severe mass extinction event on earth known as the Permian–Triassic extinction event, and also the Paleocene-Eocene Thermal Maximum climate change event. In 2008, a research expedition for the American Geophysical Union detected levels of methane up to 100 times above normal in the Siberian Arctic, likely being released by methane clathrates being released by holes in a frozen 'lid' of seabed permafrost, around the outfall of the Lena River and the area between the Laptev Sea and East Siberian Sea.

Abrupt increases in atmospheric methane

Literature assessments by the Intergovernmental Panel on Climate Change (IPCC) and the US Climate Change Science Program (CCSP) have considered the possibility of future projected climate change leading to a rapid increase in atmospheric methane. The IPCC Third Assessment Report, published in 2001, looked at possible rapid increases in methane due either to reductions in the atmospheric chemical sink or from the release of buried methane reservoirs. In both cases, it was judged that such a release would be "exceptionally unlikely" (less than a 1% chance, based on expert judgement). The CCSP assessment, published in 2008, concluded that an abrupt release of methane into the atmosphere appeared "very unlikely" (less than 10% probability, based on expert judgement). The CCSP assessment, however, noted that climate change would "very likely" (greater than 90% probability, based on expert judgement) accelerate the pace of persistent emissions from both hydrate sources and wetlands.

Decomposition

Organic matter stored in permafrost generates heat as it decomposes in response to the permafrost melting.

Peat decomposition

Peat, occurring naturally in peat bogs, is a store of carbon significant on a global scale. When peat dries it decomposes, and may additionally burn. Water table adjustment due to global warming may cause significant excursions of carbon from peat bogs. This may be released as methane, which can exacerbate the feedback effect, due to its high global warming potential.

Rainforest drying

Rainforests, most notably tropical rainforests, are particularly vulnerable to global warming. There are a number of effects which may occur, but two are particularly concerning. Firstly, the drier vegetation may cause total collapse of the rainforest ecosystem. For example, the Amazon rainforest would tend to be replaced by caatinga ecosystems. Further, even tropical rainforests ecosystems which do not collapse entirely may lose significant proportions of their stored carbon as a result of drying, due to changes in vegetation.

Forest fires

The IPCC Fourth Assessment Report predicts that many mid-latitude regions, such as Mediterranean Europe, will experience decreased rainfall and an increased risk of drought, which in turn would allow forest fires to occur on larger scale, and more regularly. This releases more stored carbon into the atmosphere than the carbon cycle can naturally re-absorb, as well as reducing the overall forest area on the planet, creating a positive feedback loop. Part of that feedback loop is more rapid growth of replacement forests and a northward migration of forests as northern latitudes become more suitable climates for sustaining forests. There is a question of whether the burning of renewable fuels such as forests should be counted as contributing to global warming. Cook & Vizy also found that forest fires were likely in the Amazon Rainforest, eventually resulting in a transition to Caatinga vegetation in the Eastern Amazon region.

Desertification

Desertification is a consequence of global warming in some environments. Desert soils contain little humus, and support little vegetation. As a result, transition to desert ecosystems is typically associated with excursions of carbon.

Modelling results

The global warming projections contained in the IPCC's Fourth Assessment Report (AR4) include carbon cycle feedbacks. Authors of AR4, however, noted that scientific understanding of carbon cycle feedbacks was poor. Projections in AR4 were based on a range of greenhouse gas emissions scenarios, and suggested warming between the late 20th and late 21st century of 1.1 to 6.4 °C. This is the "likely" range (greater than 66% probability), based on the expert judgement of the IPCC's authors. Authors noted that the lower end of the "likely" range appeared to be better constrained than the upper end of the "likely" range, in part due to carbon cycle feedbacks. The American Meteorological Society has commented that more research is needed to model the effects of carbon cycle feedbacks in climate change projections.

Isaken et al. (2010) considered how future methane release from the Arctic might contribute to global warming. Their study suggested that if global methane emissions were to increase by a factor of 2.5 to 5.2 above (then) current emissions, the indirect contribution to radiative forcing would be about 250% and 400% respectively, of the forcing that can be directly attributed to methane. This amplification of methane warming is due to projected changes in atmospheric chemistry.

Schaefer et al. (2011) considered how carbon released from permafrost might contribute to global warming. Their study projected changes in permafrost based on a medium greenhouse gas emissions scenario (SRES A1B). According to the study, by 2200, the permafrost feedback might contribute 190 (+/- 64) gigatons of carbon cumulatively to the atmosphere. Schaefer et al. (2011) commented that this estimate may be low.
Implications for climate policy
Uncertainty over climate change feedbacks has implications for climate policy. For instance, uncertainty over carbon cycle feedbacks may affect targets for reducing greenhouse gas emissions. Emissions targets are often based on a target stabilization level of atmospheric greenhouse gas concentrations, or on a target for limiting global warming to a particular magnitude. Both of these targets (concentrations or temperatures) require an understanding of future changes in the carbon cycle. If models incorrectly project future changes in the carbon cycle, then concentration or temperature targets could be missed. For example, if models underestimate the amount of carbon released into the atmosphere due to positive feedbacks (e.g., due to melting permafrost), then they may also underestimate the extent of emissions reductions necessary to meet a concentration or temperature target.

Cloud feedback

Warming is expected to change the distribution and type of clouds. Seen from below, clouds emit infrared radiation back to the surface, and so exert a warming effect; seen from above, clouds reflect sunlight and emit infrared radiation to space, and so exert a cooling effect. Whether the net effect is warming or cooling depends on details such as the type and altitude of the cloud. High clouds tend to trap more heat and therefore have a positive feedback, low clouds normally reflect more sunlight so they have a negative feedback. These details were poorly observed before the advent of satellite data and are difficult to represent in climate models.

A 2019 simulation predicts that if greenhouse gases reach three times the current level of atmospheric carbon dioxide that stratocumulus clouds could abruptly disperse, contributing to additional global warming.

Gas release

Release of gases of biological origin may be affected by global warming, but research into such effects is at an early stage. Some of these gases, such as nitrous oxide released from peat, directly affect climate. Others, such as dimethyl sulfide released from oceans, have indirect effects.

Ice-albedo feedback

Aerial photograph showing a section of sea ice. The lighter blue areas are melt ponds and the darkest areas are open water, both have a lower albedo than the white sea ice. The melting ice contributes to ice-albedo feedback.
 
When ice melts, land or open water takes its place. Both land and open water are on average less reflective than ice and thus absorb more solar radiation. This causes more warming, which in turn causes more melting, and this cycle continues. During times of global cooling, additional ice increases the reflectivity which reduces the absorption of solar radiation which results in more cooling in a continuing cycle. Considered a faster feedback mechanism.

1870–2009 Northern hemisphere sea ice extent in million square kilometers. Blue shading indicates the pre-satellite era; data then is less reliable. In particular, the near-constant level extent in Autumn up to 1940 reflects lack of data rather than a real lack of variation.
 
Albedo change is also the main reason why IPCC predict polar temperatures in the northern hemisphere to rise up to twice as much as those of the rest of the world, in a process known as polar amplification. In September 2007, the Arctic sea ice area reached about half the size of the average summer minimum area between 1979 and 2000. Also in September 2007, Arctic sea ice retreated far enough for the Northwest Passage to become navigable to shipping for the first time in recorded history. The record losses of 2007 and 2008 may, however, be temporary. Mark Serreze of the US National Snow and Ice Data Center views 2030 as a "reasonable estimate" for when the summertime Arctic ice cap might be ice-free. The polar amplification of global warming is not predicted to occur in the southern hemisphere. The Antarctic sea ice reached its greatest extent on record since the beginning of observation in 1979, but the gain in ice in the south is exceeded by the loss in the north. The trend for global sea ice, northern hemisphere and southern hemisphere combined is clearly a decline.

Ice loss may have internal feedback processes, as melting of ice over land can cause eustatic sea level rise, potentially causing instability of ice shelves and inundating coastal ice masses, such as glacier tongues. Further, a potential feedback cycle exists due to earthquakes caused by isostatic rebound further destabilising ice shelves, glaciers and ice caps.

The ice-albedo in some sub-arctic forests is also changing, as stands of larch (which shed their needles in winter, allowing sunlight to reflect off the snow in spring and fall) are being replaced by spruce trees (which retain their dark needles all year).

Water vapor feedback

If the atmospheres are warmed, the saturation vapor pressure increases, and the amount of water vapor in the atmosphere will tend to increase. Since water vapor is a greenhouse gas, the increase in water vapor content makes the atmosphere warm further; this warming causes the atmosphere to hold still more water vapor (a positive feedback), and so on until other processes stop the feedback loop. The result is a much larger greenhouse effect than that due to CO2 alone. Although this feedback process causes an increase in the absolute moisture content of the air, the relative humidity stays nearly constant or even decreases slightly because the air is warmer. Climate models incorporate this feedback. Water vapor feedback is strongly positive, with most evidence supporting a magnitude of 1.5 to 2.0 W/m2/K, sufficient to roughly double the warming that would otherwise occur. Water vapor feedback is considered a faster feedback mechanism.

Negative

Blackbody radiation

As the temperature of a black body increases, the emission of infrared radiation back into space increases with the fourth power of its absolute temperature according to Stefan–Boltzmann law. This increases the amount of outgoing radiation as the Earth warms. The impact of this negative feedback effect is included in global climate models summarized by the IPCC. This is also called the Planck feedback.

Carbon cycle

Le Chatelier's principle

Following Le Chatelier's principle, the chemical equilibrium of the Earth's carbon cycle will shift in response to anthropogenic CO2 emissions. The primary driver of this is the ocean, which absorbs anthropogenic CO2 via the so-called solubility pump. At present this accounts for only about one third of the current emissions, but ultimately most (~75%) of the CO2 emitted by human activities will dissolve in the ocean over a period of centuries: "A better approximation of the lifetime of fossil fuel CO2 for public discussion might be 300 years, plus 25% that lasts forever". However, the rate at which the ocean will take it up in the future is less certain, and will be affected by stratification induced by warming and, potentially, changes in the ocean's thermohaline circulation.

Chemical weathering

Chemical weathering over the geological long term acts to remove CO2 from the atmosphere. With current global warming, weathering is increasing, demonstrating significant feedbacks between climate and Earth surface. Biosequestration also captures and stores CO2 by biological processes. The formation of shells by organisms in the ocean, over a very long time, removes CO2 from the oceans. The complete conversion of CO2 to limestone takes thousands to hundreds of thousands of years.

Net Primary Productivity

Net primary productivity changes in response to increased CO2, as plants photosynthesis increased in response to increasing concentrations. However, this effect is swamped by other changes in the biosphere due to global warming.

Lapse rate

The atmosphere's temperature decreases with height in the troposphere. Since emission of infrared radiation varies with temperature, longwave radiation escaping to space from the relatively cold upper atmosphere is less than that emitted toward the ground from the lower atmosphere. Thus, the strength of the greenhouse effect depends on the atmosphere's rate of temperature decrease with height. Both theory and climate models indicate that global warming will reduce the rate of temperature decrease with height, producing a negative lapse rate feedback that weakens the greenhouse effect. Measurements of the rate of temperature change with height are very sensitive to small errors in observations, making it difficult to establish whether the models agree with observations.

Ice age

From Wikipedia, the free encyclopedia

An artist's impression of ice age Earth at glacial maximum.
 
An ice age is a long period of reduction in the temperature of the Earth's surface and atmosphere, resulting in the presence or expansion of continental and polar ice sheets and alpine glaciers. Earth is currently in the Quaternary glaciation, known in popular terminology as the Ice Age. Individual pulses of cold climate are termed "glacial periods" (or, alternatively, "glacials", "glaciations", "glacial stages", "stadials", "stades", or colloquially, "ice ages"), and intermittent warm periods are called "interglacials" or "interstadials" with both climatic pulses part of the Quaternary or other periods in Earth's history.

In the terminology of glaciology, ice age implies the presence of extensive ice sheets in both northern and southern hemispheres. By this definition, we are in an interglacial period—the Holocene. The amount of heat trapping gases emitted into Earth's Oceans and atmosphere will prevent the next ice age, which otherwise would begin in around 50,000 years, and likely more glacial cycles.

Origin of ice age theory

In 1742, Pierre Martel (1706–1767), an engineer and geographer living in Geneva, visited the valley of Chamonix in the Alps of Savoy. Two years later he published an account of his journey. He reported that the inhabitants of that valley attributed the dispersal of erratic boulders to the glaciers, saying that they had once extended much farther. Later similar explanations were reported from other regions of the Alps. In 1815 the carpenter and chamois hunter Jean-Pierre Perraudin (1767–1858) explained erratic boulders in the Val de Bagnes in the Swiss canton of Valais as being due to glaciers previously extending further. An unknown woodcutter from Meiringen in the Bernese Oberland advocated a similar idea in a discussion with the Swiss-German geologist Jean de Charpentier (1786–1855) in 1834. Comparable explanations are also known from the Val de Ferret in the Valais and the Seeland in western Switzerland and in Goethe's scientific work. Such explanations could also be found in other parts of the world. When the Bavarian naturalist Ernst von Bibra (1806–1878) visited the Chilean Andes in 1849–1850, the natives attributed fossil moraines to the former action of glaciers.

Meanwhile, European scholars had begun to wonder what had caused the dispersal of erratic material. From the middle of the 18th century, some discussed ice as a means of transport. The Swedish mining expert Daniel Tilas (1712–1772) was, in 1742, the first person to suggest drifting sea ice in order to explain the presence of erratic boulders in the Scandinavian and Baltic regions. In 1795, the Scottish philosopher and gentleman naturalist, James Hutton (1726–1797), explained erratic boulders in the Alps by the action of glaciers. Two decades later, in 1818, the Swedish botanist Göran Wahlenberg (1780–1851) published his theory of a glaciation of the Scandinavian peninsula. He regarded glaciation as a regional phenomenon.

Only a few years later, the Danish-Norwegian geologist Jens Esmark (1762–1839) argued a sequence of worldwide ice ages. In a paper published in 1824, Esmark proposed changes in climate as the cause of those glaciations. He attempted to show that they originated from changes in Earth's orbit. During the following years, Esmark's ideas were discussed and taken over in parts by Swedish, Scottish and German scientists. At the University of Edinburgh Robert Jameson (1774–1854) seemed to be relatively open to Esmark's ideas, as reviewed by Norwegian professor of glaciology Bjørn G. Andersen (1992). Jameson's remarks about ancient glaciers in Scotland were most probably prompted by Esmark. In Germany, Albrecht Reinhard Bernhardi (1797–1849), a geologist and professor of forestry at an academy in Dreissigacker, since incorporated in the southern Thuringian city of Meiningen, adopted Esmark's theory. In a paper published in 1832, Bernhardi speculated about former polar ice caps reaching as far as the temperate zones of the globe.

In 1829, independently of these debates, the Swiss civil engineer Ignaz Venetz (1788–1859) explained the dispersal of erratic boulders in the Alps, the nearby Jura Mountains, and the North German Plain as being due to huge glaciers. When he read his paper before the Schweizerische Naturforschende Gesellschaft, most scientists remained sceptical. Finally, Venetz convinced his friend Jean de Charpentier. De Charpentier transformed Venetz's idea into a theory with a glaciation limited to the Alps. His thoughts resembled Wahlenberg's theory. In fact, both men shared the same volcanistic, or in de Charpentier's case rather plutonistic assumptions, about the Earth's history. In 1834, de Charpentier presented his paper before the Schweizerische Naturforschende Gesellschaft. In the meantime, the German botanist Karl Friedrich Schimper (1803–1867) was studying mosses which were growing on erratic boulders in the alpine upland of Bavaria. He began to wonder where such masses of stone had come from. During the summer of 1835 he made some excursions to the Bavarian Alps. Schimper came to the conclusion that ice must have been the means of transport for the boulders in the alpine upland. In the winter of 1835 to 1836 he held some lectures in Munich. Schimper then assumed that there must have been global times of obliteration ("Verödungszeiten") with a cold climate and frozen water. Schimper spent the summer months of 1836 at Devens, near Bex, in the Swiss Alps with his former university friend Louis Agassiz (1801–1873) and Jean de Charpentier. Schimper, de Charpentier and possibly Venetz convinced Agassiz that there had been a time of glaciation. During the winter of 1836/37, Agassiz and Schimper developed the theory of a sequence of glaciations. They mainly drew upon the preceding works of Venetz, de Charpentier and on their own fieldwork. Agassiz appears to have been already familiar with Bernhardi's paper at that time. At the beginning of 1837, Schimper coined the term "ice age" ("Eiszeit") for the period of the glaciers. In July 1837 Agassiz presented their synthesis before the annual meeting of the Schweizerische Naturforschende Gesellschaft at Neuchâtel. The audience was very critical and some opposed to the new theory because it contradicted the established opinions on climatic history. Most contemporary scientists thought that the Earth had been gradually cooling down since its birth as a molten globe.

In order to overcome this rejection, Agassiz embarked on geological fieldwork. He published his book Study on Glaciers ("Études sur les glaciers") in 1840. De Charpentier was put out by this, as he had also been preparing a book about the glaciation of the Alps. De Charpentier felt that Agassiz should have given him precedence as it was he who had introduced Agassiz to in-depth glacial research. Besides that, Agassiz had, as a result of personal quarrels, omitted any mention of Schimper in his book.

All together, it took several decades until the ice age theory was fully accepted by scientists. This happened on an international scale in the second half of the 1870s following the work of James Croll, including the publication of Climate and Time, in Their Geological Relations in 1875, which provided a credible explanation for the causes of ice ages.

Evidence for ice ages

There are three main types of evidence for ice ages: geological, chemical, and paleontological. 

Geological evidence for ice ages comes in various forms, including rock scouring and scratching, glacial moraines, drumlins, valley cutting, and the deposition of till or tillites and glacial erratics. Successive glaciations tend to distort and erase the geological evidence, making it difficult to interpret. Furthermore, this evidence was difficult to date exactly; early theories assumed that the glacials were short compared to the long interglacials. The advent of sediment and ice cores revealed the true situation: glacials are long, interglacials short. It took some time for the current theory to be worked out.

The chemical evidence mainly consists of variations in the ratios of isotopes in fossils present in sediments and sedimentary rocks and ocean sediment cores. For the most recent glacial periods ice cores provide climate proxies from their ice, and atmospheric samples from included bubbles of air. Because water containing heavier isotopes has a higher heat of evaporation, its proportion decreases with colder conditions. This allows a temperature record to be constructed. This evidence can be confounded, however, by other factors recorded by isotope ratios. 

The paleontological evidence consists of changes in the geographical distribution of fossils. During a glacial period cold-adapted organisms spread into lower latitudes, and organisms that prefer warmer conditions become extinct or are squeezed into lower latitudes. This evidence is also difficult to interpret because it requires (1) sequences of sediments covering a long period of time, over a wide range of latitudes and which are easily correlated; (2) ancient organisms which survive for several million years without change and whose temperature preferences are easily diagnosed; and (3) the finding of the relevant fossils. 

Despite the difficulties, analysis of ice core and ocean sediment cores has shown periods of glacials and interglacials over the past few million years. These also confirm the linkage between ice ages and continental crust phenomena such as glacial moraines, drumlins, and glacial erratics. Hence the continental crust phenomena are accepted as good evidence of earlier ice ages when they are found in layers created much earlier than the time range for which ice cores and ocean sediment cores are available.

Major ice ages

 
Timeline of glaciations, shown in blue.
 
There have been at least five major ice ages in the Earth's history (the Huronian, Cryogenian, Andean-Saharan, late Paleozoic, and the latest Quaternary Ice Age). Outside these ages, the Earth seems to have been ice free even in high latitudes.

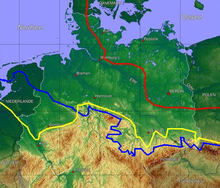
Ice age map of northern Germany and its northern neighbours. Red: maximum limit of Weichselian glacial; yellow: Saale glacial at maximum (Drenthe stage); blue: Elster glacial maximum glaciation.
 
Rocks from the earliest well established ice age, called the Huronian, formed around 2.4 to 2.1 Ga (billion years) ago during the early Proterozoic Eon. Several hundreds of km of the Huronian Supergroup are exposed 10–100 km north of the north shore of Lake Huron extending from near Sault Ste. Marie to Sudbury, northeast of Lake Huron, with giant layers of now-lithified till beds, dropstones, varves, outwash, and scoured basement rocks. Correlative Huronian deposits have been found near Marquette, Michigan, and correlation has been made with Paleoproterozoic glacial deposits from Western Australia. The Huronian ice age was caused by the elimination of atmospheric methane, a greenhouse gas, during the Great Oxygenation Event.

The next well-documented ice age, and probably the most severe of the last billion years, occurred from 720 to 630 million years ago (the Cryogenian period) and may have produced a Snowball Earth in which glacial ice sheets reached the equator, possibly being ended by the accumulation of greenhouse gases such as CO
2
produced by volcanoes. "The presence of ice on the continents and pack ice on the oceans would inhibit both silicate weathering and photosynthesis, which are the two major sinks for CO
2
at present." It has been suggested that the end of this ice age was responsible for the subsequent Ediacaran and Cambrian explosion, though this model is recent and controversial.

The Andean-Saharan occurred from 460 to 420 million years ago, during the Late Ordovician and the Silurian period. 

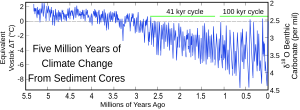
Sediment records showing the fluctuating sequences of glacials and interglacials during the last several million years.
 
The evolution of land plants at the onset of the Devonian period caused a long term increase in planetary oxygen levels and reduction of CO
2
levels, which resulted in the late Paleozoic icehouse. Its former name, the Karoo glaciation, was named after the glacial tills found in the Karoo region of South Africa. There were extensive polar ice caps at intervals from 360 to 260 million years ago in South Africa during the Carboniferous and early Permian Periods. Correlatives are known from Argentina, also in the center of the ancient supercontinent Gondwanaland

The Quaternary Glaciation / Quaternary Ice Age started about 2.58 million years ago at the beginning of the Quaternary Period when the spread of ice sheets in the Northern Hemisphere began. Since then, the world has seen cycles of glaciation with ice sheets advancing and retreating on 40,000- and 100,000-year time scales called glacial periods, glacials or glacial advances, and interglacial periods, interglacials or glacial retreats. The earth is currently in an interglacial, and the last glacial period ended about 10,000 years ago. All that remains of the continental ice sheets are the Greenland and Antarctic ice sheets and smaller glaciers such as on Baffin Island

The definition of the Quaternary as beginning 2.58 Ma is based on the formation of the Arctic ice cap. The Antarctic ice sheet began to form earlier, at about 34 Ma, in the mid-Cenozoic (Eocene-Oligocene Boundary). The term Late Cenozoic Ice Age is used to include this early phase.

Ice ages can be further divided by location and time; for example, the names Riss (180,000–130,000 years bp) and Würm (70,000–10,000 years bp) refer specifically to glaciation in the Alpine region. The maximum extent of the ice is not maintained for the full interval. The scouring action of each glaciation tends to remove most of the evidence of prior ice sheets almost completely, except in regions where the later sheet does not achieve full coverage.

Glacials and interglacials

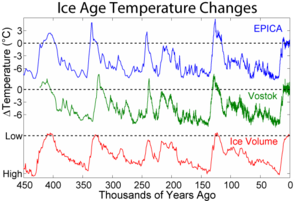
Shows the pattern of temperature and ice volume changes associated with recent glacials and interglacials
 
Minimum and maximum glaciation
 
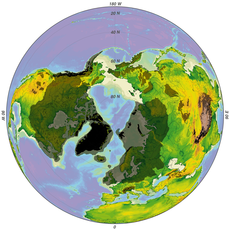
Minimum (interglacial, black) and maximum (glacial, grey) glaciation of the northern hemisphere
 
Minimum (interglacial, black) and maximum (glacial, grey) glaciation of the southern hemisphere
 
Within the ice ages (or at least within the current one), more temperate and more severe periods occur. The colder periods are called glacial periods, the warmer periods interglacials, such as the Eemian Stage.

Glacials are characterized by cooler and drier climates over most of the earth and large land and sea ice masses extending outward from the poles. Mountain glaciers in otherwise unglaciated areas extend to lower elevations due to a lower snow line. Sea levels drop due to the removal of large volumes of water above sea level in the icecaps. There is evidence that ocean circulation patterns are disrupted by glaciations. Since the earth has significant continental glaciation in the Arctic and Antarctic, we are currently in a glacial minimum of a glaciation. Such a period between glacial maxima is known as an interglacial. The glacials and interglacials also coincided with changes in Earth's orbit called Milankovitch cycles

The earth has been in an interglacial period known as the Holocene for around 11,700 years, and an article in Nature in 2004 argues that it might be most analogous to a previous interglacial that lasted 28,000 years. Predicted changes in orbital forcing suggest that the next glacial period would begin at least 50,000 years from now, due to the Milankovitch cycles. Moreover, anthropogenic forcing from increased greenhouse gases is estimated to potentially outweigh the orbital forcing of the Milankovitch cycles for hundreds of thousand of years.

Positive and negative feedback in glacial periods

Each glacial period is subject to positive feedback which makes it more severe, and negative feedback which mitigates and (in all cases so far) eventually ends it.

Positive feedback processes

Ice and snow increase Earth's albedo, i.e. they make it reflect more of the sun's energy and absorb less. Hence, when the air temperature decreases, ice and snow fields grow, and this continues until competition with a negative feedback mechanism forces the system to an equilibrium. Also, the reduction in forests caused by the ice's expansion increases albedo.

Another theory proposed by Ewing and Donn in 1956 hypothesized that an ice-free Arctic Ocean leads to increased snowfall at high latitudes. When low-temperature ice covers the Arctic Ocean there is little evaporation or sublimation and the polar regions are quite dry in terms of precipitation, comparable to the amount found in mid-latitude deserts. This low precipitation allows high-latitude snowfalls to melt during the summer. An ice-free Arctic Ocean absorbs solar radiation during the long summer days, and evaporates more water into the Arctic atmosphere. With higher precipitation, portions of this snow may not melt during the summer and so glacial ice can form at lower altitudes and more southerly latitudes, reducing the temperatures over land by increased albedo as noted above. Furthermore, under this hypothesis the lack of oceanic pack ice allows increased exchange of waters between the Arctic and the North Atlantic Oceans, warming the Arctic and cooling the North Atlantic. (Current projected consequences of global warming include a largely ice-free Arctic Ocean within 5–20 years.) Additional fresh water flowing into the North Atlantic during a warming cycle may also reduce the global ocean water circulation. Such a reduction (by reducing the effects of the Gulf Stream) would have a cooling effect on northern Europe, which in turn would lead to increased low-latitude snow retention during the summer. It has also been suggested that during an extensive glacial, glaciers may move through the Gulf of Saint Lawrence, extending into the North Atlantic Ocean far enough to block the Gulf Stream.

Negative feedback processes

Ice sheets that form during glaciations cause erosion of the land beneath them. After some time, this will reduce land above sea level and thus diminish the amount of space on which ice sheets can form. This mitigates the albedo feedback, as does the lowering in sea level that accompanies the formation of ice sheets.

Another factor is the increased aridity occurring with glacial maxima, which reduces the precipitation available to maintain glaciation. The glacial retreat induced by this or any other process can be amplified by similar inverse positive feedbacks as for glacial advances.

According to research published in Nature Geoscience, human emissions of carbon dioxide (CO2) will defer the next ice age. Researchers used data on Earth's orbit to find the historical warm interglacial period that looks most like the current one and from this have predicted that the next ice age would usually begin within 1,500 years. They go on to say that emissions have been so high that it will not.

Causes

The causes of ice ages are not fully understood for either the large-scale ice age periods or the smaller ebb and flow of glacial–interglacial periods within an ice age. The consensus is that several factors are important: atmospheric composition, such as the concentrations of carbon dioxide and methane (the specific levels of the previously mentioned gases are now able to be seen with the new ice core samples from EPICA Dome C in Antarctica over the past 800,000 years); changes in the earth's orbit around the Sun known as Milankovitch cycles; the motion of tectonic plates resulting in changes in the relative location and amount of continental and oceanic crust on the earth's surface, which affect wind and ocean currents; variations in solar output; the orbital dynamics of the Earth–Moon system; the impact of relatively large meteorites and volcanism including eruptions of supervolcanoes.

Some of these factors influence each other. For example, changes in Earth's atmospheric composition (especially the concentrations of greenhouse gases) may alter the climate, while climate change itself can change the atmospheric composition (for example by changing the rate at which weathering removes CO
2
). 

Maureen Raymo, William Ruddiman and others propose that the Tibetan and Colorado Plateaus are immense CO
2
"scrubbers" with a capacity to remove enough CO
2
from the global atmosphere to be a significant causal factor of the 40 million year Cenozoic Cooling trend. They further claim that approximately half of their uplift (and CO
2
"scrubbing" capacity) occurred in the past 10 million years.

Changes in Earth's atmosphere

There is evidence that greenhouse gas levels fell at the start of ice ages and rose during the retreat of the ice sheets, but it is difficult to establish cause and effect (see the notes above on the role of weathering). Greenhouse gas levels may also have been affected by other factors which have been proposed as causes of ice ages, such as the movement of continents and volcanism. 

The Snowball Earth hypothesis maintains that the severe freezing in the late Proterozoic was ended by an increase in CO
2
levels in the atmosphere, mainly from volcanoes, and some supporters of Snowball Earth argue that it was caused in the first place by a reduction in atmospheric CO
2
. The hypothesis also warns of future Snowball Earths.

In 2009, further evidence was provided that changes in solar insolation provide the initial trigger for the earth to warm after an Ice Age, with secondary factors like increases in greenhouse gases accounting for the magnitude of the change.

Human-induced changes

There is considerable evidence that over the very recent period of the last 100–1000 years, the sharp increases in human activity, especially the burning of fossil fuels, has caused the parallel sharp and accelerating increase in atmospheric greenhouse gases which trap the sun's heat. The consensus theory of the scientific community is that the resulting greenhouse effect is a principal cause of the increase in global warming which has occurred over the same period, and a chief contributor to the accelerated melting of the remaining glaciers and polar ice. A 2012 investigation finds that dinosaurs released methane through digestion in a similar amount to humanity's current methane release, which "could have been a key factor" to the very warm climate 150 million years ago.

William Ruddiman has proposed the early anthropocene hypothesis, according to which the anthropocene era, as some people call the most recent period in the earth's history when the activities of the human species first began to have a significant global impact on the earth's climate and ecosystems, did not begin in the 18th century with the advent of the Industrial Era, but dates back to 8,000 years ago, due to intense farming activities of our early agrarian ancestors. It was at that time that atmospheric greenhouse gas concentrations stopped following the periodic pattern of the Milankovitch cycles. In his overdue-glaciation hypothesis Ruddiman states that an incipient glacial would probably have begun several thousand years ago, but the arrival of that scheduled glacial was forestalled by the activities of early farmers.

At a meeting of the American Geophysical Union (December 17, 2008), scientists detailed evidence in support of the controversial idea that the introduction of large-scale rice agriculture in Asia, coupled with extensive deforestation in Europe began to alter world climate by pumping significant amounts of greenhouse gases into the atmosphere over the last 1,000 years. In turn, a warmer atmosphere heated the oceans making them much less efficient storehouses of carbon dioxide and reinforcing global warming, possibly forestalling the onset of a new glacial age.

Position of the continents

The geological record appears to show that ice ages start when the continents are in positions which block or reduce the flow of warm water from the equator to the poles and thus allow ice sheets to form. The ice sheets increase Earth's reflectivity and thus reduce the absorption of solar radiation. With less radiation absorbed the atmosphere cools; the cooling allows the ice sheets to grow, which further increases reflectivity in a positive feedback loop. The ice age continues until the reduction in weathering causes an increase in the greenhouse effect.

There are three main contributors from the layout of the continents that obstruct the movement of warm water to the poles:
  • A continent sits on top of a pole, as Antarctica does today.
  • A polar sea is almost land-locked, as the Arctic Ocean is today.
  • A supercontinent covers most of the equator, as Rodinia did during the Cryogenian period.
Since today's Earth has a continent over the South Pole and an almost land-locked ocean over the North Pole, geologists believe that Earth will continue to experience glacial periods in the geologically near future. 

Some scientists believe that the Himalayas are a major factor in the current ice age, because these mountains have increased Earth's total rainfall and therefore the rate at which carbon dioxide is washed out of the atmosphere, decreasing the greenhouse effect. The Himalayas' formation started about 70 million years ago when the Indo-Australian Plate collided with the Eurasian Plate, and the Himalayas are still rising by about 5 mm per year because the Indo-Australian plate is still moving at 67 mm/year. The history of the Himalayas broadly fits the long-term decrease in Earth's average temperature since the mid-Eocene, 40 million years ago.

Fluctuations in ocean currents

Another important contribution to ancient climate regimes is the variation of ocean currents, which are modified by continent position, sea levels and salinity, as well as other factors. They have the ability to cool (e.g. aiding the creation of Antarctic ice) and the ability to warm (e.g. giving the British Isles a temperate as opposed to a boreal climate). The closing of the Isthmus of Panama about 3 million years ago may have ushered in the present period of strong glaciation over North America by ending the exchange of water between the tropical Atlantic and Pacific Oceans.

Analyses suggest that ocean current fluctuations can adequately account for recent glacial oscillations. During the last glacial period the sea-level has fluctuated 20–30 m as water was sequestered, primarily in the Northern Hemisphere ice sheets. When ice collected and the sea level dropped sufficiently, flow through the Bering Strait (the narrow strait between Siberia and Alaska is about 50 m deep today) was reduced, resulting in increased flow from the North Atlantic. This realigned the thermohaline circulation in the Atlantic, increasing heat transport into the Arctic, which melted the polar ice accumulation and reduced other continental ice sheets. The release of water raised sea levels again, restoring the ingress of colder water from the Pacific with an accompanying shift to northern hemisphere ice accumulation.

Uplift of the Tibetan plateau and surrounding mountain areas above the snowline

Matthias Kuhle's geological theory of Ice Age development was suggested by the existence of an ice sheet covering the Tibetan Plateau during the Ice Ages (Last Glacial Maximum?). According to Kuhle, the plate-tectonic uplift of Tibet past the snow-line has led to a surface of c. 2,400,000 square kilometres (930,000 sq mi) changing from bare land to ice with a 70% greater albedo. The reflection of energy into space resulted in a global cooling, triggering the Pleistocene Ice Age. Because this highland is at a subtropical latitude, with 4 to 5 times the insolation of high-latitude areas, what would be Earth's strongest heating surface has turned into a cooling surface.

Kuhle explains the interglacial periods by the 100,000-year cycle of radiation changes due to variations in Earth's orbit. This comparatively insignificant warming, when combined with the lowering of the Nordic inland ice areas and Tibet due to the weight of the superimposed ice-load, has led to the repeated complete thawing of the inland ice areas.

Variations in Earth's orbit (Milankovitch cycles)

The Milankovitch cycles are a set of cyclic variations in characteristics of the Earth's orbit around the Sun. Each cycle has a different length, so at some times their effects reinforce each other and at other times they (partially) cancel each other. 

Past and future of daily average insolation at top of the atmosphere on the day of the summer solstice, at 65 N latitude.
 
There is strong evidence that the Milankovitch cycles affect the occurrence of glacial and interglacial periods within an ice age. The present ice age is the most studied and best understood, particularly the last 400,000 years, since this is the period covered by ice cores that record atmospheric composition and proxies for temperature and ice volume. Within this period, the match of glacial/interglacial frequencies to the Milanković orbital forcing periods is so close that orbital forcing is generally accepted. The combined effects of the changing distance to the Sun, the precession of the Earth's axis, and the changing tilt of the Earth's axis redistribute the sunlight received by the Earth. Of particular importance are changes in the tilt of the Earth's axis, which affect the intensity of seasons. For example, the amount of solar influx in July at 65 degrees north latitude varies by as much as 22% (from 450 W/m² to 550 W/m²). It is widely believed that ice sheets advance when summers become too cool to melt all of the accumulated snowfall from the previous winter. Some believe that the strength of the orbital forcing is too small to trigger glaciations, but feedback mechanisms like CO
2
may explain this mismatch. 

While Milankovitch forcing predicts that cyclic changes in the Earth's orbital elements can be expressed in the glaciation record, additional explanations are necessary to explain which cycles are observed to be most important in the timing of glacial–interglacial periods. In particular, during the last 800,000 years, the dominant period of glacial–interglacial oscillation has been 100,000 years, which corresponds to changes in Earth's orbital eccentricity and orbital inclination. Yet this is by far the weakest of the three frequencies predicted by Milankovitch. During the period 3.0–0.8 million years ago, the dominant pattern of glaciation corresponded to the 41,000-year period of changes in Earth's obliquity (tilt of the axis). The reasons for dominance of one frequency versus another are poorly understood and an active area of current research, but the answer probably relates to some form of resonance in the Earth's climate system. Recent work suggests that the 100K year cycle dominates due to increased southern-pole sea-ice increasing total solar reflectivity.

The "traditional" Milankovitch explanation struggles to explain the dominance of the 100,000-year cycle over the last 8 cycles. Richard A. Muller, Gordon J. F. MacDonald, and others have pointed out that those calculations are for a two-dimensional orbit of Earth but the three-dimensional orbit also has a 100,000-year cycle of orbital inclination. They proposed that these variations in orbital inclination lead to variations in insolation, as the Earth moves in and out of known dust bands in the solar system. Although this is a different mechanism to the traditional view, the "predicted" periods over the last 400,000 years are nearly the same. The Muller and MacDonald theory, in turn, has been challenged by Jose Antonio Rial.

Another worker, William Ruddiman, has suggested a model that explains the 100,000-year cycle by the modulating effect of eccentricity (weak 100,000-year cycle) on precession (26,000-year cycle) combined with greenhouse gas feedbacks in the 41,000- and 26,000-year cycles. Yet another theory has been advanced by Peter Huybers who argued that the 41,000-year cycle has always been dominant, but that the Earth has entered a mode of climate behavior where only the second or third cycle triggers an ice age. This would imply that the 100,000-year periodicity is really an illusion created by averaging together cycles lasting 80,000 and 120,000 years. This theory is consistent with a simple empirical multi-state model proposed by Didier Paillard. Paillard suggests that the late Pleistocene glacial cycles can be seen as jumps between three quasi-stable climate states. The jumps are induced by the orbital forcing, while in the early Pleistocene the 41,000-year glacial cycles resulted from jumps between only two climate states. A dynamical model explaining this behavior was proposed by Peter Ditlevsen. This is in support of the suggestion that the late Pleistocene glacial cycles are not due to the weak 100,000-year eccentricity cycle, but a non-linear response to mainly the 41,000-year obliquity cycle.

Variations in the Sun's energy output

There are at least two types of variation in the Sun's energy output
  • In the very long term, astrophysicists believe that the Sun's output increases by about 7% every one billion (109) years.
  • Shorter-term variations such as sunspot cycles, and longer episodes such as the Maunder Minimum, which occurred during the coldest part of the Little Ice Age.
The long-term increase in the Sun's output cannot be a cause of ice ages.

Volcanism

Volcanic eruptions may have contributed to the inception and/or the end of ice age periods. At times during the paleoclimate, carbon dioxide levels were two or three times greater than today. Volcanoes and movements in continental plates contributed to high amounts of CO2 in the atmosphere. Carbon dioxide from volcanoes probably contributed to periods with highest overall temperatures. One suggested explanation of the Paleocene-Eocene Thermal Maximum is that undersea volcanoes released methane from clathrates and thus caused a large and rapid increase in the greenhouse effect. There appears to be no geological evidence for such eruptions at the right time, but this does not prove they did not happen.

Recent glacial and interglacial phases

Northern hemisphere glaciation during the last ice ages. The setup of 3 to 4 kilometer thick ice sheets caused a sea level lowering of about 120 m.
 
The current geological period, the Quaternary, which began about 2.6 million years ago and extends into the present, is marked by warm and cold episodes, cold phases called glacials (Quaternary ice age) lasting about 100,000 years, and which are then interrupted by the warmer interglacials which lasted about 10,000–15,000 years. The last cold episode of the last glacial period ended about 10,000 years ago. Earth is currently in an interglacial period of the Quaternary, called the Holocene.

Glacial stages in North America

The major glacial stages of the current ice age in North America are the Illinoian, Eemian and Wisconsin glaciation. The use of the Nebraskan, Afton, Kansan, and Yarmouthian stages to subdivide the ice age in North America has been discontinued by Quaternary geologists and geomorphologists. These stages have all been merged into the Pre-Illinoian in the 1980s.

During the most recent North American glaciation, during the latter part of the Last Glacial Maximum (26,000 to 13,300 years ago), ice sheets extended to about 45th parallel north. These sheets were 3 to 4 kilometres (1.9 to 2.5 mi) thick.

Stages of proglacial lake development in the region of the current North American Great Lakes.
 
This Wisconsin glaciation left widespread impacts on the North American landscape. The Great Lakes and the Finger Lakes were carved by ice deepening old valleys. Most of the lakes in Minnesota and Wisconsin were gouged out by glaciers and later filled with glacial meltwaters. The old Teays River drainage system was radically altered and largely reshaped into the Ohio River drainage system. Other rivers were dammed and diverted to new channels, such as Niagara Falls, which formed a dramatic waterfall and gorge, when the waterflow encountered a limestone escarpment. Another similar waterfall, at the present Clark Reservation State Park near Syracuse, New York, is now dry. 

The area from Long Island to Nantucket, Massachusetts was formed from glacial till, and the plethora of lakes on the Canadian Shield in northern Canada can be almost entirely attributed to the action of the ice. As the ice retreated and the rock dust dried, winds carried the material hundreds of miles, forming beds of loess many dozens of feet thick in the Missouri Valley. Post-glacial rebound continues to reshape the Great Lakes and other areas formerly under the weight of the ice sheets.

The Driftless Area, a portion of western and southwestern Wisconsin along with parts of adjacent Minnesota, Iowa, and Illinois, was not covered by glaciers.

Last Glacial Period in the semiarid Andes around Aconcagua and Tupungato

A specially interesting climatic change during glacial times has taken place in the semi-arid Andes. Beside the expected cooling down in comparison with the current climate, a significant precipitation change happened here. So, researches in the presently semiarid subtropic Aconcagua-massif (6,962 m) have shown an unexpectedly extensive glacial glaciation of the type "ice stream network". The connected valley glaciers exceeding 100 km in length, flowed down on the East-side of this section of the Andes at 32–34°S and 69–71°W as far as a height of 2,060 m and on the western luff-side still clearly deeper. Where current glaciers scarcely reach 10 km in length, the snowline (ELA) runs at a height of 4,600 m and at that time was lowered to 3,200 m asl, i.e. about 1,400 m. From this follows that—beside of an annual depression of temperature about c. 8.4 °C— here was an increase in precipitation. Accordingly, at glacial times the humid climatic belt that today is situated several latitude degrees further to the S, was shifted much further to the N.

Effects of glaciation

Scandinavia exhibits some of the typical effects of ice age glaciation such as fjords and lakes.

Although the last glacial period ended more than 8,000 years ago, its effects can still be felt today. For example, the moving ice carved out the landscape in Canada (See Canadian Arctic Archipelago), Greenland, northern Eurasia and Antarctica. The erratic boulders, till, drumlins, eskers, fjords, kettle lakes, moraines, cirques, horns, etc., are typical features left behind by the glaciers.

The weight of the ice sheets was so great that they deformed the Earth's crust and mantle. After the ice sheets melted, the ice-covered land rebounded. Due to the high viscosity of the Earth's mantle, the flow of mantle rocks which controls the rebound process is very slow—at a rate of about 1 cm/year near the center of rebound area today. 

During glaciation, water was taken from the oceans to form the ice at high latitudes, thus global sea level dropped by about 110 meters, exposing the continental shelves and forming land-bridges between land-masses for animals to migrate. During deglaciation, the melted ice-water returned to the oceans, causing sea level to rise. This process can cause sudden shifts in coastlines and hydration systems resulting in newly submerged lands, emerging lands, collapsed ice dams resulting in salination of lakes, new ice dams creating vast areas of freshwater, and a general alteration in regional weather patterns on a large but temporary scale. It can even cause temporary reglaciation. This type of chaotic pattern of rapidly changing land, ice, saltwater and freshwater has been proposed as the likely model for the Baltic and Scandinavian regions, as well as much of central North America at the end of the last glacial maximum, with the present-day coastlines only being achieved in the last few millennia of prehistory. Also, the effect of elevation on Scandinavia submerged a vast continental plain that had existed under much of what is now the North Sea, connecting the British Isles to Continental Europe.

The redistribution of ice-water on the surface of the Earth and the flow of mantle rocks causes changes in the gravitational field as well as changes to the distribution of the moment of inertia of the Earth. These changes to the moment of inertia result in a change in the angular velocity, axis, and wobble of the Earth's rotation. 

The weight of the redistributed surface mass loaded the lithosphere, caused it to flex and also induced stress within the Earth. The presence of the glaciers generally suppressed the movement of faults below. During deglaciation, the faults experience accelerated slip triggering earthquakes. Earthquakes triggered near the ice margin may in turn accelerate ice calving and may account for the Heinrich events. As more ice is removed near the ice margin, more intraplate earthquakes are induced and this positive feedback may explain the fast collapse of ice sheets. 

In Europe, glacial erosion and isostatic sinking from weight of ice made the Baltic Sea, which before the Ice Age was all land drained by the Eridanos River.

Delayed-choice quantum eraser

From Wikipedia, the free encyclopedia https://en.wikipedia.org/wiki/Delayed-choice_quantum_eraser A delayed-cho...