Search This Blog

Wednesday, March 31, 2021

Effects of climate change on oceans

Global mean land-ocean temperature change from 1880–2011, relative to the 1951–1980 mean. The black line is the annual mean and the red line is the 5-year running mean. The green bars show uncertainty estimates. Source: NASA GISS

Effects of climate change on oceans provides information on the various effects that climate change has on oceans. Climate change can affect sea levels, coastlines, ocean acidification, ocean currents, seawater, sea surface temperatures, tides, the sea floor, weather, and trigger several changes in ocean bio-geochemistry; all of these affect the functioning of a society.

Sea level

Waves on an ocean coast
 
Animated map exhibiting the world's oceanic waters. A continuous body of water encircling Earth, the World Ocean is divided into a number of principal areas with relatively free interchange among them. Five oceanic divisions are usually reckoned: Pacific, Atlantic, Indian, Arctic, and Southern; the last two listed are sometimes consolidated into the first three.
 
Energy (heat) added to various parts of the climate system due to global warming.

Coasts

There are a number of factors affecting rising sea levels, including the thermal expansion of seawater, the melting of glaciers and ice sheets on land, and possibly human changes to groundwater storage.

The consensus of many studies of coastal tide gauge records is that during the past century sea level has risen worldwide at an average rate of 1–2 mm/yr reflecting a net flux of heat into the surface of the land and oceans. Corresponding studies based on satellite altimetry shows that this rate has increased to closer to 3 mm/yr during the more completely monitored past 20 years. A recent review of the literature suggests that 30% of the sea level rise since 1993 is due to thermal expansion and 55% due to continental ice melt, both resulting from warming global temperatures. In another study, results estimate the heat content of the ocean in the upper 700 meters has increased significantly from 1955–2010. It has to be reminded that in this context the usage of the word heat is extremely improper, as heat cannot be stored in a body but only exchanged between bodies. Observations of the changes in "heat content" of the ocean are important for providing realistic estimates of how the ocean is changing with global warming. An even more recent study of the contributions to global sea level due to melting of the two large ice sheets based on satellite measurements of gravity fluctuations suggests that the melting of these alone are causing global sea level to about 1 mm/yr. In a recent modeling study, scientists used an earth system model to study several variables of the ocean, one of which was the "heat content" of the oceans over the past several hundred years. The earth system model incorporated the atmosphere, land surface processes, and other earth components to make it more realistic and similar to observations. Results of their model simulation showed that since 1500, the ocean "heat content" of the upper 500 m has increased.

The connection between sea level rise and ocean thermal expansion follows from Charles's law (also known as the law of volumes) put simply states that the volume of a given mass is proportional to its temperature. This contribution to sea level is monitored by oceanographers using a succession of temperature measuring profiling instruments, which is then compiled at national data centers such as the United States National Oceanographic Data Center. The International Panel on Climate Change (IPCC) Fifth Assessment Report estimates that the upper ocean (surface to 750 m deep) has warmed by 0.09 to 0.13 degrees C per decade over the past 40 years. Other processes important in influencing global sea level include changes to groundwater storage including dams and reservoirs.

Global warming also has an enormous impact with respect to melting glaciers and ice sheets. Higher global temperatures melt glaciers such as the one in Greenland, which flow into the oceans, adding to the amount of seawater. A large rise (on the order of several feet) in global sea levels poses many threats. According to the U.S. Environmental Protection Agency (EPA), “such a rise would inundate coastal wetlands and lowlands, erode beaches, increase the risk of flooding, and increase the salinity of estuaries, aquifers, and wetlands.” The seasonal cycles are closely linked with the seasonal changes in sea ice and sea surface temperatures. The timing and amplitude of the seasonal cycle has been altered by global warming.

Superimposed on the global rise in sea level, is strong regional and decadal variability which may cause sea level along a particular coastline to decline with time (for example along the Canadian eastern seaboard), or to rise faster than the global average. Regions that have shown a rapid rise in sea level during the past two decades include the western tropical Pacific and the United States northeastern seaboard. These regional variations in sea level are the result of many factors, such as local sedimentation rates, geomorphology, post-glacial rebound, and coastal erosion. Large storm events, such as Hurricane Sandy in the eastern Atlantic, can dramatically alter coastlines and affect sea level rise as well.

Coastal regions would be most affected by rising sea levels. The increase in sea level along the coasts of continents, especially North America are much more significant than the global average. According to 2007 estimates by the International Panel on Climate Change (IPCC), “global average sea level will rise between 0.6 and 2 feet (0.18 to 0.59 meters) in the next century. Along the U.S. Mid-Atlantic and Gulf Coasts, however, sea level rose in the last century 5 to 6 inches more than the global average. This is due to the subsiding of coastal lands. The sea level along the U.S. Pacific coast has also increased more than the global average but less than along the Atlantic coast. This can be explained by the varying continental margins along both coasts; the Atlantic type continental margin is characterized by a wide, gently sloping continental shelf, while the Pacific type continental margin incorporates a narrow shelf and slope descending into a deep trench. Since low-sloping coastal regions should retreat faster than higher-sloping regions, the Atlantic coast is more vulnerable to sea level rise than the Pacific coast.

Society

The rise in sea level along coastal regions carries implications for a wide range of habitats and inhabitants. Firstly, rising sea levels will have a serious impact on beaches— a place which humans love to visit recreationally and a prime location for real estate. It is ideal to live on the coast, due to a more moderate climate and pleasant scenery, but beachfront property is at risk from eroding land and rising sea levels. Since the threat posed by rising sea levels has become more prominent, property owners and local government have taken measures to prepare for the worst. For example, “Maine has enacted a policy declaring that shorefront buildings will have to be moved to enable beaches and wetlands to migrate inland to higher ground.” Additionally, many coastal states add sand to their beaches to offset shore erosion, and many property owners have elevated their structures in low-lying areas. As a result of the erosion and ruin of properties by large storms on coastal lands, governments have looked into buying land and having residents relocate further inland. The seas now absorb much of human-generated carbon dioxide, which then affects temperature change. The oceans store 93 percent of that energy which helps keep the planet livable by moderating temperatures.

Another important coastal habitat that is threatened by sea level rise is wetlands, which “occur along the margins of estuaries and other shore areas that are protected from the open ocean and include swamps, tidal flats, coastal marshes and bayous.” Wetlands are extremely vulnerable to rising sea levels, since they are within several feet of sea level. The threat posed to wetlands is serious, due to the fact that they are highly productive ecosystems, and they have an enormous impact on the economy of surrounding areas. Wetlands in the U.S. are rapidly disappearing due to an increase in housing, industry, and agriculture, and rising sea levels contribute to this dangerous trend. As a result of rising sea levels, the outer boundaries of wetlands tend to erode, forming new wetlands more inland. According to the EPA, “the amount of newly created wetlands, however, could be much smaller than the lost area of wetlands— especially in developed areas protected with bulkheads, dikes, and other structures that keep new wetlands from forming inland.” When estimating a sea level rise within the next century of 50 cm (20 inches), the U.S. would lose 38% to 61% of its existing coastal wetlands.

A rise in sea level will have a negative impact not only on coastal property and economy but on our supply of fresh water. According to the EPA, “Rising sea level increases the salinity of both surface water and ground water through salt water intrusion.” Coastal estuaries and aquifers, therefore, are at a high risk of becoming too saline from rising sea levels. With respect to estuaries, an increase in salinity would threaten aquatic animals and plants that cannot tolerate high levels of salinity. Aquifers often serve as a primary water supply to surrounding areas, such as Florida's Biscayne aquifer, which receives freshwater from the Everglades and then supplies water to the Florida Keys. Rising sea levels would submerge low-lying areas of the Everglades, and salinity would greatly increase in portions of the aquifer. The considerable rise in sea level and the decreasing amounts of freshwater along the Atlantic and Gulf coasts would make those areas rather uninhabitable. Many economists predict that global warming will be one of the main economic threats to the West Coast, specifically in California. "Low-lying coastal areas, such as along the Gulf Coast, are particularly vulnerable to sea-level rise and stronger storms—and those risks are reflected in rising insurance rates and premiums. In Florida, for example, the average price of a homeowners’ policy increased by 77 percent between 2001 and 2006."

Global issue

Since rising sea levels present a pressing problem not only to coastal communities but to the whole global population as well, much scientific research has been performed to analyze the causes and consequences of a rise in sea level. The U.S. Geological Survey has conducted such research, addressing coastal vulnerability to sea level rise and incorporating six physical variables to analyze the changes in sea level: geomorphology; coastal slope (percent); rate of relative sea level rise (mm/yr); shoreline erosion and acceleration rates (m/yr); mean tidal range (m); and mean wave height (m). The research was conducted on the various coasts of the U.S., and the results are very useful for future reference. Along the Pacific coast, the most vulnerable areas are low-lying beaches, and “their susceptibility is primarily a function of geomorphology and coastal slope.” With regard to research performed along the Atlantic coast, the most vulnerable areas to sea level rise were found to be along the Mid-Atlantic coast (Maryland to North Carolina) and Northern Florida, since these are “typically high-energy coastlines where the regional coastal slope is low and where the major landform type is a barrier island.” For the Gulf coast, the most vulnerable areas are along the Louisiana-Texas coast. According to the results, “the highest-vulnerability areas are typically lower-lying beach and marsh areas; their susceptibility is primarily a function of geomorphology, coastal slope and rate of relative sea-level rise.”

Many humanitarians and environmentalists believe that political policy needs to have a bigger role in carbon dioxide reduction. Humans have a substantial influence on the rise of sea level because we emit increasing levels of carbon dioxide into the atmosphere through automobile use and industry. A higher amount of carbon dioxide in the atmosphere leads to higher global temperatures, which then results in thermal expansion of seawater and melting of glaciers and ice sheets.

Ocean currents

The currents in the world's oceans are a result of varying temperatures associated with the changing latitudes of our planet. As the atmosphere is warmed nearest the equator, the hot air at the surface of our planet is heated, causing it to rise and draw in cooler air to take its place, creating what is known as circulation cells. This ultimately causes the air to be significantly colder near the poles than at the equator.

Wind patterns associated with these circulation cells drive surface currents which push the surface water to the higher latitudes where the air is colder. This cools the water down enough to where it is capable of dissolving more gasses and minerals, causing it to become very dense in relation to lower latitude waters, which in turn causes it to sink to the bottom of the ocean, forming what is known as North Atlantic Deep Water (NADW) in the north and Antarctic Bottom Water (AABW) in the south. Driven by this sinking and the upwelling that occurs in lower latitudes, as well as the driving force of the winds on surface water, the ocean currents act to circulate water throughout the entire sea. When global warming is added into the equation, changes occur, especially in the regions where deep water is formed. With the warming of the oceans and subsequent melting of glaciers and the polar ice caps, more and more fresh water is released into the high latitude regions where deep water is formed. This extra water that gets thrown into the chemical mix dilutes the contents of the water arriving from lower latitudes, reducing the density of the surface water. Consequently, the water sinks more slowly than it normally would.

It is important to note that ocean currents provide the necessary nutrients for life to sustain itself in the lower latitudes. Should the currents slow down, fewer nutrients would be brought to sustain ocean life resulting in a crumbling of the food chain and irreparable damage to the marine ecosystem. Slower currents would also mean less carbon fixation. Naturally, the ocean is the largest sink within which carbon is stored. When waters become saturated with carbon, excess carbon has nowhere to go, because the currents are not bringing up enough fresh water to fix the excess. This causes a rise in atmospheric carbon which in turn causes positive feedback that can lead to a runaway greenhouse effect.

Ocean acidification

The rate at which ocean acidification will occur may be influenced by the rate of surface ocean warming, because the chemical equilibria that govern seawater pH are temperature-dependent. Greater seawater warming could lead to a smaller change in pH for a given increase in CO2.

Another effect of global warming on the carbon cycle is ocean acidification. The ocean and the atmosphere constantly act to maintain a state of equilibrium, so a rise in atmospheric carbon naturally leads to a rise in oceanic carbon. When carbon dioxide is dissolved in water it forms hydrogen and bicarbonate ions, which in turn breaks down to hydrogen and carbonate ions. All these extra hydrogen ions increase the acidity of the ocean and make survival harder for planktonic organisms that depend on calcium carbonate to form their shells. A decrease in the base of the food chain will, once again, be destructive to the ecosystems to which they belong. With fewer of these photosynthetic organisms present at the surface of the ocean, less carbon dioxide will be converted to oxygen, thereby allowing the greenhouse gasses to go unchecked.

Steps are being taken to combat the potentially devastating effects of ocean acidification, and scientists worldwide are coming together to solve the problem that is known as “global warming’s evil twin”. 

Between 1750 and 2000, surface-ocean pH has decreased by about 0.1, from about 8.2 to about 8.1. Surface-ocean pH has probably not been below 8.1 during the past 2 million years. Projections suggest that surface-ocean pH could decrease by an additional 0.3–0.4 units by 2100. Ocean acidification could threaten coral reefs, fisheries, protected species, and other natural resources of value to society.

Effects of acidification

The effects of ocean acidification can already be seen and have been happening since the start of the industrial revolution, with pH levels of the ocean dropping by 0.1 since the pre-industrial revolution times. An effect called coral bleaching can be seen on the Great Barrier Reef in Australia, where ocean acidification's effects are already taking place. Coral bleaching is when unicellular organisms that help make up the coral begin to die off and leave the coral giving it a white appearance. These unicellular organisms are important for the coral to feed and get the proper nutrition that is necessary to survive, leaving the coral weak and malnourished. This results in weaker coral that can die more easily and offer less protection to the organisms that depend on coral for shelter and protection. Increased acidity can also dissolve an organism's shell, threatening entire groups of shellfish and zooplankton and in turn, presenting a threat to the food chain and ecosystem.

Without strong shells, surviving and growing becomes more of a challenge for marine life that depend on calcified shells. The populations of these animals becomes smaller and individual members of the species turn weaker. The fish that rely on these smaller shell constructing animals for food now have a decreased supply, and animals that need coral reefs for shelter now have less protection. The effects of ocean acidification decrease population sizes of marine life and may cause an economic disruption if enough fish die off, which can seriously harm the global economy as the fishing industry makes a lot of money worldwide.

Ocean acidification can also have affects on marine fish larvae. It internally affects their olfactory systems, which is a crucial part of their development, especially in the beginning stage of their life. Orange clownfish larvae mostly live on oceanic reefs that are surrounded by vegetative islands. With the use of their sense of smell, larvae are known to be able to detect the differences between reefs surrounded by vegetative islands and reefs not surrounded by vegetative islands. Clownfish larvae need to be able to distinguish between these two destinations to have the ability to locate an area that is satisfactory for their growth. Another use for marine fish olfactory systems is to help in determining the difference between their parents and other adult fish in order to avoid inbreeding.

At James Cook University's experimental aquarium facility, clownfish were sustained in non-manipulated seawater that obtained a pH of 8.15 ± 0.07 which is similar to our current ocean's pH. To test for effects of different pH levels, seawater was manipulated to three different pH levels, including the non-manipulated pH. The two opposing pH levels correspond with climate change models that predict future atmospheric CO2 levels. In the year 2100 the model predicts that we could potentially acquire CO2 levels at 1,000 ppm, which correlates with the pH of 7.8 ± 0.05. Continuing even further into the next century, we could have CO2 levels at 1,700 ppm, which correlates with a pH of 7.6 ± 0.05.

Results of this experiment show that when larvae is exposed to a pH of 7.8 ± 0.05 their reaction to environmental cues differs drastically to larvae's reaction to cues in a non-manipulated pH. Not only did if effect their reaction to environmental cues but their reaction to parental cues was also skewed compared to the larvae reared in a non-manipulated pH of 8.15 ± 0.07. At the pH of 7.6 ± 0.05 larvae had no reaction to any type of cue. These results display the negative outcomes that could possibly be the future for marine fish larvae.

Oxygen depletion

Ocean deoxygenation is projected to increase hypoxia by 10%, and triple suboxic waters (oxygen concentrations 98% less than the mean surface concentrations), for each 1 °C of upper ocean warming.

Marine life

Examples of projected impacts and vulnerabilities for fisheries associated with climate change

Research indicates that increasing ocean temperatures are taking a toll on the marine ecosystem. A study on phytoplankton changes in the Indian Ocean indicates a decline of up to 20% in marine phytoplankton during the past six decades. During the summer, the western Indian Ocean is home to one of the largest concentrations of marine phytoplankton blooms in the world when compared to other oceans in the tropics. Increased warming in the Indian Ocean enhances ocean stratification, which prevents nutrient mixing in the euphotic zone where there is ample light available for photosynthesis. Thus, primary production is constrained and the region's entire food web is disrupted. If rapid warming continues, experts predict that the Indian Ocean will transform into an ecological desert and will no longer be productive. The same study also addresses the abrupt decline of tuna catch rates in the Indian Ocean during the past half century. This decrease is mostly due to increased industrial fisheries, with ocean warming adding further stress to the fish species. These rates show a 50-90% decrease over 5 decades.

A study that describes climate-driven trends in contemporary ocean productivity looked at global-ocean net primary production (NPP) changes detected from satellite measurements of ocean color from 1997 to 2006. These measurements can be used to quantify ocean productivity on a global scale and relate changes to environmental factors. They found an initial increase in NPP from 1997 to 1999 followed by a continuous decrease in productivity after 1999. These trends are propelled by the expansive stratified low-latitude oceans and are closely linked to climate variability. This relationship between the physical environment and ocean biology effects the availability of nutrients for phytoplankton growth since these factors influence variations in upper-ocean temperature and stratification. The downward trends of ocean productivity after 1999 observed in this study can give insight into how climate change can affect marine life in the future.

Effects of Marine Life Danger in Society.

As stated before, marine life has been decreasing in percentage as the time goes on due to the increase in ocean pollution being the main component plastic that is eaten by marine animals. Along with marine life, humans are also being affected by ocean pollution. One of the biggest animal protein industries, as it is the seafood industry, is affected since marine life has been decreasing and it is predicted that if they continue using the harmful techniques that are being used, by 2048 there is the possibility of an ocean without fish. The seafood industry has a big impact in the world’s food industry, proving food for approximately 3 billion people. One of the many famous and trending diets that are out there are the pescatarian diet, in which vegetarian diets followers add fish or other types of seafood in order to obtain the nutrients from the fish. If it comes to the point in which the seafood industry keep growing, as more people are joining this type of food trends and eating more fish (more demand means more production), and using techniques that deteriorate the marine life beyond catching the animals we will end up at the point of no return: where the marine life is extinct and we as humans will not be able to consume such as good source of protein in order to meet the required necessities. The ocean pollution does not mean that only marine life is being damaged, but also that we as humans will deprive ourselves from a great privilege as it is seafood and marine life.

Weather

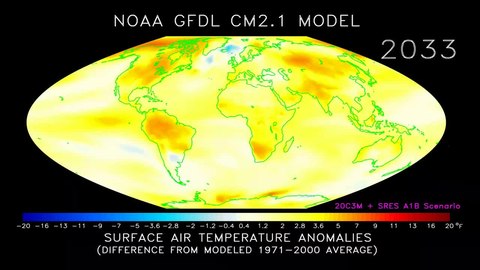
Global warming also affects weather patterns as they pertain to cyclones. Scientists have found that although there have been fewer cyclones than in the past, the intensity of each cyclone has increased. A simplified definition of what global warming means for the planet is that colder regions would get warmer and warmer regions would get much warmer. However, there is also speculation that the complete opposite could be true. A warmer earth could serve to moderate temperatures worldwide. There is still much that is not understood about the earth's climate, because it is very difficult to make climate models. As such, predicting the effects that global warming might have on our planet is still an inexact science. Global warming is also causing the amount of hazards on the ocean to increase. It has increased the amount of fog at sea level, making it harder for ships to navigate without crashing into other boats or other objects in the ocean. The warmness and dampness of the ground is causing the fog to come closer to the surface level of the ocean. As the rain falls it makes the ground wet, then the warm air rises leaving a layer of cold air that turns into fog causing an unsafe ocean for travel and for working conditions on the ocean. It is also causing the ocean to create more floods due to the fact that it is warming up and the glaciers from the ice age are now melting causing the sea levels to rise, which causes the ocean to take over part of the land and beaches. Glaciers are melting at an alarming rate which is causing the ocean to rise faster than predicted. Inside of this ice there are traces of bubbles that are filled with CO2 that are then released into the atmosphere when they melt causing the greenhouse effect to grow at an even faster rate.

Regional weather patterns across the globe are also changing due to tropical ocean warming. The Indo-Pacific warm pool has been warming rapidly and expanding during the recent decades, largely in response to increased carbon emissions from fossil fuel burning. The warm pool expanded to almost double its size, from an area of 22 million km2 during 1900–1980, to an area of 40 million km2 during 1981–2018. This expansion of the warm pool has altered global rainfall patterns, by changing the life cycle of the Madden Julian Oscillation (MJO), which is the most dominant mode of weather fluctuation originating in the tropics.

Seafloor

It is known that climate affects the ocean and the ocean affects the climate. Due to climate change, as the ocean gets warmer this too has an effect on the seafloor. Because of greenhouse gases such as carbon dioxide, this warming will have an effect on the bicarbonate buffer of the ocean. The bicarbonate buffer is the concentration of bicarbonate ions that keeps the ocean's acidity balanced within a pH range of 7.5–8.4. Addition of carbon dioxide to the ocean water makes the oceans more acidic. Increased ocean acidity is not good for the planktonic organisms that depend on calcium to form their shells. Calcium dissolves with very weak acids and any increase in the ocean's acidity will be destructive for the calcareous organisms. Increased ocean acidity will lead to decreased Calcite Compensation Depth (CCD), causing calcite to dissolve in shallower waters. This will then have a great effect on the calcareous ooze in the ocean, because the sediment itself would begin to dissolve.

Predictions

Calculations prepared in or before 2001 from a range of climate models under the SRES A2 emissions scenario, which assumes no action is taken to reduce emissions and regionally divided economic development.
 
The geographic distribution of surface warming during the 21st century calculated by the HadCM3 climate model if a business as usual scenario is assumed for economic growth and greenhouse gas emissions. In this figure, the globally averaged warming corresponds to 3.0 °C (5.4 °F).

A temperature rise of 1.5°C above preindustrial levels is projected to make existence impossible for 10% of fishes in their typical geographical range. A temperature rise of 5°C above this level is projected to make existence impossible for 60% of fishes in their geographical range. The main reason is Oxygen depletion as one of the consequences of the rise in temperature. Further, the change in temperature and decrease in oxygen is expected to occur too quickly for effective adaptation of affected species. Fishes can migrate to cooler places, but there are not always appropriate spawning sites.

If ocean temperatures rise it will have an effect right beneath the ocean floor and it will allow the addition of another greenhouse gas, methane gas. Methane gas has been found under methane hydrate, frozen methane and water, beneath the ocean floor. With the ocean warming, this methane hydrate will begin to melt and release methane gas, contributing to global warming. However, recent research has found that CO2 uptake outpaces methane release in these areas of the ocean causing overall decreases in global warming. Increase of water temperature will also have a devastating effect on different oceanic ecosystems like coral reefs. The direct effect is the coral bleaching of these reefs, which live within a narrow temperature margin, so a small increase in temperature would have a drastic effects in these environments. When corals bleach it is because the coral loses 60–90% of their zooxanthellae due to various stressors, ocean temperature being one of them. If the bleaching is prolonged, the coral host would die.

Although uncertain, another effect of climate change may be the growth, toxicity, and distribution of harmful algal blooms. These algal blooms have serious effects on not only marine ecosystems, killing sea animals and fish with their toxins, but also for humans as well. Some of these blooms deplete the oxygen around them to levels low enough to kill fish.

General circulation model

From Wikipedia, the free encyclopedia

Climate models are systems of differential equations based on the basic laws of physics, fluid motion, and chemistry. To "run" a model, scientists divide the planet into a 3-dimensional grid, apply the basic equations, and evaluate the results. Atmospheric models calculate winds, heat transfer, radiation, relative humidity, and surface hydrology within each grid and evaluate interactions with neighboring points.
 
This visualization shows early test renderings of a global computational model of Earth's atmosphere based on data from NASA's Goddard Earth Observing System Model, Version 5 (GEOS-5).

A general circulation model (GCM) is a type of climate model. It employs a mathematical model of the general circulation of a planetary atmosphere or ocean. It uses the Navier–Stokes equations on a rotating sphere with thermodynamic terms for various energy sources (radiation, latent heat). These equations are the basis for computer programs used to simulate the Earth's atmosphere or oceans. Atmospheric and oceanic GCMs (AGCM and OGCM) are key components along with sea ice and land-surface components.

GCMs and global climate models are used for weather forecasting, understanding the climate, and forecasting climate change.

Versions designed for decade to century time scale climate applications were originally created by Syukuro Manabe and Kirk Bryan at the Geophysical Fluid Dynamics Laboratory (GFDL) in Princeton, New Jersey. These models are based on the integration of a variety of fluid dynamical, chemical and sometimes biological equations.

Terminology

The acronym GCM originally stood for General Circulation Model. Recently, a second meaning came into use, namely Global Climate Model. While these do not refer to the same thing, General Circulation Models are typically the tools used for modelling climate, and hence the two terms are sometimes used interchangeably. However, the term "global climate model" is ambiguous and may refer to an integrated framework that incorporates multiple components including a general circulation model, or may refer to the general class of climate models that use a variety of means to represent the climate mathematically.

History

In 1956, Norman Phillips developed a mathematical model that could realistically depict monthly and seasonal patterns in the troposphere. It became the first successful climate model. Following Phillips's work, several groups began working to create GCMs. The first to combine both oceanic and atmospheric processes was developed in the late 1960s at the NOAA Geophysical Fluid Dynamics Laboratory. By the early 1980s, the United States' National Center for Atmospheric Research had developed the Community Atmosphere Model; this model has been continuously refined. In 1996, efforts began to model soil and vegetation types. Later the Hadley Centre for Climate Prediction and Research's HadCM3 model coupled ocean-atmosphere elements. The role of gravity waves was added in the mid-1980s. Gravity waves are required to simulate regional and global scale circulations accurately.

Atmospheric and oceanic models

Atmospheric (AGCMs) and oceanic GCMs (OGCMs) can be coupled to form an atmosphere-ocean coupled general circulation model (CGCM or AOGCM). With the addition of submodels such as a sea ice model or a model for evapotranspiration over land, AOGCMs become the basis for a full climate model.

Structure

Three-dimensional (more properly four-dimensional) GCMs apply discrete equations for fluid motion and integrate these forward in time. They contain parameterisations for processes such as convection that occur on scales too small to be resolved directly.

A simple general circulation model (SGCM) consists of a dynamic core that relates properties such as temperature to others such as pressure and velocity. Examples are programs that solve the primitive equations, given energy input and energy dissipation in the form of scale-dependent friction, so that atmospheric waves with the highest wavenumbers are most attenuated. Such models may be used to study atmospheric processes, but are not suitable for climate projections.

Atmospheric GCMs (AGCMs) model the atmosphere (and typically contain a land-surface model as well) using imposed sea surface temperatures (SSTs). They may include atmospheric chemistry.

AGCMs consist of a dynamical core which integrates the equations of fluid motion, typically for:

  • surface pressure
  • horizontal components of velocity in layers
  • temperature and water vapor in layers
  • radiation, split into solar/short wave and terrestrial/infrared/long wave
  • parameters for:

A GCM contains prognostic equations that are a function of time (typically winds, temperature, moisture, and surface pressure) together with diagnostic equations that are evaluated from them for a specific time period. As an example, pressure at any height can be diagnosed by applying the hydrostatic equation to the predicted surface pressure and the predicted values of temperature between the surface and the height of interest. Pressure is used to compute the pressure gradient force in the time-dependent equation for the winds.

OGCMs model the ocean (with fluxes from the atmosphere imposed) and may contain a sea ice model. For example, the standard resolution of HadOM3 is 1.25 degrees in latitude and longitude, with 20 vertical levels, leading to approximately 1,500,000 variables.

AOGCMs (e.g. HadCM3, GFDL CM2.X) combine the two submodels. They remove the need to specify fluxes across the interface of the ocean surface. These models are the basis for model predictions of future climate, such as are discussed by the IPCC. AOGCMs internalise as many processes as possible. They have been used to provide predictions at a regional scale. While the simpler models are generally susceptible to analysis and their results are easier to understand, AOGCMs may be nearly as hard to analyse as the climate itself.

Grid

The fluid equations for AGCMs are made discrete using either the finite difference method or the spectral method. For finite differences, a grid is imposed on the atmosphere. The simplest grid uses constant angular grid spacing (i.e., a latitude / longitude grid). However, non-rectangular grids (e.g., icosahedral) and grids of variable resolution are more often used. The LMDz model can be arranged to give high resolution over any given section of the planet. HadGEM1 (and other ocean models) use an ocean grid with higher resolution in the tropics to help resolve processes believed to be important for the El Niño Southern Oscillation (ENSO). Spectral models generally use a gaussian grid, because of the mathematics of transformation between spectral and grid-point space. Typical AGCM resolutions are between 1 and 5 degrees in latitude or longitude: HadCM3, for example, uses 3.75 in longitude and 2.5 degrees in latitude, giving a grid of 96 by 73 points (96 x 72 for some variables); and has 19 vertical levels. This results in approximately 500,000 "basic" variables, since each grid point has four variables (u,v, T, Q), though a full count would give more (clouds; soil levels). HadGEM1 uses a grid of 1.875 degrees in longitude and 1.25 in latitude in the atmosphere; HiGEM, a high-resolution variant, uses 1.25 x 0.83 degrees respectively. These resolutions are lower than is typically used for weather forecasting. Ocean resolutions tend to be higher, for example HadCM3 has 6 ocean grid points per atmospheric grid point in the horizontal.

For a standard finite difference model, uniform gridlines converge towards the poles. This would lead to computational instabilities (see CFL condition) and so the model variables must be filtered along lines of latitude close to the poles. Ocean models suffer from this problem too, unless a rotated grid is used in which the North Pole is shifted onto a nearby landmass. Spectral models do not suffer from this problem. Some experiments use geodesic grids and icosahedral grids, which (being more uniform) do not have pole-problems. Another approach to solving the grid spacing problem is to deform a Cartesian cube such that it covers the surface of a sphere.

Flux buffering

Some early versions of AOGCMs required an ad hoc process of "flux correction" to achieve a stable climate. This resulted from separately prepared ocean and atmospheric models that each used an implicit flux from the other component different than that component could produce. Such a model failed to match observations. However, if the fluxes were 'corrected', the factors that led to these unrealistic fluxes might be unrecognised, which could affect model sensitivity. As a result, the vast majority of models used in the current round of IPCC reports do not use them. The model improvements that now make flux corrections unnecessary include improved ocean physics, improved resolution in both atmosphere and ocean, and more physically consistent coupling between atmosphere and ocean submodels. Improved models now maintain stable, multi-century simulations of surface climate that are considered to be of sufficient quality to allow their use for climate projections.

Convection

Moist convection releases latent heat and is important to the Earth's energy budget. Convection occurs on too small a scale to be resolved by climate models, and hence it must be handled via parameters. This has been done since the 1950s. Akio Arakawa did much of the early work, and variants of his scheme are still used, although a variety of different schemes are now in use. Clouds are also typically handled with a parameter, for a similar lack of scale. Limited understanding of clouds has limited the success of this strategy, but not due to some inherent shortcoming of the method.

Software

Most models include software to diagnose a wide range of variables for comparison with observations or study of atmospheric processes. An example is the 2-metre temperature, which is the standard height for near-surface observations of air temperature. This temperature is not directly predicted from the model but is deduced from surface and lowest-model-layer temperatures. Other software is used for creating plots and animations.

Projections

Projected annual mean surface air temperature from 1970-2100, based on SRES emissions scenario A1B, using the NOAA GFDL CM2.1 climate model (credit: NOAA Geophysical Fluid Dynamics Laboratory).

Coupled AOGCMs use transient climate simulations to project/predict climate changes under various scenarios. These can be idealised scenarios (most commonly, CO2 emissions increasing at 1%/yr) or based on recent history (usually the "IS92a" or more recently the SRES scenarios). Which scenarios are most realistic remains uncertain.

The 2001 IPCC Third Assessment Report Figure 9.3 shows the global mean response of 19 different coupled models to an idealised experiment in which emissions increased at 1% per year. Figure 9.5 shows the response of a smaller number of models to more recent trends. For the 7 climate models shown there, the temperature change to 2100 varies from 2 to 4.5 °C with a median of about 3 °C.

Future scenarios do not include unknown events – for example, volcanic eruptions or changes in solar forcing. These effects are believed to be small in comparison to greenhouse gas (GHG) forcing in the long term, but large volcanic eruptions, for example, can exert a substantial temporary cooling effect.

Human GHG emissions are a model input, although it is possible to include an economic/technological submodel to provide these as well. Atmospheric GHG levels are usually supplied as an input, though it is possible to include a carbon cycle model that reflects vegetation and oceanic processes to calculate such levels.

Emissions scenarios

In the 21st century, changes in global mean temperature are projected to vary across the world
Projected change in annual mean surface air temperature from the late 20th century to the middle 21st century, based on SRES emissions scenario A1B (credit: NOAA Geophysical Fluid Dynamics Laboratory).

For the six SRES marker scenarios, IPCC (2007:7–8) gave a "best estimate" of global mean temperature increase (2090–2099 relative to the period 1980–1999) of 1.8 °C to 4.0 °C. Over the same time period, the "likely" range (greater than 66% probability, based on expert judgement) for these scenarios was for a global mean temperature increase of 1.1 to 6.4 °C.

In 2008 a study made climate projections using several emission scenarios. In a scenario where global emissions start to decrease by 2010 and then declined at a sustained rate of 3% per year, the likely global average temperature increase was predicted to be 1.7 °C above pre-industrial levels by 2050, rising to around 2 °C by 2100. In a projection designed to simulate a future where no efforts are made to reduce global emissions, the likely rise in global average temperature was predicted to be 5.5 °C by 2100. A rise as high as 7 °C was thought possible, although less likely.

Another no-reduction scenario resulted in a median warming over land (2090–99 relative to the period 1980–99) of 5.1 °C. Under the same emissions scenario but with a different model, the predicted median warming was 4.1 °C.

Model accuracy

SST errors in HadCM3
 
North American precipitation from various models
 
Temperature predictions from some climate models assuming the SRES A2 emissions scenario

AOGCMs internalise as many processes as are sufficiently understood. However, they are still under development and significant uncertainties remain. They may be coupled to models of other processes in Earth system models, such as the carbon cycle, so as to better model feedbacks. Most recent simulations show "plausible" agreement with the measured temperature anomalies over the past 150 years, when driven by observed changes in greenhouse gases and aerosols. Agreement improves by including both natural and anthropogenic forcings.

Imperfect models may nevertheless produce useful results. GCMs are capable of reproducing the general features of the observed global temperature over the past century.

A debate over how to reconcile climate model predictions that upper air (tropospheric) warming should be greater than observed surface warming, some of which appeared to show otherwise, was resolved in favour of the models, following data revisions.

Cloud effects are a significant area of uncertainty in climate models. Clouds have competing effects on climate. They cool the surface by reflecting sunlight into space; they warm it by increasing the amount of infrared radiation transmitted from the atmosphere to the surface. In the 2001 IPCC report possible changes in cloud cover were highlighted as a major uncertainty in predicting climate.

Climate researchers around the world use climate models to understand the climate system. Thousands of papers have been published about model-based studies. Part of this research is to improve the models.

In 2000, a comparison between measurements and dozens of GCM simulations of ENSO-driven tropical precipitation, water vapor, temperature, and outgoing longwave radiation found similarity between measurements and simulation of most factors. However the simulated change in precipitation was about one-fourth less than what was observed. Errors in simulated precipitation imply errors in other processes, such as errors in the evaporation rate that provides moisture to create precipitation. The other possibility is that the satellite-based measurements are in error. Either indicates progress is required in order to monitor and predict such changes.

The precise magnitude of future changes in climate is still uncertain; for the end of the 21st century (2071 to 2100), for SRES scenario A2, the change of global average SAT change from AOGCMs compared with 1961 to 1990 is +3.0 °C (5.4 °F) and the range is +1.3 to +4.5 °C (+2.3 to 8.1 °F).

The IPCC's Fifth Assessment Report asserted "very high confidence that models reproduce the general features of the global-scale annual mean surface temperature increase over the historical period". However, the report also observed that the rate of warming over the period 1998–2012 was lower than that predicted by 111 out of 114 Coupled Model Intercomparison Project climate models.

Relation to weather forecasting

The global climate models used for climate projections are similar in structure to (and often share computer code with) numerical models for weather prediction, but are nonetheless logically distinct.

Most weather forecasting is done on the basis of interpreting numerical model results. Since forecasts are typically a few days or a week and sea surface temperatures change relatively slowly, such models do not usually contain an ocean model but rely on imposed SSTs. They also require accurate initial conditions to begin the forecast – typically these are taken from the output of a previous forecast, blended with observations. Weather predictions are required at higher temporal resolutions than climate projections, often sub-hourly compared to monthly or yearly averages for climate. However, because weather forecasts only cover around 10 days the models can also be run at higher vertical and horizontal resolutions than climate mode. Currently the ECMWF runs at 9 km (5.6 mi) resolution as opposed to the 100-to-200 km (62-to-124 mi) scale used by typical climate model runs. Often local models are run using global model results for boundary conditions, to achieve higher local resolution: for example, the Met Office runs a mesoscale model with an 11 km (6.8 mi) resolution covering the UK, and various agencies in the US employ models such as the NGM and NAM models. Like most global numerical weather prediction models such as the GFS, global climate models are often spectral models instead of grid models. Spectral models are often used for global models because some computations in modeling can be performed faster, thus reducing run times.

Computations

Climate models use quantitative methods to simulate the interactions of the atmosphere, oceans, land surface and ice.

All climate models take account of incoming energy as short wave electromagnetic radiation, chiefly visible and short-wave (near) infrared, as well as outgoing energy as long wave (far) infrared electromagnetic radiation from the earth. Any imbalance results in a change in temperature.

The most talked-about models of recent years relate temperature to emissions of greenhouse gases. These models project an upward trend in the surface temperature record, as well as a more rapid increase in temperature at higher altitudes.

Three (or more properly, four since time is also considered) dimensional GCM's discretise the equations for fluid motion and energy transfer and integrate these over time. They also contain parametrisations for processes such as convection that occur on scales too small to be resolved directly.

Atmospheric GCMs (AGCMs) model the atmosphere and impose sea surface temperatures as boundary conditions. Coupled atmosphere-ocean GCMs (AOGCMs, e.g. HadCM3, EdGCM, GFDL CM2.X, ARPEGE-Climate) combine the two models.

Models range in complexity:

  • A simple radiant heat transfer model treats the earth as a single point and averages outgoing energy
  • This can be expanded vertically (radiative-convective models), or horizontally
  • Finally, (coupled) atmosphere–ocean–sea ice global climate models discretise and solve the full equations for mass and energy transfer and radiant exchange.
  • Box models treat flows across and within ocean basins.

Other submodels can be interlinked, such as land use, allowing researchers to predict the interaction between climate and ecosystems.

Comparison with other climate models

Earth-system models of intermediate complexity (EMICs)

The Climber-3 model uses a 2.5-dimensional statistical-dynamical model with 7.5° × 22.5° resolution and time step of 1/2 a day. An oceanic submodel is MOM-3 (Modular Ocean Model) with a 3.75° × 3.75° grid and 24 vertical levels.

Radiative-convective models (RCM)

One-dimensional, radiative-convective models were used to verify basic climate assumptions in the 1980s and 1990s.

Earth system models

GCMs can form part of Earth system models, e.g. by coupling ice sheet models for the dynamics of the Greenland and Antarctic ice sheets, and one or more chemical transport models (CTMs) for species important to climate. Thus a carbon chemistry transport model may allow a GCM to better predict anthropogenic changes in carbon dioxide concentrations. In addition, this approach allows accounting for inter-system feedback: e.g. chemistry-climate models allow the effects of climate change on the ozone hole to be studied.

Climate model

From Wikipedia, the free encyclopedia

Climate models are systems of differential equations based on the basic laws of physics, fluid motion, and chemistry. To “run” a model, scientists divide the planet into a 3-dimensional grid, apply the basic equations, and evaluate the results. Atmospheric models calculate winds, heat transfer, radiation, relative humidity, and surface hydrology within each grid and evaluate interactions with neighboring points.

Numerical climate models use quantitative methods to simulate the interactions of the important drivers of climate, including atmosphere, oceans, land surface and ice. They are used for a variety of purposes from study of the dynamics of the climate system to projections of future climate. Climate models may also be qualitative (i.e. not numerical) models and also narratives, largely descriptive, of possible futures.

Quantitative climate models take account of incoming energy from the sun as short wave electromagnetic radiation, chiefly visible and short-wave (near) infrared, as well as outgoing long wave (far) infrared electromagnetic. Any imbalance results in a change in temperature.

Quantitative models vary in complexity:

  • A simple radiant heat transfer model treats the earth as a single point and averages outgoing energy. This can be expanded vertically (radiative-convective models) and/or horizontally
  • Finally, (coupled) atmosphere–ocean–sea ice global climate models solve the full equations for mass and energy transfer and radiant exchange.
  • Other types of modelling can be interlinked, such as land use, in Earth System Models, allowing researchers to predict the interaction between climate and ecosystems.

Box models

Schematic of a simple box model used to illustrate fluxes in geochemical cycles, showing a source (Q), sink (S) and reservoir (M)

Box models are simplified versions of complex systems, reducing them to boxes (or reservoirs) linked by fluxes. The boxes are assumed to be mixed homogeneously. Within a given box, the concentration of any chemical species is therefore uniform. However, the abundance of a species within a given box may vary as a function of time due to the input to (or loss from) the box or due to the production, consumption or decay of this species within the box.

Simple box models, i.e. box model with a small number of boxes whose properties (e.g. their volume) do not change with time, are often useful to derive analytical formulas describing the dynamics and steady-state abundance of a species. More complex box models are usually solved using numerical techniques.

Box models are used extensively to model environmental systems or ecosystems and in studies of ocean circulation and the carbon cycle. They are instances of a multi-compartment model.

Zero-dimensional models

A very simple model of the radiative equilibrium of the Earth is

where

  • the left hand side represents the incoming energy from the Sun
  • the right hand side represents the outgoing energy from the Earth, calculated from the Stefan-Boltzmann law assuming a model-fictive temperature, T, sometimes called the 'equilibrium temperature of the Earth', that is to be found,

and

  • S is the solar constant – the incoming solar radiation per unit area—about 1367 W·m−2
  • is the Earth's average albedo, measured to be 0.3.
  • r is Earth's radius—approximately 6.371×10⁶m
  • π is the mathematical constant (3.141...)
  • is the Stefan-Boltzmann constant—approximately 5.67×10⁻⁸ J·K−4·m−2·s−1
  • is the effective emissivity of earth, about 0.612

The constant πr2 can be factored out, giving

Solving for the temperature,

This yields an apparent effective average earth temperature of 288 K (15 °C; 59 °F). This is because the above equation represents the effective radiative temperature of the Earth (including the clouds and atmosphere).

This very simple model is quite instructive. For example, it easily determines the effect on average earth temperature of changes in solar constant or change of albedo or effective earth emissivity.

The average emissivity of the earth is readily estimated from available data. The emissivities of terrestrial surfaces are all in the range of 0.96 to 0.99 (except for some small desert areas which may be as low as 0.7). Clouds, however, which cover about half of the earth's surface, have an average emissivity of about 0.5 (which must be reduced by the fourth power of the ratio of cloud absolute temperature to average earth absolute temperature) and an average cloud temperature of about 258 K (−15 °C; 5 °F). Taking all this properly into account results in an effective earth emissivity of about 0.64 (earth average temperature 285 K (12 °C; 53 °F)).

This simple model readily determines the effect of changes in solar output or change of earth albedo or effective earth emissivity on average earth temperature. It says nothing, however about what might cause these things to change. Zero-dimensional models do not address the temperature distribution on the earth or the factors that move energy about the earth.

Radiative-convective models

The zero-dimensional model above, using the solar constant and given average earth temperature, determines the effective earth emissivity of long wave radiation emitted to space. This can be refined in the vertical to a one-dimensional radiative-convective model, which considers two processes of energy transport:

  • upwelling and downwelling radiative transfer through atmospheric layers that both absorb and emit infrared radiation
  • upward transport of heat by convection (especially important in the lower troposphere).

The radiative-convective models have advantages over the simple model: they can determine the effects of varying greenhouse gas concentrations on effective emissivity and therefore the surface temperature. But added parameters are needed to determine local emissivity and albedo and address the factors that move energy about the earth.

Effect of ice-albedo feedback on global sensitivity in a one-dimensional radiative-convective climate model.

Higher-dimension models

The zero-dimensional model may be expanded to consider the energy transported horizontally in the atmosphere. This kind of model may well be zonally averaged. This model has the advantage of allowing a rational dependence of local albedo and emissivity on temperature – the poles can be allowed to be icy and the equator warm – but the lack of true dynamics means that horizontal transports have to be specified.

EMICs (Earth-system models of intermediate complexity)

Depending on the nature of questions asked and the pertinent time scales, there are, on the one extreme, conceptual, more inductive models, and, on the other extreme, general circulation models operating at the highest spatial and temporal resolution currently feasible. Models of intermediate complexity bridge the gap. One example is the Climber-3 model. Its atmosphere is a 2.5-dimensional statistical-dynamical model with 7.5° × 22.5° resolution and time step of half a day; the ocean is MOM-3 (Modular Ocean Model) with a 3.75° × 3.75° grid and 24 vertical levels.

GCMs (global climate models or general circulation models)

General Circulation Models (GCMs) discretise the equations for fluid motion and energy transfer and integrate these over time. Unlike simpler models, GCMs divide the atmosphere and/or oceans into grids of discrete "cells", which represent computational units. Unlike simpler models which make mixing assumptions, processes internal to a cell—such as convection—that occur on scales too small to be resolved directly are parameterised at the cell level, while other functions govern the interface between cells.

Atmospheric GCMs (AGCMs) model the atmosphere and impose sea surface temperatures as boundary conditions. Coupled atmosphere-ocean GCMs (AOGCMs, e.g. HadCM3, EdGCM, GFDL CM2.X, ARPEGE-Climat) combine the two models. The first general circulation climate model that combined both oceanic and atmospheric processes was developed in the late 1960s at the NOAA Geophysical Fluid Dynamics Laboratory AOGCMs represent the pinnacle of complexity in climate models and internalise as many processes as possible. However, they are still under development and uncertainties remain. They may be coupled to models of other processes, such as the carbon cycle, so as to better model feedback effects. Such integrated multi-system models are sometimes referred to as either "earth system models" or "global climate models."

Research and development

There are three major types of institution where climate models are developed, implemented and used:

The World Climate Research Programme (WCRP), hosted by the World Meteorological Organization (WMO), coordinates research activities on climate modelling worldwide.

A 2012 U.S. National Research Council report discussed how the large and diverse U.S. climate modeling enterprise could evolve to become more unified. Efficiencies could be gained by developing a common software infrastructure shared by all U.S. climate researchers, and holding an annual climate modeling forum, the report found.

Liberal feminism

From Wikipedia, the free encyclopedia ...