The history of paleontology in the United States refers to the developments and discoveries regarding fossils found within or by people from the United States of America. Local paleontology began informally with Native Americans, who have been familiar with fossils for thousands of years. They both told myths about them and applied them to practical purposes. African slaves also contributed their knowledge; the first reasonably accurate recorded identification of vertebrate fossils in the new world was made by slaves on a South Carolina plantation who recognized the elephant affinities of mammoth molars uncovered there in 1725. The first major fossil discovery to attract the attention of formally trained scientists were the Ice Age fossils of Kentucky's Big Bone Lick. These fossils were studied by eminent intellectuals like France's George Cuvier and local statesmen and frontiersman like Daniel Boone, Benjamin Franklin, William Henry Harrison, Thomas Jefferson, and George Washington. By the end of the 18th century possible dinosaur fossils had already been found.
By the beginning of the 19th, their fossil footprints definitely had. Later in the century as more dinosaur fossils were uncovered eminent paleontologists Edward Drinker Cope and Othniel Charles Marsh were embroiled in a bitter rivalry to collect the most fossils and name the most new prehistoric species. Early in the 20th century major finds continued, like the Ice Age mammals of the La Brea Tar Pits, the Oligocene bonebeds of South Dakota, and the Triassic bonebeds of New Mexico. Mid-to-late twentieth century discoveries in the United States triggered the Dinosaur Renaissance as the discovery of the bird-like Deinonychus overturned misguided notions of dinosaurs as plodding lizard-like animals, cemented their sophisticated physiology and relationship with birds. Other notable finds include Maiasaura, which provided early evidence for parental care in dinosaurs and "Seismosaurus" the largest known dinosaur.
Indigenous interpretations
The indigenous people of the United States interpreted the fossil record through a mythological lens. Some of the tactics they used to understand the fossil record were nevertheless similar to scientific approaches. Native American fossil legends often derived from observation and rational speculation based on fossil finds. The indigenous people of the United States also frequently attempted to verify and modify interpretations of the fossil record in order to make sense of new discoveries. Although imperfect, Native American oral histories can preserve accurate information for extended periods of time. Since contact with Europeans, the ensuing epidemics, colonial violence, the Indian Wars, and forced displacement of Native peoples to reservations has resulted in the loss of much of their fossil-related culture.[2] According to folklorist Adrienne Mayor, a common theme in indigenous American fossil legends is "the eternal struggle for natural balance among earth, water and sky forces". Indigenous fossil legends also frequently show motifs resembling major themes in scientific paleontology like deep time, extinction, change over time and relationships between different life forms. Fossils have been used by Native Americans for evidence about the past, healing, personal protection, and trade. Fossil sites were often chosen as the setting of vision quests. Modern Comanche in Oklahoma still use dinosaur and mammoth bones for medicinal purposes.
18th century
The first reasonably correct identification of a vertebrate fossil in North America was made in 1725, at a South Carolina plantation called Stono. There slaves had uncovered several large fossil teeth while digging in a swamp. The slaves unanimously identified the teeth as elephant molars, which they would have recognized from life in Africa. In the early 19th century, Georges Cuvier authored an 1806 translated account of the discovery at Stono. He remarked that the African slaves understood the similarity between mammoth remains and elephants before European naturalists.
The first major vertebrate fossil discovery in North America to attract the attention of formally trainer scientists occurred just a few decades later. In July 1739 a French military expedition comprising 123 French soldiers and 319 Native American warriors left Quebec under the command of Charles III Le Moyne (2nd Baron Charles de Longueuil) to help defend New Orleans from the Chickasaw, who were attacking the city on behalf of England. While on their journey down the Ohio River towards the Mississippi, they camped in what is now Kentucky. Some of the expedition's Native members formed a hunting party and embarked to acquire that evening's meal. When they returned that evening their canoes were laden with massive fossils including long tusks, massive teeth, and a thighbone almost as tall as a person. The source of their fossils was the site now known as Big Bone Lick.
Near the end of 1740, Baron Charles de Longueuil departed from New Orleans to France, carrying with him fossils from Big Bone Lick. Longueuil left the remains at the Cabinet du Roi. This Cabinet du Roi (not to be confused with the administration personnel cabinet of the same name) was a collection of curiosities stored in the chateau of the king's botanical garden (which is nowadays the Jardin des plantes, in Paris, main seat of the French National Museum of Natural History). These fossils were first speculated on by eminent French scientists like Jean-Etienne Guettard and Georges Cuvier. A few years later, in 1762, Louis Daubenton read his paper before the French Royal Academy of Science showing that the bones and tusks belonged to an elephant-like species and that the teeth belonged to some kind of carnivorous hippopotamus. In fact the teeth belonged to the same individual, in the present day identified as an American mastodon (Mammut americanum).
In 1767 George Crogan (an Indian agent) sent several fossils from Big Bone Lick to Benjamin Franklin. Benjamin Franklin wrote back to express his amazement that the tusks resembled those of an elephant, yet the molars resembled those of a carnivorous animal. Franklin also wondered at the fact that the elephant-like fossils of Big Bone Lick were found in places so much colder than places modern elephants live. He speculated that maybe earth was in a different position in the past and its climate correspondingly different. Soon after the fossils attracted the attention of other major American figures like George Washington, Thomas Jefferson, Daniel Boone, William Henry Harrison, and James Taylor. The mammoth quickly became a symbol of American patriotism and equality with the Old World.
One of the earliest notable events in American dinosaur paleontology occurred on October 5, 1787. Caspar Wistar and Timothy Matlack gave a presentation to the American Philosophical Society in Philadelphia regarding "'a large thigh bone'" from some mysterious ancient creature found in Late Cretaceous rocks near Woodbury Creek, New Jersey. Modern scientist suspect this bone was actually a metatarsal from a duck-billed dinosaur, which are known from the same sediments.
19th century
Among the earliest major fossil discoveries in America occurred in Massachusetts during the spring of 1802. At that time a boy uncovered a piece of reddish sandstone with bird-like three toed footprints while ploughing on his father's farm in South Hadley. This was the first recorded dinosaur footprint discovery in North America. A short while later, Lewis and Clark expedition of 1804 through 1806 made several fossil discoveries along its journey, including the first documented fossils from what is now North Dakota. However, only a fish jawbone from Iowa remains of the fossils they collected along the way. Another significant, but unrelated event from the early 19th century was the 1817 organization of the Lyceum of Natural History of New York by Samuel L. Mitchill. In 1869 the American Museum of Natural History was organized out of the Lyceum.
During the Late 1830s Increase Allen Lapham found a variety of fossils in great abundance in some rocky hills near Milwaukee. Lapham sent a sizable sampling of the local fossils to James Hall of New York in 1846. Hall began researching the area and in 1862 recognized the local reefs for what they were. The Silurian-aged reefs of the Milwaukee area were the first Paleozoic reefs in the world to be described for the scientific literature.
In 1835 another major dinosaur track find occurred in Massachusetts. The town of Greenfield was paving its streets when residents noticed fossil footprints on the sandstone slabs that resembled turkey tracks. These rocks were taken from what would turn out to be the most productive dinosaur tracksite in the Connecticut Valley. Later that year, word of the find reached Amherst College geology professor Edward Hitchcock. Hitchcock spent the rest of the summer traveling through the Connecticut Valley examining the fossil footprints. The next year Hitchcock wrote a scientific paper on the fossil footprints of the Connecticut Valley. He thought the tracks were made by giant birds. In 1858, Hitchcock published again on the Connecticut Valley fossil footprints and still thought of them as bird tracks.
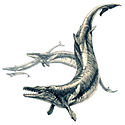
In 1842, fossils were found on a plantation owned by a man named Judge Creagh. Local doctors identified the fossils as belonging to an ancient marine reptile, and called it Basilosaurus. However, some of the fossils were shipped to Sir Richard Owen in England. After examining the remains Owen realized the bones actually belonged to a whale, rather than a reptile. Herman Melville's narrator Ishmael gives an account of the discovery in chapters 104–105 of Moby-Dick (1851).
In 1853 the Pacific Railroad Exploration survey became the first to document Arizona's petrified forest. In 1900 the United States Geological Survey dedicated a report to the petrified forest and encouraged swift action to preserve the spectacular fossils before curiosity seekers removed them all. In 1906, protective action was taken and Petrified Forest officially became a national monument.
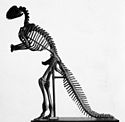
In 1858 the United States was home to the world's first "reasonably complete" dinosaur skeleton. A member of the Academy of Natural Sciences named William Foulke heard about fossil bones that had been found on a local farm while spending the summer in Haddonfield. That fall Foulke hired a team to reopen the marl pit the bones had been taken from. Roughly 10 feet down they found bones. Paleontologist Joseph Leidy later formally described the fossils. He interpreted the fossils as the remains of a bipedal amphibious reptile that had been swept out to sea by the river it lived alongside. Leidy called the creature Hadrosaurus foulkii after Foulke. A decade later, in 1868 Leidy worked with artist Benjamin Waterhouse Hawkins to mount Hadrosaurus foulkii for the Academy of Natural Sciences of Philadelphia. This became both the first mounted dinosaur skeleton ever mounted for public display but also one of the most popular exhibits in the history of the Academy. Estimates have the Hadrosaurus exhibit as increasing the number of visitors by up to 50%.
The year after the Hadrosaurus's fossils were first identified, 1859, state agricultural chemist Philip T. Tyson found the first documented dinosaur fossils of the Arundel Formation in an iron pit at Bladensburg, Maryland. The discovery consisted of two fossil teeth. Tyson took the dinosaur teeth to a local doctor named Christopher Johnston. Johnston cut thin sections of one tooth to examine it under a microscope. Johnson named the teeth Astrodon. In 1865 Joseph Leidy formally named the species Astrodon johnstoni after Christopher Johnston. This represents the first formal naming of a sauropod species in North America.
Two years later a chance find would bring instant fame to the fossils of the John Day region of Oregon. In 1861, a company of soldiers arrived in Oregon's Fort Dalles after visiting the Crooked River region brought back fossil bones and teeth, among which was a well-preserved rhinoceros jaw. The pastor of the fort's Congregational church, Thomas Condon, happened to be a paleontology enthusiast. In 1862, some soldiers were dispatched with supplies to Harney Valley. Condon went along with them and prospected for fossils when the troops passed back through the Crooked River area. He went fossil collecting again in 1863 and found rich fossil deposits north of Picture Gorge in the John Day River Valley. He realized that he had stumbled on a find of major scientific importance. Since he himself had no scientific qualifications or references to use in identifying fossils, Condon sent some fossils to O. C. Marsh of Yale University. Marsh replied with a request for Condon to guide and expedition to the area in which he found the fossils. Condon obliged and over the ensuing years a series of fossil hunting expeditions ventured into the John Day fossil beds.
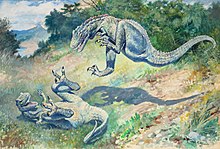
Later, 1866 dinosaur remains were found in a marl pit near Barnsboro owned by the Wet Jersey Marl Company. He called it Laelaps aquilunguis. Also that year, Cope gave Othniel Charles Marsh a tour of the marl pit where Laelaps was found. While there, Marsh secretly made arrangements with some of the workers for them to send any fossils they find to him at the Yale Peabody Museum instead of to Cope at the Academy of Natural Sciences of Philadelphia. This may have been the "first shot" of the Bone Wars, a bitter long-running feud between the two scientists.
The next year a United States army surgeon named Dr. Theophilus Turner found a nearly complete plesiosaur skeleton in what is now Logan County while stationed at Fort Wallace. This was the first plesiosaur specimen of this caliber found in all of North America. Dr. Turner gave some of the vertebrae to a member of the Union Pacific railroad survey, John LeConte. He in turn gave the bones to paleontologist Edward Drinker Cope, who identified them as the remains of a very large plesiosaur. Cope wrote a letter to Dr. Turner requesting that he send him the remainder of the skeleton. Turner obliged and in mid-March 1868 Cope received the remainder of the fossils. Within two weeks of receiving the specimen, Cope made a presentation at the March 24th meeting of the Academy of Natural Sciences in Philadelphia. He named the creature Elasmosaurus platyurus, although in his hasty work he mistakenly reconstructed it with its head at the end of the tail instead of its neck.
In 1869, excavation started at Gilboa Forest, an extraordinary collection of Devonian plants regarded as one of the first forests to ever exist. Excavation of the Gilboa petrified forest continued on into the early twentieth century, but by 1921 on-site field work had completed.
The next year, O. C. Marsh led a paleontological expedition into the western United States on behalf of Yale University. Late that November they visited the area around Fort Wallace. Among the fossils found by Marsh's crew in western Kansas were the far ends of two pterosaur wing metacarpals. These were the first scientifically documented fossils of the pterosaur that would later be named Pteranodon. This formal naming occurred six years later, in 1876.
In 1874 March's rival, Cope arrived at New Mexico accompanying the G. M. Wheeler Survey. While in the area he found the first known Eocene mammal from the southwestern United States, Coryphodon. In total he discovered about 90 species. This was a major boon to his reputation as his research was foundational to understanding that interval of American geologic history.
Around March 1877 a man named Oramel Lucas discovered sauropod bones in a valley called Garden Park located a few miles north of Canon City, Colorado. He wrote to both Cope and O. C. Marsh, the famous rival paleontologists of the bone wars to alert them about his discovery. Although Marsh never responded, Cope did, and Oramel Lucas and his brother Ira began digging up local fossils and sending them to Cope. By August of the same year, Cope had formally named the new species excavated by the Lucas brothers Camarasaurus supremus. Later, a crew working on behalf of O. C. Marsh under Mudge and Williston started a quarry nearby. They made several important finds like the new species Allosaurus fragilis and Diplodocus longus. Following the initial excavations in the quarry field work stopped until 1883. That year brothers Marshall and Henry Felch reopened excavations there, again on behalf of O. C. Marsh. They worked for five years collecting many dinosaurs already known from the formation, but also the new species Ceratosaurus nasicornis.
Beginning in 1877, the plentiful dinosaur remains preserved in Wyoming came to the attention of scientists. Three men played a pivotal early role in bringing scientific attention to the area's dinosaurs. These were Colorado School of Mines professor Arthur Lakes, teacher O. Lucas, and Union Pacific Railroad foreman William H. Reed. In March 1877, Reed noticed fossil limbs and vertebrae at Como Bluff. He spent several weeks collecting fossils with foreman William E. Carlin. In July, O. C. Marsh was informed of Reed and Carlin's fossil discoveries. Marsh hired both of them to acquire more local fossils for him. They continued collecting into early 1878, uncovering several Camarasaurus specimens, one being a new species, Camarasaurus grandis. Nearby they made another significant find, Dryolestes priscus, the first Jurassic mammal known from North America. From 1877 to 1878 Princeton also sent a massive expedition to Wyoming. Major participants included Henry Fairfield Osborn, W. E. Scott, and Thomas Speer. Also around this time, Samuel W. Williston began periodic excavations.
Late in 1877, Marsh's scientific rival Edward Drinker Cope heard that fossils had been found at Como Bluff. He quickly dispatched his own fossil hunters into the area. Reed described his struggles to keep Cope's men away from his own hunting grounds in regular correspondence with Marsh. William Carlin quit working for Marsh and ended up joining Cope's efforts in the region. Since Carlin was in charge of the railway's station house he used his influence to keep Reed out. Marsh hired additional help for Reed, but none of his workers stayed on the job long term. Reed was essentially on his own by the spring of 1879, working hectically at excavating several quarries at once to recover the fossils before Cope's men. In the middle of May that same year Marsh directed Arthur Lakes to leave the Morrison, Colorado area and assist Reed at Como Bluff. The partnership would be fruitful that year and several major discoveries happened. They found a ninth site early in July that would be the most productive of any fossil site in the Morrison Formation.
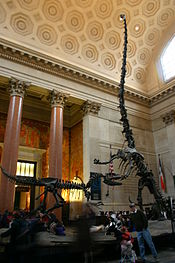
In September, they made another major discovery. By the end of the month, they had identified a new species of sauropod, Brontosaurus excelsus, that would end up mounted in the Yale Peabody Museum. This species has since been reclassified as Apatosaurus excelsus. In September they found a thirteenth quarry that produced more dinosaur skeletons than any of the others. Camptosaurus and Stegosaurus were the most common. New dinosaurs found here included Camarasaurus lentus, Camptosaurus dispar, and Coelurus fragilis. By June 1889, fieldwork at Como Bluff had concluded after twelve years. Marsh's fieldwork in the area uncovered the greatest abundance of Jurassic fossils known in the world at the time. By the 1918 conclusion of Samuel W. Williston's work in Wyoming hundreds of tons of dinosaur bones had been recovered from Wyoming rocks.
A major Cenozoic fossil find also happened in 1877. That year, a scout and rancher named Captain James H. Cook found a Miocene bonebed in Sioux County, Nebraska now known as the Agate Springs Quarries. These rich deposits are so dense with bones that single forty foot slab of sandstone preserved more than 4300 bones from at least 1700 individual animals. The total number of fossils preserved here may number in the millions. The tiny rhinoceras Diceratherium cooki composed about one quarter of the remains in the Agate Springs beds. This was the first paleontological discovery to attract public attention to the fossils of Nebraska.
In late 1887 Othniel Charles Marsh sent John Bell Hatcher to look for dinosaur remains in the Arundel Clay. While on this expedition, Hatcher found a fossiliferous iron mine on a farm near Muikirk, Maryland. Hatcher's excavation continued uncovering dinosaur fossils into the next year. Hatcher recovered hundreds of bones and teeth, which helped the region between Maryland and Washington D.C. become known as Dinosaur Alley.
20th century
Between 1906 and 1916 hundreds of thousands of Pleistocene fossils were uncovered in central Los Angeles. Just a few years after the La Brea tar pits were found, in 1908, paleontologist Earl Douglass was excavating fossils in Utah on behalf of the Carnegie Museum of Natural History. The director of the museum visited Douglass's camp that year and suggested that Douglass search for Jurassic dinosaur fossils in the Uinta Mountains north of his camp. Douglass agreed and they set off to the Uinta Mountains the next day. They found so many fossils that Douglas built a home near the Green River and his family moved in from Pittsburgh. He spent the rest of his career in the area excavating fossils. Among the local finds were Allosaurus, Apatosaurus, Barosaurus, Camarasaurus, Camptosaurus, Diplodocus, Dryosaurus, Stegosaurus. In 1915 US president Woodrow Wilson declared the quarry and surrounding land Dinosaur National Monument in order to protect it from settlement. Between 1909 and 1923 millions of tons of rocks and fossils had been excavated from the Dinosaur National Monument area.
In 1909 in paleontology Massachusetts paleontologist Mignon Talbot became the first woman elected to the Paleontological Society. In an unrelated east coast discovery of 1912, workers digging in a cave for a railroad construction project near Cumberland, Maryland in Allegany County uncovered many fossils in the course of their labor. However, eventually the scientific significance of the fossils was realized and paleontologist J. W. Gidley conducted fieldwork at the cave between 1912 and 1915. By 1938 report more than 50 different kinds of animals had been identified among the fossils.
In 1938, Barnum Brown of the American Museum of Natural History sent Roland T. Bird to Texas in search of dinosaur trackways reportedly uncovered by local moonshiners. At the town of Glen Rose local residents guided him to carnivorous dinosaur tracks preserved along the Paluxy River. While he was cleaning mud from these footprints, he noticed another kind of footprint, apparently left by a long-necked sauropod dinosaur. In 1940, Bird resumed his Texas fieldwork with the help of paleontologists from the Survey and labor employed by the Works Progress Administration.
Later, in 1940, the South Dakota School of Mines and Technology collaborated with National Geographic on an expedition into the badlands of South Dakota. They uncovered tons of fossils from at least 175 different species of Oligocene life. The fossils were taken to the South Dakota School of Mines in Rapid City. Among the mammal discoveries were the remains of rhinoceroses, tapirs, three-toed horses, pig-like animals, and rodents. In 1947 another major dinosaur discovery took place. An American Museum field party led by Edwin Harris Colbert found a bonebed including the skeletons of more than 1,000 Coelophysis at Ghost Ranch. Later, in 1953 University of New Mexico graduate student William Chenoweth found three important sites where dinosaurs were preserved in Morrison Formation rocks. He found a fragmentary Allosaurus, sauropods, and Stegosaurus.
The famous Montanan Tertiary deposits of the Ruby Valley basin were also first studied in 1947. The early research was performed by Dr. Herman F. Becker on behalf of the New York Botanical Garden. These deposits from the southwestern part of the state are one of the best sources of plant and insect fossils in North America. In 1959 Becker's Ruby Valley excavations uncovered about 5,000 specimens of more than two hundred species of plants, insects, and fishes. Invertebrate finds included ants, bees, beetles, earwigs, caddis flies, crane flies, damsel flies, lantern flies, may flies, grasshoppers, leaf hoppers, mosquitoes, snails, and wasps. Vertebrate remains included feathers, and, once in a while, a bird.
During the late 1950s Francis Tully found a fossil he could not identify at the strip mines near Braidwood, Illinois. He took the specimen to Chicago's Field Museum of Natural History. Researchers at the museum couldn't identify it either, and the specimen became known as Mr. Tully's monster. In 1966, Eugene Richardson, the Curator of Fossil Invertebrates of the Field Museum formally named the Tully monster Tullimonstrum gregarium in honor of Tully.
In 1964, John Ostrom led an expedition that included his student Robert T. Bakker into the south-central part of Montana. The rocks they prospected were of the Cloverly Formation, dating back to the Early Cretaceous. Among their finds were the first documented remains of a small carnivorous dinosaur that would be named Deinonychus antirrhopus. This discovery helped ignite the Dinosaur Renaissance. It exhibited important anatomical similarities to birds that helped scientists shed antiquated ideas interpreting dinosaurs as "overgrown lizards".
In Spring, 1965 a major discovery of Devonian fossils occurred in Cuyahoga County. A collaboration between the state Highway Department, Ohio Bureau of Public Roads and the Cleveland Museum of Natural History led by the Smithsonian's David Dunkle uncovered as many as 50,000 fish fossils from a construction site. By the ensuing November 120 or more different species had been found there, with half previously unknown to science. That same year, in an unrelated development, the Florissant fossil beds of Colorado were proposed as a potential federal preserve.
In 1978 paleontologist Bill Clemens alerted fellow paleontologists Jack Horner and Bob Makela to the presence of unidentified dinosaur fossils in Bynum, Montana. Horner visited the town and recognized the remains as belonging to a duck-billed dinosaur. While in town the owner of a local rock shop, Marion Brandvold, showed him some tiny bones. Horner identified them as baby duck-bill bones. Horner also knew that this was an important find and convinced Brandvold to donate her fossils to a museum. She obliged and gave them to Princeton University. Horner's team prospected in the area where Brandvold found the baby hadrosaur fossils. Their effort paid off with the discovery of the first scientifically documented dinosaur eggs of the Western Hemisphere and a new kind of duck-bill, Maiasaura peeblesorum.
The next year, 1979, two hikers found a series of gigantic articulated vertebrae fossils near San Ysidro. They reported the remains to David Gilette of the New Mexico Museum of Natural History. Gillette led an expedition into the region and used cutting edge technology to locate the remains while they were still entombed in sandstone. The team excavated a massive quarry and gradually recovered a significant portion of the rear half of a diplodocid sauropod dinosaur. In 1991 this dinosaur was formally described as the new genus Seismosaurus and estimated to be the longest dinosaur known to science at 52 meters (171 feet) long.
21st century
More recently, in the 2000s, Seismosaurus was found to be the same as Diplodocus, a previously known dinosaur of similar age from the western United States. Dinosaur fossils continue to be found in new locations within the United States. It was not until 2004 that any dinosaur fossils were reported from Louisiana. Currently, within the United States, dinosaur fossils are known from Alabama, Alaska, Arizona, Arkansas, California, Colorado, Connecticut, Delaware, Georgia, Idaho, Iowa, Kansas, Louisiana, Maryland, Massachusetts, Minnesota, Mississippi, Missouri, Montana, Nebraska, Nevada, New Jersey, New Mexico, New York, North Carolina, North Dakota, Oklahoma, Pennsylvania, South Carolina, South Dakota, Tennessee, Texas, Utah, Virginia, Washington, D.C., Washington and Wyoming, but not in Florida, Hawaii, Illinois, Indiana, Kentucky, Maine, Michigan, New Hampshire, Ohio, Oregon, Rhode Island, Vermont, West Virginia, or Wisconsin. Washington is the latest state to have found their first dinosaur bone, it was recovered in 2012 but was not publicly identified until May 21, 2015. Some states contain rocks of the appropriate type and age to preserve dinosaur fossils, so the list of states with known dinosaur fossils is likely to increase in the future.








![{\displaystyle B_{A}={\frac {[ABC]_{P}\cdot D_{IV}}{[ABC]_{IV}\cdot D_{P}}}}](https://wikimedia.org/api/rest_v1/media/math/render/svg/e0349b27d143a975c5e5c3eeaf83b49e8c7a3318)
![{\displaystyle {\mathit {B}}_{R}={\frac {[ABC]_{A}\cdot {\text{dose}}_{B}}{[ABC]_{B}\cdot {\text{dose}}_{A}}}}](https://wikimedia.org/api/rest_v1/media/math/render/svg/634ea7e9316eeae72a9904dcaf1ccb2c43511aaf)


