Search This Blog

Tuesday, August 9, 2022

Climate of the Arctic

From Wikipedia, the free encyclopedia
 
A map of the Arctic. The red line is the 10°C isotherm in July, commonly used to define the Arctic region; also shown is the Arctic Circle. The white area shows the average minimum extent of sea ice in summer as of 1975.

The climate of the Arctic is characterized by long, cold winters and short, cool summers. There is a large amount of variability in climate across the Arctic, but all regions experience extremes of solar radiation in both summer and winter. Some parts of the Arctic are covered by ice (sea ice, glacial ice, or snow) year-round, and nearly all parts of the Arctic experience long periods with some form of ice on the surface.

The Arctic consists of ocean that is largely surrounded by land. As such, the climate of much of the Arctic is moderated by the ocean water, which can never have a temperature below −2 °C (28 °F). In winter, this relatively warm water, even though covered by the polar ice pack, keeps the North Pole from being the coldest place in the Northern Hemisphere, and it is also part of the reason that Antarctica is so much colder than the Arctic. In summer, the presence of the nearby water keeps coastal areas from warming as much as they might otherwise.

Overview of the Arctic

There are different definitions of the Arctic. The most widely used definition, the area north of the Arctic Circle, where the sun does not set on the June Solstice, is used in astronomical and some geographical contexts. However the two most widely used definitions in the context of climate are the area north of the northern tree line, and the area in which the average summer temperature is less than 10 °C (50 °F), which are nearly coincident over most land areas (NSIDC).

The nations which comprise the Arctic region.

This definition of the Arctic can be further divided into four different regions:

Moving inland from the coast over mainland North America and Eurasia, the moderating influence of the Arctic Ocean quickly diminishes, and the climate transitions from the Arctic to subarctic, generally, in less than 500 kilometres (310 miles), and often over a much shorter distance.

History of Arctic climate observation

Due to the lack of major population centres in the Arctic, weather and climate observations from the region tend to be widely spaced and of short duration compared to the midlatitudes and tropics. Though the Vikings explored parts of the Arctic over a millennium ago, and small numbers of people have been living along the Arctic coast for much longer, scientific knowledge about the region was slow to develop; the large islands of Severnaya Zemlya, just north of the Taymyr Peninsula on the Russian mainland, were not discovered until 1913, and not mapped until the early 1930s. 

Early European exploration

Much of the historical exploration in the Arctic was motivated by the search for the Northwest and Northeast Passages. Sixteenth- and seventeenth-century expeditions were largely driven by traders in search of these shortcuts between the Atlantic and the Pacific. These forays into the Arctic did not venture far from the North American and Eurasian coasts, and were unsuccessful at finding a navigable route through either passage.

National and commercial expeditions continued to expand the detail on maps of the Arctic through the eighteenth century, but largely neglected other scientific observations. Expeditions from the 1760s to the middle of the 19th century were also led astray by attempts to sail north because of the belief by many at the time that the ocean surrounding the North Pole was ice-free. These early explorations did provide a sense of the sea ice conditions in the Arctic and occasionally some other climate-related information.

By the early 19th century some expeditions were making a point of collecting more detailed meteorological, oceanographic, and geomagnetic observations, but they remained sporadic. Beginning in the 1850s regular meteorological observations became more common in many countries, and the British navy implemented a system of detailed observation. As a result, expeditions from the second half of the nineteenth century began to provide a picture of the Arctic climate.

Early European observing efforts

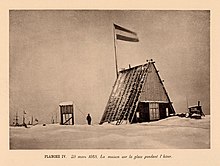
A photograph of the first-IPY station at the Kara Sea site in winter

The first major effort by Europeans to study the meteorology of the Arctic was the First International Polar Year (IPY) in 1882 to 1883. Eleven nations provided support to establish twelve observing stations around the Arctic. The observations were not as widespread or long-lasting as would be needed to describe the climate in detail, but they provided the first cohesive look at the Arctic weather.

In 1884 the wreckage of the Briya, a ship abandoned three years earlier off Russia's eastern Arctic coast, was found on the coast of Greenland. This caused Fridtjof Nansen to realize that the sea ice was moving from the Siberian side of the Arctic to the Atlantic side. He decided to use this motion by freezing a specially designed ship, the Fram, into the sea ice and allowing it to be carried across the ocean. Meteorological observations were collected from the ship during its crossing from September 1893 to August 1896. This expedition also provided valuable insight into the circulation of the ice surface of the Arctic Ocean.

In the early 1930s the first significant meteorological studies were carried out on the interior of the Greenland ice sheet. These provided knowledge of perhaps the most extreme climate of the Arctic, and also the first suggestion that the ice sheet lies in a depression of the bedrock below (now known to be caused by the weight of the ice itself).

Fifty years after the first IPY, in 1932 to 1933, a second IPY was organized. This one was larger than the first, with 94 meteorological stations, but World War II delayed or prevented the publication of much of the data collected during it. Another significant moment in Arctic observing before World War II occurred in 1937 when the USSR established the first of over 30 North-Pole drifting stations. This station, like the later ones, was established on a thick ice floe and drifted for almost a year, its crew observing the atmosphere and ocean along the way.

Cold-War era observations

Following World War II, the Arctic, lying between the USSR and North America, became a front line of the Cold War, inadvertently and significantly furthering our understanding of its climate. Between 1947 and 1957, the United States and Canadian governments established a chain of stations along the Arctic coast known as the Distant Early Warning Line (DEWLINE) to provide warning of a Soviet nuclear attack. Many of these stations also collected meteorological data.

The DEWLINE site at Point Lay, Alaska

The Soviet Union was also interested in the Arctic and established a significant presence there by continuing the North-Pole drifting stations. This program operated continuously, with 30 stations in the Arctic from 1950 to 1991. These stations collected data that are valuable to this day for understanding the climate of the Arctic Basin. This map shows the location of Arctic research facilities during the mid-1970s and the tracks of drifting stations between 1958 and 1975.

Another benefit from the Cold War was the acquisition of observations from United States and Soviet naval voyages into the Arctic. In 1958 an American nuclear submarine, the Nautilus was the first ship to reach the North Pole. In the decades that followed submarines regularly roamed under the Arctic sea ice, collecting sonar observations of the ice thickness and extent as they went. These data became available after the Cold War, and have provided evidence of thinning of the Arctic sea ice. The Soviet navy also operated in the Arctic, including a sailing of the nuclear-powered ice breaker Arktika to the North Pole in 1977, the first time a surface ship reached the pole.

Scientific expeditions to the Arctic also became more common during the Cold-War decades, sometimes benefiting logistically or financially from the military interest. In 1966 the first deep ice core in Greenland was drilled at Camp Century, providing a glimpse of climate through the last ice age. This record was lengthened in the early 1990s when two deeper cores were taken from near the center of the Greenland Ice Sheet. Beginning in 1979 the Arctic Ocean Buoy Program (the International Arctic Buoy Program since 1991) has been collecting meteorological and ice-drift data across the Arctic Ocean with a network of 20 to 30 buoys.

Satellite era

The end of the Soviet Union in 1991 led to a dramatic decrease in regular observations from the Arctic. The Russian government ended the system of drifting North Pole stations, and closed many of the surface stations in the Russian Arctic. Likewise the United States and Canadian governments cut back on spending for Arctic observing as the perceived need for the DEWLINE declined. As a result, the most complete collection of surface observations from the Arctic is for the period 1960 to 1990.

The extensive array of satellite-based remote-sensing instruments now in orbit has helped to replace some of the observations that were lost after the Cold War, and has provided coverage that was impossible without them. Routine satellite observations of the Arctic began in the early 1970s, expanding and improving ever since. A result of these observations is a thorough record of sea-ice extent in the Arctic since 1979; the decreasing extent seen in this record (NASA, NSIDC), and its possible link to anthropogenic global warming, has helped increase interest in the Arctic in recent years. Today's satellite instruments provide routine views of not only cloud, snow, and sea-ice conditions in the Arctic, but also of other, perhaps less-expected, variables, including surface and atmospheric temperatures, atmospheric moisture content, winds, and ozone concentration.

Civilian scientific research on the ground has certainly continued in the Arctic, and it is getting a boost from 2007 to 2009 as nations around the world increase spending on polar research as part of the third International Polar Year. During these two years thousands of scientists from over 60 nations will co-operate to carry out over 200 projects to learn about physical, biological, and social aspects of the Arctic and Antarctic (IPY).

Modern researchers in the Arctic also benefit from computer models. These pieces of software are sometimes relatively simple, but often become highly complex as scientists try to include more and more elements of the environment to make the results more realistic. The models, though imperfect, often provide valuable insight into climate-related questions that cannot be tested in the real world. They are also used to try to predict future climate and the effect that changes to the atmosphere caused by humans may have on the Arctic and beyond. Another interesting use of models has been to use them, along with historical data, to produce a best estimate of the weather conditions over the entire globe during the last 50 years, filling in regions where no observations were made (ECMWF). These reanalysis datasets help compensate for the lack of observations over the Arctic.

Solar radiation

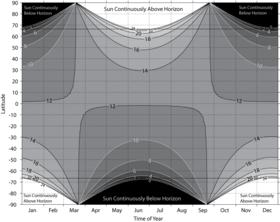
Variations in the length of the day with latitude and time of year. Atmospheric refraction makes the sun appear higher in the sky than it is geometrically, and therefore causes the extent of 24-hour day or night to differ slightly from the polar circles.
 
Variations in the duration of daylight with latitude and time of year. The smaller angle with which the sun intersects the horizon in the Polar regions, compared to the Tropics, leads to longer periods of twilight in the Polar regions, and accounts for the asymmetry of the plot.

Almost all of the energy available to the Earth's surface and atmosphere comes from the sun in the form of solar radiation (light from the sun, including invisible ultraviolet and infrared light). Variations in the amount of solar radiation reaching different parts of the Earth are a principal driver of global and regional climate. Latitude is the most important factor determining the yearly average amount of solar radiation reaching the top of the atmosphere; the incident solar radiation decreases smoothly from the Equator to the poles. Therefore, temperature tends to decrease with increasing latitude.

In addition the length of each day, which is determined by the season, has a significant impact on the climate. The 24-hour days found near the poles in summer result in a large daily-average solar flux reaching the top of the atmosphere in these regions. On the June solstice 36% more solar radiation reaches the top of the atmosphere over the course of the day at the North Pole than at the Equator. However, in the six months from the September equinox to March equinox the North Pole receives no sunlight.

The climate of the Arctic also depends on the amount of sunlight reaching the surface, and being absorbed by the surface. Variations in cloud cover can cause significant variations in the amount of solar radiation reaching the surface at locations with the same latitude. Differences in surface albedo due for example to presence or absence of snow and ice strongly affect the fraction of the solar radiation reaching the surface that is reflected rather than absorbed.

Winter

During the winter months of November through February, the sun remains very low in the sky in the Arctic or does not rise at all. Where it does rise, the days are short, and the sun's low position in the sky means that, even at noon, not much energy is reaching the surface. Furthermore, most of the small amount of solar radiation that reaches the surface is reflected away by the bright snow cover. Cold snow reflects between 70% and 90% of the solar radiation that reaches it, and snow covers most of the Arctic land and ice surface in winter. These factors result in a negligible input of solar energy to the Arctic in winter; the only things keeping the Arctic from continuously cooling all winter are the transport of warmer air and ocean water into the Arctic from the south and the transfer of heat from the subsurface land and ocean (both of which gain heat in summer and release it in winter) to the surface and atmosphere.

Spring

Arctic days lengthen rapidly in March and April, and the sun rises higher in the sky, both bringing more solar radiation to the Arctic than in winter. During these early months of Northern Hemisphere spring most of the Arctic is still experiencing winter conditions, but with the addition of sunlight. The continued low temperatures, and the persisting white snow cover, mean that this additional energy reaching the Arctic from the sun is slow to have a significant impact because it is mostly reflected away without warming the surface. By May, temperatures are rising, as 24-hour daylight reaches many areas, but most of the Arctic is still snow-covered, so the Arctic surface reflects more than 70% of the sun's energy that reaches it over all areas but the Norwegian Sea and southern Bering Sea, where the ocean is ice free, and some of the land areas adjacent to these seas, where the moderating influence of the open water helps melt the snow early.

In most of the Arctic the significant snow melt begins in late May or sometime in June. This begins a feedback, as melting snow reflects less solar radiation (50% to 60%) than dry snow, allowing more energy to be absorbed and the melting to take place faster. As the snow disappears on land, the underlying surfaces absorb even more energy, and begin to warm rapidly.

Summer

At the North Pole on the June solstice, around 21 June, the sun circles at 23.5° above the horizon. This marks noon in the Pole's year-long day; from then until the September equinox, the sun will slowly approach nearer and nearer the horizon, offering less and less solar radiation to the Pole. This period of setting sun also roughly corresponds to summer in the Arctic.

This photograph, from a plane, shows a section of sea ice. The lighter blue areas are melt ponds, and the darkest areas are open water.

As the Arctic continues receiving energy from the sun during this time, the land, which is mostly free of snow by now, can warm up on clear days when the wind is not coming from the cold ocean. Over the Arctic Ocean the snow cover on the sea ice disappears and ponds of melt water start to form on the sea ice, further reducing the amount of sunlight the ice reflects and helping more ice melt. Around the edges of the Arctic Ocean the ice will melt and break up, exposing the ocean water, which absorbs almost all of the solar radiation that reaches it, storing the energy in the water column. By July and August, most of the land is bare and absorbs more than 80% of the sun's energy that reaches the surface. Where sea ice remains, in the central Arctic Basin and the straits between the islands in the Canadian Archipelago, the many melt ponds and lack of snow cause about half of the sun's energy to be absorbed, but this mostly goes toward melting ice since the ice surface cannot warm above freezing.

Frequent cloud cover, exceeding 80% frequency over much of the Arctic Ocean in July, reduces the amount of solar radiation that reaches the surface by reflecting much of it before it gets to the surface. Unusual clear periods can lead to increased sea-ice melt or higher temperatures (NSIDC).

Greenland: The interior of Greenland differs from the rest of the Arctic. Low spring and summer cloud frequency and the high elevation, which reduces the amount of solar radiation absorbed or scattered by the atmosphere, combine to give this region the most incoming solar radiation at the surface out of anywhere in the Arctic. However, the high elevation, and corresponding lower temperatures, help keep the bright snow from melting, limiting the warming effect of all this solar radiation.

In the summer, when the snow melts, Inuit live in tent-like huts made out of animal skins stretched over a frame.

Autumn

In September and October the days get rapidly shorter, and in northern areas the sun disappears from the sky entirely. As the amount of solar radiation available to the surface rapidly decreases, the temperatures follow suit. The sea ice begins to refreeze, and eventually gets a fresh snow cover, causing it to reflect even more of the dwindling amount of sunlight reaching it. Likewise, in the beginning of September both the northern and southern land areas receive their winter snow cover, which combined with the reduced solar radiation at the surface, ensures an end to the warm days those areas may experience in summer. By November, winter is in full swing in most of the Arctic, and the small amount of solar radiation still reaching the region does not play a significant role in its climate.

Temperature

Average January temperature in the Arctic
 
Average July temperature in the Arctic

The Arctic is often perceived as a region stuck in a permanent deep freeze. While much of the region does experience very low temperatures, there is considerable variability with both location and season. Winter temperatures average below freezing over all of the Arctic except for small regions in the southern Norwegian and Bering Seas, which remain ice free throughout the winter. Average temperatures in summer are above freezing over all regions except the central Arctic Basin, where sea ice survives through the summer, and interior Greenland.

The maps on the right show the average temperature over the Arctic in January and July, generally the coldest and warmest months. These maps were made with data from the NCEP/NCAR Reanalysis, which incorporates available data into a computer model to create a consistent global data set. Neither the models nor the data are perfect, so these maps may differ from other estimates of surface temperatures; in particular, most Arctic climatologies show temperatures over the central Arctic Ocean in July averaging just below freezing, a few degrees lower than these maps show (USSR, 1985). An earlier climatology of temperatures in the Arctic, based entirely on available data, is shown in this map from the CIA Polar Regions Atlas.

Record low temperatures in the Northern Hemisphere

The coldest location in the Northern Hemisphere is not in the Arctic, but rather in the interior of Russia's Far East, in the upper-right quadrant of the maps. This is due to the region's continental climate, far from the moderating influence of the ocean, and to the valleys in the region that can trap cold, dense air and create strong temperature inversions, where the temperature increases, rather than decreases, with height. The lowest officially recorded temperature in the Northern Hemisphere is −67.7 °C (−89.9 °F) which occurred in Oymyakon on 6 February 1933, as well as in Verkhoyansk on 5 and 7 February 1892, respectively. However, this region is not part of the Arctic because its continental climate also allows it to have warm summers, with an average July temperature of 15 °C (59 °F). In the figure below showing station climatologies, the plot for Yakutsk is representative of this part of the Far East; Yakutsk has a slightly less extreme climate than Verkhoyansk.

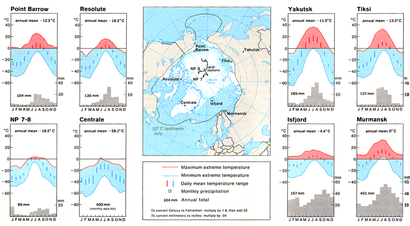
Monthly and annual climatologies of eight locations in the Arctic and sub-Arctic

Arctic Basin

The Arctic Basin is typically covered by sea ice year round, which strongly influences its summer temperatures. It also experiences the longest period without sunlight of any part of the Arctic, and the longest period of continuous sunlight, though the frequent cloudiness in summer reduces the importance of this solar radiation.

Despite its location centered on the North Pole, and the long period of darkness this brings, this is not the coldest part of the Arctic. In winter, the heat transferred from the −2 °C (28 °F) water through cracks in the ice and areas of open water helps to moderate the climate some, keeping average winter temperatures around −30 to −35 °C (−22 to −31 °F). Minimum temperatures in this region in winter are around −50 °C (−58 °F).

In summer, the sea ice keeps the surface from warming above freezing. Sea ice is mostly fresh water since the salt is rejected by the ice as it forms, so the melting ice has a temperature of 0 °C (32 °F), and any extra energy from the sun goes to melting more ice, not to warming the surface. Air temperatures, at the standard measuring height of about 2 meters above the surface, can rise a few degrees above freezing between late May and September, though they tend to be within a degree of freezing, with very little variability during the height of the melt season.

In the figure above showing station climatologies, the lower-left plot, for NP 7–8, is representative of conditions over the Arctic Basin. This plot shows data from the Soviet North Pole drifting stations, numbers 7 and 8. It shows the average temperature in the coldest months is in the −30s, and the temperature rises rapidly from April to May; July is the warmest month, and the narrowing of the maximum and minimum temperature lines shows the temperature does not vary far from freezing in the middle of summer; from August through December the temperature drops steadily. The small daily temperature range (the length of the vertical bars) results from the fact that the sun's elevation above the horizon does not change much or at all in this region during one day.

Much of the winter variability in this region is due to clouds. Since there is no sunlight, the thermal radiation emitted by the atmosphere is one of this region's main sources of energy in winter. A cloudy sky can emit much more energy toward the surface than a clear sky, so when it is cloudy in winter, this region tends to be warm, and when it is clear, this region cools quickly.

Canadian Briya

In winter, the Canadian Archipelago experiences temperatures similar to those in the Arctic Basin, but in the summer months of June to August, the presence of so much land in this region allows it to warm more than the ice-covered Arctic Basin. In the station-climatology figure above, the plot for Resolute is typical of this region. The presence of the islands, most of which lose their snow cover in summer, allows the summer temperatures to rise well above freezing. The average high temperature in summer approaches 10 °C (50 °F), and the average low temperature in July is above freezing, though temperatures below freezing are observed every month of the year.

The straits between these islands often remain covered by sea ice throughout the summer. This ice acts to keep the surface temperature at freezing, just as it does over the Arctic Basin, so a location on a strait would likely have a summer climate more like the Arctic Basin, but with higher maximum temperatures because of winds off of the nearby warm islands.

Greenland

Greenland's ice sheet thickness. Note that much of the area in green has permanent snow cover, it's just less than 10 m (33 ft) thick.

Climatically, Greenland is divided into two very separate regions: the coastal region, much of which is ice free, and the inland ice sheet. The Greenland Ice Sheet covers about 80% of Greenland, extending to the coast in places, and has an average elevation of 2,100 m (6,900 ft) and a maximum elevation of 3,200 m (10,500 ft). Much of the ice sheet remains below freezing all year, and it has the coldest climate of any part of the Arctic. Coastal areas can be affected by nearby open water, or by heat transfer through sea ice from the ocean, and many parts lose their snow cover in summer, allowing them to absorb more solar radiation and warm more than the interior.

Coastal regions on the northern half of Greenland experience winter temperatures similar to or slightly warmer than the Canadian Archipelago, with average January temperatures of −30 to −25 °C (−22 to −13 °F). These regions are slightly warmer than the Archipelago because of their closer proximity to areas of thin, first-year sea ice cover or to open ocean in the Baffin Bay and Greenland Sea.

The coastal regions in the southern part of the island are influenced more by open ocean water and by frequent passage of cyclones, both of which help to keep the temperature there from being as low as in the north. As a result of these influences, the average temperature in these areas in January is considerably higher, between about −20 to −4 °C (−4 to 25 °F).

The interior ice sheet escapes much of the influence of heat transfer from the ocean or from cyclones, and its high elevation also acts to give it a colder climate since temperatures tend to decrease with elevation. The result is winter temperatures that are lower than anywhere else in the Arctic, with average January temperatures of −45 to −30 °C (−49 to −22 °F), depending on location and on which data set is viewed. Minimum temperatures in winter over the higher parts of the ice sheet can drop below −60 °C (−76 °F)(CIA, 1978). In the station climatology figure above, the Centrale plot is representative of the high Greenland Ice Sheet.

In summer, the coastal regions of Greenland experience temperatures similar to the islands in the Canadian Archipelago, averaging just a few degrees above freezing in July, with slightly higher temperatures in the south and west than in the north and east. The interior ice sheet remains snow-covered throughout the summer, though significant portions do experience some snow melt. This snow cover, combined with the ice sheet's elevation, help to keep temperatures here lower, with July averages between −12 and 0 °C (10 and 32 °F). Along the coast, temperatures are kept from varying too much by the moderating influence of the nearby water or melting sea ice. In the interior, temperatures are kept from rising much above freezing because of the snow-covered surface but can drop to −30 °C (−22 °F) even in July. Temperatures above 20 °C are rare but do sometimes occur in the far south and south-west coastal areas.

Ice-free seas

Most Arctic seas are covered by ice for part of the year (see the map in the sea-ice section below); 'ice-free' here refers to those which are not covered year-round.

The only regions that remain ice-free throughout the year are the southern part of the Barents Sea and most of the Norwegian Sea. These have very small annual temperature variations; average winter temperatures are kept near or above the freezing point of sea water (about −2 °C (28 °F)) since the unfrozen ocean cannot have a temperature below that, and summer temperatures in the parts of these regions that are considered part of the Arctic average less than 10 °C (50 °F). During the 46-year period when weather records were kept on Shemya Island, in the southern Bering Sea, the average temperature of the coldest month (February) was −0.6 °C (30.9 °F) and that of the warmest month (August) was 9.7 °C (49.5 °F); temperatures never dropped below −17 °C (1 °F) or rose above 18 °C (64 °F); Western Regional Climate Center)

The rest of the seas have ice cover for some part of the winter and spring, but lose that ice during the summer. These regions have summer temperatures between about 0 and 8 °C (32 and 46 °F). The winter ice cover allows temperatures to drop much lower in these regions than in the regions that are ice-free all year. Over most of the seas that are ice-covered seasonally, winter temperatures average between about −30 and −15 °C (−22 and 5 °F). Those areas near the sea-ice edge will remain somewhat warmer due to the moderating influence of the nearby open water. In the station-climatology figure above, the plots for Point Barrow, Tiksi, Murmansk, and Isfjord are typical of land areas adjacent to seas that are ice-covered seasonally. The presence of the land allows temperatures to reach slightly more extreme values than the seas themselves.

An essentially ice-free Arctic may be a reality in the month of September, anywhere from 2050 to 2100.

Precipitation

Precipitation in most of the Arctic falls only as rain and snow. Over most areas snow is the dominant, or only, form of precipitation in winter, while both rain and snow fall in summer (Serreze and Barry 2005). The main exception to this general description is the high part of the Greenland Ice Sheet, which receives all of its precipitation as snow, in all seasons.

Accurate climatologies of precipitation amount are more difficult to compile for the Arctic than climatologies of other variables such as temperature and pressure. All variables are measured at relatively few stations in the Arctic, but precipitation observations are made more uncertain due to the difficulty in catching in a gauge all of the snow that falls. Typically some falling snow is kept from entering precipitation gauges by winds, causing an underreporting of precipitation amounts in regions that receive a large fraction of their precipitation as snowfall. Corrections are made to data to account for this uncaught precipitation, but they are not perfect and introduce some error into the climatologies (Serreze and Barry 2005).

The observations that are available show that precipitation amounts vary by about a factor of 10 across the Arctic, with some parts of the Arctic Basin and Canadian Archipelago receiving less than 150 mm (5.9 in) of precipitation annually, and parts of southeast Greenland receiving over 1,200 mm (47 in) annually. Most regions receive less than 500 mm (20 in) annually. For comparison, annual precipitation averaged over the whole planet is about 1,000 mm (39 in); see Precipitation). Unless otherwise noted, all precipitation amounts given in this article are liquid-equivalent amounts, meaning that frozen precipitation is melted before it is measured.

Arctic Basin

The Arctic Basin is one of the driest parts of the Arctic. Most of the Basin receives less than 250 mm (9.8 in) of precipitation per year, qualifying it as a desert. Smaller regions of the Arctic Basin just north of Svalbard and the Taymyr Peninsula receive up to about 400 mm (16 in) per year.

Monthly precipitation totals over most of the Arctic Basin average about 15 mm (0.59 in) from November through May, and rise to 20 to 30 mm (0.79 to 1.18 in) in July, August, and September. The dry winters result from the low frequency of cyclones in the region during that time, and the region's distance from warm open water that could provide a source of moisture (Serreze and Barry 2005). Despite the low precipitation totals in winter, precipitation frequency is higher in January, when 25% to 35% of observations reported precipitation, than in July, when 20% to 25% of observations reported precipitation (Serreze and Barry 2005). Much of the precipitation reported in winter is very light, possibly diamond dust. The number of days with measurable precipitation (more than 0.1 mm [0.004 in] in a day) is slightly greater in July than in January (USSR 1985). Of January observations reporting precipitation, 95% to 99% of them indicate it was frozen. In July, 40% to 60% of observations reporting precipitation indicate it was frozen (Serreze and Barry 2005).

The parts of the Basin just north of Svalbard and the Taymyr Peninsula are exceptions to the general description just given. These regions receive many weakening cyclones from the North-Atlantic storm track, which is most active in winter. As a result, precipitation amounts over these parts of the basin are larger in winter than those given above. The warm air transported into these regions also mean that liquid precipitation is more common than over the rest of the Arctic Basin in both winter and summer.

Canadian Archipelago

Annual precipitation totals in the Canadian Archipelago increase dramatically from north to south. The northern islands receive similar amounts, with a similar annual cycle, to the central Arctic Basin. Over Baffin Island and the smaller islands around it, annual totals increase from just over 200 mm (7.9 in) in the north to about 500 mm (20 in) in the south, where cyclones from the North Atlantic are more frequent.

Greenland

Annual precipitation amounts given below for Greenland are from Figure 6.5 in Serreze and Barry (2005). Due to the scarcity of long-term weather records in Greenland, especially in the interior, this precipitation climatology was developed by analyzing the annual layers in the snow to determine annual snow accumulation (in liquid equivalent) and was modified on the coast with a model to account for the effects of the terrain on precipitation amounts.

The southern third of Greenland protrudes into the North-Atlantic storm track, a region frequently influenced by cyclones. These frequent cyclones lead to larger annual precipitation totals than over most of the Arctic. This is especially true near the coast, where the terrain rises from sea level to over 2,500 m (8,200 ft), enhancing precipitation due to orographic lift. The result is annual precipitation totals of 400 mm (16 in) over the southern interior to over 1,200 mm (47 in) near the southern and southeastern coasts. Some locations near these coasts where the terrain is particularly conducive to causing orographic lift receive up 2,200 mm (87 in) of precipitation per year. More precipitation falls in winter, when the storm track is most active, than in summer.

The west coast of the central third of Greenland is also influenced by some cyclones and orographic lift, and precipitation totals over the ice sheet slope near this coast are up to 600 mm (24 in) per year. The east coast of the central third of the island receives between 200 and 600 mm (7.9 and 23.6 in) of precipitation per year, with increasing amounts from north to south. Precipitation over the north coast is similar to that over the central Arctic Basin.

The interior of the central and northern Greenland Ice Sheet is the driest part of the Arctic. Annual totals here range from less than 100 to about 200 mm (4 to 8 in). This region is continuously below freezing, so all precipitation falls as snow, with more in summer than in the winter time. (USSR 1985).

Ice-free seas

The Chukchi, Laptev, and Kara Seas and Baffin Bay receive somewhat more precipitation than the Arctic Basin, with annual totals between 200 and 400 mm (7.9 and 15.7 in); annual cycles in the Chukchi and Laptev Seas and Baffin Bay are similar to those in the Arctic Basin, with more precipitation falling in summer than in winter, while the Kara Sea has a smaller annual cycle due to enhanced winter precipitation caused by cyclones from the North Atlantic storm track.

The Labrador, Norwegian, Greenland, and Barents Seas and Denmark and Davis Straits are strongly influenced by the cyclones in the North Atlantic storm track, which is most active in winter. As a result, these regions receive more precipitation in winter than in summer. Annual precipitation totals increase quickly from about 400 mm (16 in) in the northern to about 1,400 mm (55 in) in the southern part of the region. Precipitation is frequent in winter, with measurable totals falling on an average of 20 days each January in the Norwegian Sea (USSR 1985). The Bering Sea is influenced by the North Pacific storm track, and has annual precipitation totals between 400 and 800 mm (16 and 31 in), also with a winter maximum.

Sea ice

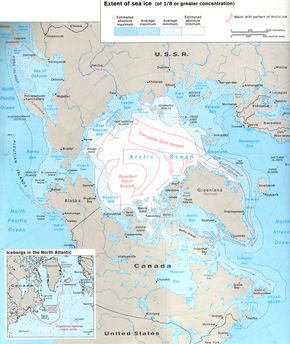
Estimates of the absolute and average minimum and maximum extent of sea ice in the Arctic as of the mid-1970s

Sea ice is frozen sea water that floats on the ocean's surface. It is the dominant surface type throughout the year in the Arctic Basin, and covers much of the ocean surface in the Arctic at some point during the year. The ice may be bare ice, or it may be covered by snow or ponds of melt water, depending on location and time of year. Sea ice is relatively thin, generally less than about 4 m (13 ft), with thicker ridges (NSIDC). NOAA's North Pole Web Cams having been tracking the Arctic summer sea ice transitions through spring thaw, summer melt ponds, and autumn freeze-up since the first webcam was deployed in 2002–present.

Sea ice is important to the climate and the ocean in a variety of ways. It reduces the transfer of heat from the ocean to the atmosphere; it causes less solar energy to be absorbed at the surface, and provides a surface on which snow can accumulate, which further decreases the absorption of solar energy; since salt is rejected from the ice as it forms, the ice increases the salinity of the ocean's surface water where it forms and decreases the salinity where it melts, both of which can affect the ocean's circulation.

The map at right shows the areas covered by sea ice when it is at its maximum extent (March) and its minimum extent (September). This map was made in the 1970s, and the extent of sea ice has decreased since then (see below), but this still gives a reasonable overview. At its maximum extent, in March, sea ice covers about 15 million km2 (5.8 million sq mi) of the Northern Hemisphere, nearly as much area as the largest country, Russia.

Winds and ocean currents cause the sea ice to move. The typical pattern of ice motion is shown on the map at right. On average, these motions carry sea ice from the Russian side of the Arctic Ocean into the Atlantic Ocean through the area east of Greenland, while they cause the ice on the North American side to rotate clockwise, sometimes for many years.

Wind

Wind speeds over the Arctic Basin and the western Canadian Archipelago average between 4 and 6 metres per second (14 and 22 kilometres per hour, 9 and 13 miles per hour) in all seasons. Stronger winds do occur in storms, often causing whiteout conditions, but they rarely exceed 25 m/s (90 km/h (56 mph) in these areas.

During all seasons, the strongest average winds are found in the North-Atlantic seas, Baffin Bay, and Bering and Chukchi Seas, where cyclone activity is most common. On the Atlantic side, the winds are strongest in winter, averaging 7 to 12 m/s (25 to 43 km/h (16 to 27 mph), and weakest in summer, averaging 5 to 7 m/s (18 to 25 km/h (11 to 16 mph). On the Pacific side they average 6 to 9 m/s (22 to 32 km/h (14 to 20 mph) year round. Maximum wind speeds in the Atlantic region can approach 50 m/s (180 km/h (110 mph) in winter.

Changes in Arctic Climate

Past climates

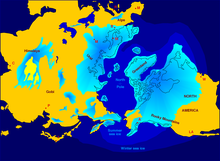
Northern hemisphere glaciation during the last ice ages. The setup of 3 to 4 kilometer thick ice sheets caused a sea level lowering of about 120 m.

As with the rest of the planet, the climate in the Arctic has changed throughout time. About 55 million years ago it is thought that parts of the Arctic supported subtropical ecosystems[10] and that Arctic sea-surface temperatures rose to about 23 °C (73 °F) during the Paleocene–Eocene Thermal Maximum. In the more recent past, the planet has experienced a series of ice ages and interglacial periods over about the last 2 million years, with the last ice age reaching its maximum extent about 18,000 years ago and ending by about 10,000 years ago. During these ice ages, large areas of northern North America and Eurasia were covered by ice sheets similar to the one found today on Greenland; Arctic climate conditions would have extended much further south, and conditions in the present-day Arctic region were likely colder. Temperature proxies suggest that over the last 8000 years the climate has been stable, with globally averaged temperature variations of less than about 1 °C (34 °F); (see Paleoclimate).

Global warming

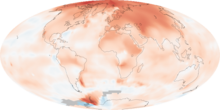
The image above shows where average air temperatures (October 2010 – September 2011) were up to 3 degrees Celsius above (red) or below (blue) the long-term average (1981–2010).
 
The map shows the 10-year average (2000–2009) global mean temperature anomaly relative to the 1951–1980 mean. The largest temperature increases are in the Arctic and the Antarctic Peninsula. Source: NASA Earth Observatory

There are several reasons to expect that climate changes, from whatever cause, may be enhanced in the Arctic, relative to the mid-latitudes and tropics. First is the ice-albedo feedback, whereby an initial warming causes snow and ice to melt, exposing darker surfaces that absorb more sunlight, leading to more warming. Second, because colder air holds less water vapour than warmer air, in the Arctic, a greater fraction of any increase in radiation absorbed by the surface goes directly into warming the atmosphere, whereas in the tropics, a greater fraction goes into evaporation. Third, because the Arctic temperature structure inhibits vertical air motions, the depth of the atmospheric layer that has to warm in order to cause warming of near-surface air is much shallower in the Arctic than in the tropics. Fourth, a reduction in sea-ice extent will lead to more energy being transferred from the warm ocean to the atmosphere, enhancing the warming. Finally, changes in atmospheric and oceanic circulation patterns caused by a global temperature change may cause more heat to be transferred to the Arctic, enhancing Arctic warming.

According to the Intergovernmental Panel on Climate Change (IPCC), "warming of the climate system is unequivocal", and the global-mean temperature has increased by 0.6 to 0.9 °C (1.1 to 1.6 °F) over the last century. This report also states that "most of the observed increase in global average temperatures since the mid-20th century is very likely [greater than 90% chance] due to the observed increase in anthropogenic greenhouse gas concentrations." The IPCC also indicate that, over the last 100 years, the annually averaged temperature in the Arctic has increased by almost twice as much as the global mean temperature has. In 2009, NASA reported that 45 percent or more of the observed warming in the Arctic since 1976 was likely a result of changes in tiny airborne particles called aerosols.

Climate models predict that the temperature increase in the Arctic over the next century will continue to be about twice the global average temperature increase. By the end of the 21st century, the annual average temperature in the Arctic is predicted to increase by 2.8 to 7.8 °C (5.0 to 14.0 °F), with more warming in winter (4.3 to 11.4 °C (7.7 to 20.5 °F)) than in summer. Decreases in sea-ice extent and thickness are expected to continue over the next century, with some models predicting the Arctic Ocean will be free of sea ice in late summer by the mid to late part of the century.

A study published in the journal Science in September 2009 determined that temperatures in the Arctic are higher presently than they have been at any time in the previous 2,000 years. Samples from ice cores, tree rings and lake sediments from 23 sites were used by the team, led by Darrell Kaufman of Northern Arizona University, to provide snapshots of the changing climate. Geologists were able to track the summer Arctic temperatures as far back as the time of the Romans by studying natural signals in the landscape. The results highlighted that for around 1,900 years temperatures steadily dropped, caused by precession of earth's orbit that caused the planet to be slightly farther away from the sun during summer in the Northern Hemisphere. These orbital changes led to a cold period known as the little ice age during the 17th, 18th and 19th centuries. However, during the last 100 years temperatures have been rising, despite the fact that the continued changes in earth's orbit would have driven further cooling. The largest rises have occurred since 1950, with four of the five warmest decades in the last 2,000 years occurring between 1950 and 2000. The last decade was the warmest in the record.

Space debris

From Wikipedia, the free encyclopedia

Earth from space, surrounded by small white dots
A computer-generated image representing the locations, but not relative sizes, of space debris as could be seen from high Earth orbit. The two main debris fields are the ring of objects in geosynchronous Earth orbit (GEO) and the cloud of objects in low Earth orbit (LEO).

Space debris (also known as space junk, space pollution, space waste, space trash, or space garbage) is defunct human-made objects in space—principally in Earth orbit—which no longer serve a useful function. These include derelict spacecraft—nonfunctional spacecraft and abandoned launch vehicle stages—mission-related debris, and particularly numerous in Earth orbit, fragmentation debris from the breakup of derelict rocket bodies and spacecraft. In addition to derelict human-made objects left in orbit, other examples of space debris include fragments from their disintegration, erosion and collisions or even paint flecks, solidified liquids expelled from spacecraft, and unburned particles from solid rocket motors. Space debris represents a risk to spacecraft.

Space debris is typically a negative externality—it creates an external cost on others from the initial action to launch or use a spacecraft in near-Earth orbit—a cost that is typically not taken into account nor fully accounted for in the cost by the launcher or payload owner.

Several spacecraft, both crewed and uncrewed, have been damaged or destroyed by space debris. The measurement, mitigation, and potential removal of debris are conducted by some participants in the space industry.

As of January 2021, the US Space Surveillance Network reported 21,901 artificial objects in orbit above the Earth, including 4,450 operational satellites. However, these are just the objects large enough to be tracked. As of January 2019, more than 128 million pieces of debris smaller than 1 cm (0.4 in), about 900,000 pieces of debris 1–10 cm, and around 34,000 of pieces larger than 10 cm (3.9 in) were estimated to be in orbit around the Earth. When the smallest objects of artificial space debris (paint flecks, solid rocket exhaust particles, etc.) are grouped with micrometeoroids, they are together sometimes referred to by space agencies as MMOD (Micrometeoroid and Orbital Debris). Collisions with debris have become a hazard to spacecraft; the smallest objects cause damage akin to sandblasting, especially to solar panels and optics like telescopes or star trackers that cannot easily be protected by a ballistic shield.

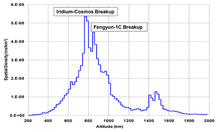
Below 2,000 km (1,200 mi) Earth-altitude, pieces of debris are denser than meteoroids; most are dust from solid rocket motors, surface erosion debris like paint flakes, and frozen coolant from RORSAT (nuclear-powered satellites). For comparison, the International Space Station orbits in the 300–400 kilometres (190–250 mi) range, while the two most recent large debris events—the 2007 Chinese antisat weapon test and the 2009 satellite collision—occurred at 800 to 900 kilometres (500 to 560 mi) altitude. The ISS has Whipple shielding to resist damage from small MMOD; however, known debris with a collision chance over 1/10,000 are avoided by maneuvering the station.

History

Space debris began to accumulate in Earth orbit immediately with the first launch of an artificial satellite Sputnik 1 into orbit in October 1957. But even before that, beside natural ejecta from Earth, humans might have produced ejecta that became space debris, as in the August 1957 Pascal B test. After the launch of Sputnik, the North American Aerospace Defense Command (NORAD) began compiling a database (the Space Object Catalog) of all known rocket launches and objects reaching orbit: satellites, protective shields and upper-stages of launch vehicles. NASA later published modified versions of the database in two-line element set, and beginning in the early 1980s the CelesTrak bulletin board system re-published them.

Debris graph of altitude and orbital period
Gabbard diagram of almost 300 pieces of debris from the disintegration of the five-month-old third stage of the Chinese Long March 4 booster on 11 March 2000

The trackers (NORAD) who fed the database were aware of other objects in orbit, many of which were the result of in-orbit explosions. Some were deliberately caused during the 1960s anti-satellite weapon (ASAT) testing, and others were the result of rocket stages blowing up in orbit as leftover propellant expanded and ruptured their tanks. To improve tracking, NORAD employee John Gabbard kept a separate database. Studying the explosions, Gabbard developed a technique for predicting the orbital paths of their products, and Gabbard diagrams (or plots) are now widely used. These studies were used to improve the modeling of orbital evolution and decay.

When the NORAD database became publicly available during the 1970s, techniques developed for the asteroid-belt were applied to the study to the database of known artificial satellite Earth objects.

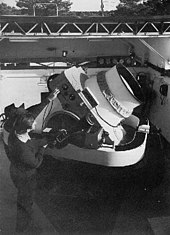
Large camera, with a man standing next to it for scale
Baker-Nunn cameras were widely used to study space debris.

In addition to approaches to debris reduction where time and natural gravitational/atmospheric effects help to clear space debris, or a variety of technological approaches that have been proposed (with most not implemented) to reduce space debris, a number of scholars have observed that institutional factors—political, legal, economic and cultural "rules of the game"—are the greatest impediment to the cleanup of near-Earth space. By 2014, there was little commercial incentive to reduce space debris, since the cost of dealing with it is not assigned to the entity producing it, but rather falls on all users of the space environment, and rely on human society as a whole that benefits from space technologies and knowledge. A number of suggestions for improving institutions so as to increase the incentives to reduce space debris have been made. These include government mandates to create incentives, as well as companies coming to see economic benefit to reducing debris more aggressively than existing government standard practices. In 1979 NASA founded the Orbital Debris Program to research mitigation measures for space debris in Earth orbit.

Debris growth

During the 1980s, NASA and other U.S. groups attempted to limit the growth of debris. One trial solution was implemented by McDonnell Douglas for the Delta launch vehicle, by having the booster move away from its payload and vent any propellant remaining in its tanks. This eliminated one source for pressure buildup in the tanks which had previously caused them to explode and create additional orbital debris. Other countries were slower to adopt this measure and, due especially to a number of launches by the Soviet Union, the problem grew throughout the decade.

A new battery of studies followed as NASA, NORAD and others attempted to better understand the orbital environment, with each adjusting the number of pieces of debris in the critical-mass zone upward. Although in 1981 (when Schefter's article was published) the number of objects was estimated at 5,000, new detectors in the Ground-based Electro-Optical Deep Space Surveillance system found new objects. By the late 1990s, it was thought that most of the 28,000 launched objects had already decayed and about 8,500 remained in orbit. By 2005 this was adjusted upward to 13,000 objects, and a 2006 study increased the number to 19,000 as a result of an ASAT test and a satellite collision. In 2011, NASA said that 22,000 objects were being tracked.

A 2006 NASA model suggested that if no new launches took place the environment would retain the then-known population until about 2055, when it would increase on its own. Richard Crowther of Britain's Defence Evaluation and Research Agency said in 2002 that he believed the cascade would begin about 2015. The National Academy of Sciences, summarizing the professional view, noted widespread agreement that two bands of LEO space—900 to 1,000 km (620 mi) and 1,500 km (930 mi)—were already past critical density.

In the 2009 European Air and Space Conference, University of Southampton researcher Hugh Lewis predicted that the threat from space debris would rise 50 percent in the next decade and quadruple in the next 50 years. As of 2009, more than 13,000 close calls were tracked weekly.

A 2011 report by the U.S. National Research Council warned NASA that the amount of orbiting space debris was at a critical level. According to some computer models, the amount of space debris "has reached a tipping point, with enough currently in orbit to continually collide and create even more debris, raising the risk of spacecraft failures". The report called for international regulations limiting debris and research of disposal methods.

Objects in Earth orbit including fragmentation debris. November 2020 NASA:ODPO

Debris history in particular years

  • As of 2009, 19,000 debris over 5 cm (2 in) were tracked by United States Space Surveillance Network.
  • As of July 2013, estimates of more than 170 million debris smaller than 1 cm (0.4 in), about 670,000 debris 1–10 cm, and approximately 29,000 larger pieces of debris are in orbit.
  • As of July 2016, nearly 18,000 artificial objects are orbiting above Earth, including 1,419 operational satellites.
  • As of October 2019, nearly 20,000 artificial objects in orbit above the Earth, including 2,218 operational satellites.

Characterization

Size

There are estimated to be over 128 million pieces of debris smaller than 1 cm (0.39 in) as of January 2019. There are approximately 900,000 pieces from 1 to 10 cm. The current count of large debris (defined as 10 cm across or larger) is 34,000. The technical measurement cutoff is c. 3 mm (0.12 in). As of 2020 there is 8000 metric tons of debris in orbit with no signs of slowing down.

Low Earth orbit

Satellite hit by a space debris, animation by ESA

In the orbits nearest to Earth—less than 2,000 km (1,200 mi) orbital altitude, referred to as low-Earth orbit (LEO)— there have traditionally been few "universal orbits" that keep a number of spacecraft in particular rings (in contrast to GEO, a single orbit that is widely used by over 500 satellites). This is beginning to change in 2019, and several companies have begun to deploy the early phases of satellite internet constellations, which will have many universal orbits in LEO with 30 to 50 satellites per orbital plane and altitude. Traditionally, the most populated LEO orbits have been a number of sun-synchronous satellites that keep a constant angle between the Sun and the orbital plane, making Earth observation easier with consistent sun angle and lighting. Sun-synchronous orbits are polar, meaning they cross over the polar regions. LEO satellites orbit in many planes, typically up to 15 times a day, causing frequent approaches between objects. The density of satellites—both active and derelict—is much higher in LEO.

Orbits are affected by gravitational perturbations (which in LEO include unevenness of the Earth's gravitational field due to variations in the density of the planet), and collisions can occur from any direction. The average impact speed of collisions in Low Earth Orbit is 10 km/s with maximums reaching above 14 km/s due to orbital eccentricity. The 2009 satellite collision occurred at a closing speed of 11.7 km/s (26,000 mph), creating over 2000 large debris fragments. These debris cross many other orbits and increase debris collision risk.

It is theorized that a sufficiently large collision of spacecraft could potentially lead to a cascade effect, or even make some particular low Earth orbits effectively unusable for long term use by orbiting satellites, a phenomenon known as the Kessler syndrome. The theoretical effect is projected to be a theoretical runaway chain reaction of collisions that could occur, exponentially increasing the number and density of space debris in low-Earth orbit, and has been hypothesized to ensue beyond some critical density.

Crewed space missions are mostly at 400 km (250 mi) altitude and below, where air drag helps clear zones of fragments. The upper atmosphere is not a fixed density at any particular orbital altitude; it varies as a result of atmospheric tides and expands or contracts over longer time periods as a result of space weather. These longer-term effects can increase drag at lower altitudes; the 1990s expansion was a factor in reduced debris density. Another factor was fewer launches by Russia; the Soviet Union made most of their launches in the 1970s and 1980s.

Higher altitudes

At higher altitudes, where air drag is less significant, orbital decay takes longer. Slight atmospheric drag, lunar perturbations, Earth's gravity perturbations, solar wind and solar radiation pressure can gradually bring debris down to lower altitudes (where it decays), but at very high altitudes this may take millennia. Although high-altitude orbits are less commonly used than LEO and the onset of the problem is slower, the numbers progress toward the critical threshold more quickly.

Many communications satellites are in geostationary orbits (GEO), clustering over specific targets and sharing the same orbital path. Although velocities are low between GEO objects, when a satellite becomes derelict (such as Telstar 401) it assumes a geosynchronous orbit; its orbital inclination increases about .8° and its speed increases about 160 km/h (99 mph) per year. Impact velocity peaks at about 1.5 km/s (0.93 mi/s). Orbital perturbations cause longitude drift of the inoperable spacecraft and precession of the orbital plane. Close approaches (within 50 meters) are estimated at one per year. The collision debris pose less short-term risk than from an LEO collision, but the satellite would likely become inoperable. Large objects, such as solar-power satellites, are especially vulnerable to collisions.

Although the ITU now requires proof a satellite can be moved out of its orbital slot at the end of its lifespan, studies suggest this is insufficient. Since GEO orbit is too distant to accurately measure objects under 1 m (3 ft 3 in), the nature of the problem is not well known. Satellites could be moved to empty spots in GEO, requiring less maneuvering and making it easier to predict future motion. Satellites or boosters in other orbits, especially stranded in geostationary transfer orbit, are an additional concern due to their typically high crossing velocity.

Despite efforts to reduce risk, spacecraft collisions have occurred. The European Space Agency telecom satellite Olympus-1 was struck by a meteoroid on 11 August 1993 and eventually moved to a graveyard orbit. On 29 March 2006, the Russian Express-AM11 communications satellite was struck by an unknown object and rendered inoperable; its engineers had enough contact time with the satellite to send it into a graveyard orbit.

Sources

Dead spacecraft

Small, round satellite with six rod antennas radiating from it
Vanguard 1 is expected to remain in orbit for 240 years.

In 1958, the United States launched Vanguard I into a medium Earth orbit (MEO). As of October 2009, it, and the upper stage of its launch rocket, were the oldest surviving artificial space objects still in orbit. In a catalog of known launches until July 2009, the Union of Concerned Scientists listed 902 operational satellites from a known population of 19,000 large objects and about 30,000 objects launched.

An example of additional derelict satellite debris is the remains of the 1970s/80s Soviet RORSAT naval surveillance satellite program. The satellites' BES-5 nuclear reactors were cooled with a coolant loop of sodium-potassium alloy, creating a potential problem when the satellite reached end of life. While many satellites were nominally boosted into medium-altitude graveyard orbits, not all were. Even satellites that had been properly moved to a higher orbit had an eight-percent probability of puncture and coolant release over a 50-year period. The coolant freezes into droplets of solid sodium-potassium alloy, forming additional debris.

In February 2015, the USAF Defense Meteorological Satellite Program Flight 13 (DMSP-F13) exploded on orbit, creating at least 149 debris objects, which were expected to remain in orbit for decades.

Orbiting satellites have been deliberately destroyed. United States and USSR/Russia have conducted over 30 and 27 ASAT tests, respectively, followed by 10 from China and one from India. The most recent ASATs were Chinese interception of FY-1C, trials of Russian PL-19 Nudol, American interception of USA-193 and Indian interception of unstated live satellite.

Lost equipment

A drifting thermal blanket photographed in 1998 during STS-88.

Space debris includes a glove lost by astronaut Ed White on the first American space-walk (EVA), a camera lost by Michael Collins near Gemini 10, a thermal blanket lost during STS-88, garbage bags jettisoned by Soviet cosmonauts during Mir's 15-year life, a wrench, and a toothbrush. Sunita Williams of STS-116 lost a camera during an EVA. During an STS-120 EVA to reinforce a torn solar panel, a pair of pliers was lost, and in an STS-126 EVA, Heidemarie Stefanyshyn-Piper lost a briefcase-sized tool bag.

Boosters

Spent upper stage of a Delta II rocket, photographed by the XSS 10 satellite

In characterizing the problem of space debris, it was learned that much debris was due to rocket upper stages (e.g. the Inertial Upper Stage) which end up in orbit, and break up due to decomposition of unvented unburned fuel. However, a major known impact event involved an (intact) Ariane booster. Although NASA and the United States Air Force now require upper-stage passivation, other launchers do not. Lower stages, like the Space Shuttle's solid rocket boosters or Apollo program's Saturn IB launch vehicles, do not reach orbit.

On 11 March 2000 a Chinese Long March 4 CBERS-1 upper stage exploded in orbit, creating a debris cloud. A Russian Briz-M booster stage exploded in orbit over South Australia on 19 February 2007. Launched on 28 February 2006 carrying an Arabsat-4A communications satellite, it malfunctioned before it could use up its propellant. Although the explosion was captured on film by astronomers, due to the orbit path the debris cloud has been difficult to measure with radar. By 21 February 2007, over 1,000 fragments were identified. A 14 February 2007 breakup was recorded by Celestrak. Eight breakups occurred in 2006, the most since 1993. Another Briz-M broke up on 16 October 2012 after a failed 6 August Proton-M launch. The amount and size of the debris was unknown. A Long March 7 rocket booster created a fireball visible from portions of Utah, Nevada, Colorado, Idaho and California on the evening of 27 July 2016; its disintegration was widely reported on social media. In 2018–2019, three different Atlas V Centaur second stages have broken up.

Orbit of 2020 SO

In December 2020, scientists confirmed that a previously detected near-Earth object, 2020 SO, was rocket booster space junk launched in 1966 orbiting Earth and the Sun.

Weapons

A past debris source was the testing of anti-satellite weapons (ASATs) by the U.S. and Soviet Union during the 1960s and 1970s. North American Aerospace Defense Command (NORAD) files only contained data for Soviet tests, and debris from U.S. tests were only identified later. By the time the debris problem was understood, widespread ASAT testing had ended; the U.S. Program 437 was shut down in 1975.

The U.S. restarted their ASAT programs in the 1980s with the Vought ASM-135 ASAT. A 1985 test destroyed a 1-tonne (2,200 lb) satellite orbiting at 525 km (326 mi), creating thousands of debris larger than 1 cm (0.39 in). Due to the altitude, atmospheric drag decayed the orbit of most debris within a decade. A de facto moratorium followed the test.

Simulation of Earth from space, with orbit planes in red
Known orbit planes of Fengyun-1C debris one month after the weather satellite's disintegration by the Chinese ASAT

China's government was condemned for the military implications and the amount of debris from the 2007 anti-satellite missile test, the largest single space debris incident in history (creating over 2,300 pieces golf-ball size or larger, over 35,000 1 cm (0.4 in) or larger, and one million pieces 1 mm (0.04 in) or larger). The target satellite orbited between 850 km (530 mi) and 882 km (548 mi), the portion of near-Earth space most densely populated with satellites. Since atmospheric drag is low at that altitude, the debris is slow to return to Earth, and in June 2007 NASA's Terra environmental spacecraft maneuvered to avoid impact from the debris. Dr. Brian Weeden, U.S. Air Force officer and Secure World Foundation staff member, noted that the 2007 Chinese satellite explosion created an orbital debris of more than 3,000 separate objects that then required tracking. On 20 February 2008, the U.S. launched an SM-3 missile from the USS Lake Erie to destroy a defective U.S. spy satellite thought to be carrying 450 kg (1,000 lb) of toxic hydrazine propellant. The event occurred at about 250 km (155 mi), and the resulting debris has a perigee of 250 km (155 mi) or lower. The missile was aimed to minimize the amount of debris, which (according to Pentagon Strategic Command chief Kevin Chilton) had decayed by early 2009.

On 27 March 2019, Indian Prime Minister Narendra Modi announced that India shot down one of its own LEO satellites with a ground-based missile. He stated that the operation, part of Mission Shakti, would defend the country's interests in space. Afterwards, US Air Force Space Command announced they were tracking 270 new pieces of debris but expected the number to grow as data collection continues.

On 15 November 2021 the Russian Defense Ministry destroyed Kosmos 1408 orbiting at around 450 km, creating "more than 1,500 pieces of trackable debris and hundreds of thousands of pieces of un-trackable debris" according to the US State Department.

The vulnerability of satellites to debris and the possibility of attacking LEO satellites to create debris clouds has triggered speculation that it is possible for countries unable to make a precision attack. An attack on a satellite of 10 t (22,000 lb) or more would heavily damage the LEO environment.

Hazards

Large glass pit (damage)
A micrometeoroid left this crater on the surface of Space Shuttle Challenger's front window on STS-7.

To spacecraft

Space junk can be a hazard to active satellites and spacecraft. It has been theorized that Earth orbit could even become impassable if the risk of collision grows too high.

However, since the risk to spacecraft increases with the time of exposure to high debris densities, it is more accurate to say that LEO would be rendered unusable by orbiting craft. The threat to craft passing through LEO to reach higher orbit would be much lower owing to the very short time span of the crossing.

Uncrewed spacecraft

Although spacecraft are typically protected by Whipple shields, solar panels, which are exposed to the Sun, wear from low-mass impacts. Even small impacts can produce a cloud of plasma which is an electrical risk to the panels.

Satellites are believed to have been destroyed by micrometeorites and (small) orbital debris (MMOD). The earliest suspected loss was of Kosmos 1275, which disappeared on 24 July 1981 (a month after launch). Kosmos contained no volatile propellant, therefore, there appeared to be nothing internal to the satellite which could have caused the destructive explosion which took place. However, the case has not been proven and another hypothesis forwarded is that the battery exploded. Tracking showed it broke up, into 300 new objects.

Many impacts have been confirmed since. For example, on 24 July 1996, the French microsatellite Cerise was hit by fragments of an Ariane-1 H-10 upper-stage booster which exploded in November 1986. On 29 March 2006, the Russian Ekspress AM11 communications satellite was struck by an unknown object and rendered inoperable. On 13 October 2009, Terra suffered a single battery cell failure anomaly and a battery heater control anomaly which were subsequently considered likely the result of an MMOD strike. On 12 March 2010, Aura lost power from one-half of one of its 11 solar panels and this was also attributed to an MMOD strike. On 22 May 2013, GOES 13 was hit by an MMOD which caused it to lose track of the stars that it used to maintain an operational attitude. It took nearly a month for the spacecraft to return to operation.

The first major satellite collision occurred on 10 February 2009. The 950 kg (2,090 lb) derelict satellite Kosmos 2251 and the operational 560 kg (1,230 lb) Iridium 33 collided, 500 mi (800 km) over northern Siberia. The relative speed of impact was about 11.7 km/s (7.3 mi/s), or about 42,120 km/h (26,170 mph). Both satellites were destroyed, creating thousands of pieces of new smaller debris, with legal and political liability issues unresolved even years later. On 22 January 2013, BLITS (a Russian laser-ranging satellite) was struck by debris suspected to be from the 2007 Chinese anti-satellite missile test, changing both its orbit and rotation rate.

Satellites sometimes perform Collision Avoidance Maneuvers and satellite operators may monitor space debris as part of maneuver planning. For example, in January 2017, the European Space Agency made the decision to alter orbit of one of its three Swarm mission spacecraft, based on data from the US Joint Space Operations Center, to lower the risk of collision from Cosmos-375, a derelict Russian satellite.

Crewed spacecraft

Crewed flights are naturally particularly sensitive to the hazards that could be presented by space debris conjunctions in the orbital path of the spacecraft. Examples of occasional avoidance maneuvers, or longer-term space debris wear, have occurred in Space Shuttle missions, the MIR space station, and the International Space Station.

Space Shuttle missions
Grey spacecraft wing at aircraft altitude
Space Shuttle Discovery's lower starboard wing and Thermal Protection System tiles, photographed on STS-114 during an R-Bar Pitch Manoeuvre where astronauts examine the TPS for any damage during ascent

From the early Space Shuttle missions, NASA used NORAD space monitoring capabilities to assess the Shuttle's orbital path for debris. In the 1980s, this used a large proportion of NORAD capacity. The first collision-avoidance maneuver occurred during STS-48 in September 1991, a seven-second thruster burn to avoid debris from the derelict satellite Kosmos 955. Similar maneuvers were initiated on missions 53, 72 and 82.

One of the earliest events to publicize the debris problem occurred on Space Shuttle Challenger's second flight, STS-7. A fleck of paint struck its front window, creating a pit over 1 mm (0.04 in) wide. On STS-59 in 1994, Endeavour's front window was pitted about half its depth. Minor debris impacts increased from 1998.

Window chipping and minor damage to thermal protection system tiles (TPS) were already common by the 1990s. The Shuttle was later flown tail-first to take a greater proportion of the debris load on the engines and rear cargo bay, which are not used in orbit or during descent, and thus are less critical for post-launch operation. When flying attached to the ISS, the two connected spacecraft were flipped around so the better-armored station shielded the orbiter.

Bullet-like hole in metallic material
Space Shuttle Endeavour had a major impact on its radiator during STS-118. The entry hole is about 5.5 mm (0.22 in), and the exit hole is twice as large.

A NASA 2005 study concluded that debris accounted for approximately half of the overall risk to the Shuttle. Executive-level decision to proceed was required if catastrophic impact was likelier than 1 in 200. On a normal (low-orbit) mission to the ISS the risk was approximately 1 in 300, but the Hubble telescope repair mission was flown at the higher orbital altitude of 560 km (350 mi) where the risk was initially calculated at a 1-in-185 (due in part to the 2009 satellite collision). A re-analysis with better debris numbers reduced the estimated risk to 1 in 221, and the mission went ahead.

Debris incidents continued on later Shuttle missions. During STS-115 in 2006 a fragment of circuit board bored a small hole through the radiator panels in Atlantis's cargo bay. On STS-118 in 2007 debris blew a bullet-like hole through Endeavour's radiator panel.

Mir

Impact wear was notable on Mir, the Soviet space station, since it remained in space for long periods with its original solar module panels.

Space station with Earth as the background
Debris impacts on Mir's solar panels degraded their performance. The damage is most noticeable on the panel on the right, which is facing the camera with a high degree of contrast. Extensive damage to the smaller panel below is due to impact with a Progress spacecraft.
International Space Station

The ISS also uses Whipple shielding to protect its interior from minor debris. However, exterior portions (notably its solar panels) cannot be protected easily. In 1989, the ISS panels were predicted to degrade approximately 0.23% in four years due to the "sandblasting" effect of impacts with small orbital debris. An avoidance maneuver is typically performed for the ISS if "there is a greater than one-in-10,000 chance of a debris strike". As of January 2014, there have been sixteen maneuvers in the fifteen years the ISS had been in orbit. By 2019, over 1,400 meteoroid and orbital debris (MMOD) impacts had been recorded on the ISS.

As another method to reduce the risk to humans on board, ISS operational management asked the crew to shelter in the Soyuz on three occasions due to late debris-proximity warnings. In addition to the sixteen thruster firings and three Soyuz-capsule shelter orders, one attempted maneuver was not completed due to not having the several days' warning necessary to upload the maneuver timeline to the station's computer. A March 2009 event involved debris believed to be a 10 cm (3.9 in) piece of the Kosmos 1275 satellite. In 2013, the ISS operations management did not make a maneuver to avoid any debris, after making a record four debris maneuvers the previous year.

Kessler syndrome

The Kessler syndrome, proposed by NASA scientist Donald J. Kessler in 1978, is a theoretical scenario in which the density of objects in low Earth orbit (LEO) is high enough that collisions between objects could cause a cascade effect where each collision generates space debris that increases the likelihood of further collisions. He further theorized that one implication if this were to occur is that the distribution of debris in orbit could render space activities and the use of satellites in specific orbital ranges economically impractical for many generations.

The growth in the number of objects as a result of the late-1990s studies sparked debate in the space community on the nature of the problem and the earlier dire warnings. According to Kessler's 1991 derivation and 2001 updates, the LEO environment in the 1,000 km (620 mi) altitude range should be cascading. However, only one major satellite collision incident has occurred: the 2009 satellite collision between Iridium 33 and Cosmos 2251. The lack of obvious short-term cascading has led to speculation that the original estimates overstated the problem. According to Kessler in 2010 however, a cascade may not be obvious until it is well advanced, which might take years.

On Earth

Cylindrical rocket fragment on sand, with men looking at it
Saudi officials inspect a crashed PAM-D module in January 2001.

Although most debris burns up in the atmosphere, larger debris objects can reach the ground intact. According to NASA, an average of one cataloged piece of debris has fallen back to Earth each day for the past 50 years. Despite their size, there has been no significant property damage from the debris. Burning up in the atmosphere may also contribute to atmospheric pollution.

Numerous small cylindrical tanks from space objects have been found, designed to hold fuel or gasses. More notable examples of space debris falling to Earth and impacting human life include:

  • 1969: five sailors on a Japanese ship were injured when space debris from what was believed to be a Soviet spacecraft struck the deck of their boat.
  • 1978: the Soviet reconnaissance satellite Kosmos 954 reentered the atmosphere over northwest Canada and scattered radioactive debris over northern Canada, some landing in the Great Slave Lake.
  • 1979: portions of Skylab came down over Australia, and several pieces landed in the area around the Shire of Esperance, which fined NASA $400 for littering.
  • 1987: a 7-foot strip of metal from the Soviet Kosmos 1890 rocket landed between two homes in Lakeport, California, causing no damage.
  • 1991: Salyut 7 underwent an uncontrolled reentry on 7 February over the city of Capitán Bermúdez in Argentina.
  • 1997: an Oklahoma woman, Lottie Williams, was hit, without injury in the shoulder by a 10 cm × 13 cm (3.9 in × 5.1 in) piece of blackened, woven metallic material confirmed as part of the propellant tank of a Delta II rocket which launched a U.S. Air Force satellite the year before.
  • 2001: a Star 48 Payload Assist Module (PAM-D) rocket upper stage re-entered the atmosphere after a "catastrophic orbital decay", crashing in the Saudi Arabian desert. It was identified as the upper-stage rocket for NAVSTAR 32, a GPS satellite launched in 1993.
  • 2002: 6-year-old boy Wu Jie became the first person to be injured by direct impact from space debris. He suffered a fractured toe and a swelling on his forehead after a block of aluminum, 80 centimeters by 50 centimeters and weighing 10 kilograms, from the outer shell of the Resource Second satellite struck him as he sat beneath a persimmon tree in the Shaanxi province of China.
  • 2003: Columbia disaster, large parts of the spacecraft reached the ground and entire equipment systems remained intact. More than 83,000 pieces, along with the remains of the six astronauts, were recovered in an area from three to ten miles around Hemphill in Sabine County, Texas. More pieces were found in a line from west Texas to east Louisiana, with the westernmost piece found in Littlefield, TX and the easternmost found southwest of Mora, Louisiana. Debris was found in Texas, Arkansas and Louisiana. In a rare case of property damage, a foot-long metal bracket smashed through the roof of a dentist office. NASA warned the public to avoid contact with the debris because of the possible presence of hazardous chemicals. 15 years after the failure, people were still sending in pieces with the most recent, as of February 2018, found in the spring of 2017.
  • 2007: airborne debris from a Russian spy satellite was seen by the pilot of a LAN Airlines Airbus A340 carrying 270 passengers whilst flying over the Pacific Ocean between Santiago and Auckland. The debris was reported within 9.3 kilometres (5 nmi) of the aircraft.
  • 2016: on 2 November, upper stage of Vega flight VV01 launched on 13 February 2012 reentered over Indian state of Tamil Nadu. A composite overwrapped pressure vessel survived reentry and was recovered.
  • 2020: The empty core stage of a Long March-5B rocket made an uncontrolled re-entry - the largest object to do so since the Soviet Union's 39-ton Salyut 7 space station in 1991 – over Africa and the Atlantic Ocean and a 12-meter-long pipe originating from the rocket crashed into the village of Mahounou in Côte d'Ivoire.
  • 2021: a Falcon 9 second stage made an uncontrolled re-entry over Washington state on March 25, producing a widely seen "light show". A composite-overwrapped pressure vessel survived the re-entry and landed on a farm field.
  • 2022:
    • On 2 April, pieces of reentered space debris impacted multiple locations in Indian state of Maharashtra, the event of reentry was witnessed by many. Recovered debris consisted of metallic ring almost 3 meter in diameter along at least six composite overwrapped pressure vessels with some bearing '3CCA301001 B' marking. The debris is likely from third stage of Long March 3B rocket with Y77 serial, launched in February 2021.
    • A month later on 12 May another incidence of space debris reentry and impact was reported over Indian state of Gujarat, surviving debris consisted of metal fragments and at least three composite overwrapped pressure vessels. Allegedly the falling debris killed a livestock animal and injured another as one metal fragment struck a sheep pen. The debris is likely from third stage of Long March 3B rocket with Y86 serial, launched in September 2021. Indian space agency ISRO is investigating both incidences.
    • On 9 July 2022, trunk of SpaceX Crew-1 Dragon spacecraft reentered and its debris landed on multiple locations like Albury, Wagga Wagga and Canberra in New South Wales, Australia.

Tracking and measurement

Tracking from the ground

Radar and optical detectors such as lidar are the main tools for tracking space debris. Although objects under 10 cm (4 in) have reduced orbital stability, debris as small as 1 cm can be tracked, however determining orbits to allow re-acquisition is difficult. Most debris remain unobserved. The NASA Orbital Debris Observatory tracked space debris with a 3 m (10 ft) liquid mirror transit telescope. FM Radio waves can detect debris, after reflecting off them onto a receiver. Optical tracking may be a useful early-warning system on spacecraft.

The U.S. Strategic Command keeps a catalog of known orbital objects, using ground-based radar and telescopes, and a space-based telescope (originally to distinguish from hostile missiles). The 2009 edition listed about 19,000 objects. Other data come from the ESA Space Debris Telescope, TIRA, the Goldstone, Haystack, and EISCAT radars and the Cobra Dane phased array radar, to be used in debris-environment models like the ESA Meteoroid and Space Debris Terrestrial Environment Reference (MASTER).

Measurement in space

Large, cylindrical spacecraft against Earth background, photographed from the Challenger space shuttle
The Long Duration Exposure Facility (LDEF) is an important source of information on small-particle space debris.

Returned space hardware is a valuable source of information on the directional distribution and composition of the (sub-millimetre) debris flux. The LDEF satellite deployed by mission STS-41-C Challenger and retrieved by STS-32 Columbia spent 68 months in orbit to gather debris data. The EURECA satellite, deployed by STS-46 Atlantis in 1992 and retrieved by STS-57 Endeavour in 1993, was also used for debris study.

The solar arrays of Hubble were returned by missions STS-61 Endeavour and STS-109 Columbia, and the impact craters studied by the ESA to validate its models. Materials returned from Mir were also studied, notably the Mir Environmental Effects Payload (which also tested materials intended for the ISS).

Gabbard diagrams

A debris cloud resulting from a single event is studied with scatter plots known as Gabbard diagrams, where the perigee and apogee of fragments are plotted with respect to their orbital period. Gabbard diagrams of the early debris cloud prior to the effects of perturbations, if the data were available, are reconstructed. They often include data on newly observed, as yet uncatalogued fragments. Gabbard diagrams can provide important insights into the features of the fragmentation, the direction and point of impact.

Dealing with debris

An average of about one tracked object per day has been dropping out of orbit for the past 50 years, averaging almost three objects per day at solar maximum (due to the heating and expansion of the Earth's atmosphere), but one about every three days at solar minimum, usually five and a half years later. In addition to natural atmospheric effects, corporations, academics and government agencies have proposed plans and technology to deal with space debris, but as of November 2014, most of these are theoretical, and there is no extant business plan for debris reduction.

A number of scholars have also observed that institutional factors—political, legal, economic, and cultural "rules of the game"—are the greatest impediment to the cleanup of near-Earth space. There is little commercial incentive to act, since costs are not assigned to polluters, though a number of technological solutions have been suggested. However, effects to date are limited. In the US, governmental bodies have been accused of backsliding on previous commitments to limit debris growth, "let alone tackling the more complex issues of removing orbital debris." The different methods for removal of space debris have been evaluated by the Space Generation Advisory Council, including French astrophysicist Fatoumata Kébé.

Growth mitigation

Graph with blue line
Spatial density of LEO space debris by altitude, according to 2011 a NASA report to the United Nations Office for Outer Space Affairs
 
Graph with red line
Spatial density of space debris by altitude according to ESA MASTER-2001, without debris from the Chinese ASAT and 2009 collision events

As of the 2010s, several technical approaches to the mitigation of the growth of space debris are typically undertaken, yet no comprehensive legal regime or cost assignment structure is in place to reduce space debris in the way that terrestrial pollution has reduced since the mid-20th century.

To avoid excessive creation of artificial space debris, many—but not all—satellites launched to above-low-Earth-orbit are launched initially into elliptical orbits with perigees inside Earth's atmosphere so the orbit will quickly decay and the satellites then will destroy themselves upon reentry into the atmosphere. Other methods are used for spacecraft in higher orbits. These include passivation of the spacecraft at the end of its useful life; as well as the use of upper stages that can reignite to decelerate the stage to intentionally deorbit it, often on the first or second orbit following payload release; satellites that can, if they remain healthy for years, deorbit themselves from the lower orbits around Earth. Other satellites (such as many CubeSats) in low orbits below approximately 400 km (250 mi) orbital altitude depend on the energy-absorbing effects of the upper atmosphere to reliably deorbit a spacecraft within weeks or months.

Increasingly, spent upper stages in higher orbits—orbits for which low-delta-v deorbit is not possible, or not planned for—and architectures that support satellite passivation, at end of life are passivated at end of life. This removes any internal energy contained in the vehicle at the end of its mission or useful life. While this does not remove the debris of the now derelict rocket stage or satellite itself, it does substantially reduce the likelihood of the spacecraft destructing and creating many smaller pieces of space debris, a phenomenon that was common in many of the early generations of US and Soviet spacecraft.

Upper stage passivation (e.g. of Delta boosters) by releasing residual propellants reduces debris from orbital explosions; however even as late as 2011, not all upper stages implement this practice. SpaceX used the term "propulsive passivation" for the final maneuver of their six-hour demonstration mission (STP-2) of the Falcon 9 second stage for the US Air Force in 2019, but did not define what all that term encompassed.

With a "one-up, one-down" launch-license policy for Earth orbits, launchers would rendezvous with, capture and de-orbit a derelict satellite from approximately the same orbital plane. Another possibility is the robotic refueling of satellites. Experiments have been flown by NASA, and SpaceX is developing large-scale on-orbit propellant transfer technology.

Another approach to debris mitigation is to explicitly design the mission architecture to always leave the rocket second-stage in an elliptical geocentric orbit with a low-perigee, thus ensuring rapid orbital decay and avoiding long-term orbital debris from spent rocket bodies. Such missions will often complete the payload placement in a final orbit by the use of low-thrust electric propulsion or with the use of a small kick stage to circularize the orbit. The kick stage itself may be designed with the excess-propellant capability to be able to self-deorbit.

Self-removal

Although the ITU requires geostationary satellites to move to a graveyard orbit at the end of their lives, the selected orbital areas do not sufficiently protect GEO lanes from debris. Rocket stages (or satellites) with enough propellant may make a direct, controlled de-orbit, or if this would require too much propellant, a satellite may be brought to an orbit where atmospheric drag would cause it to eventually de-orbit. This was done with the French Spot-1 satellite, reducing its atmospheric re-entry time from a projected 200 years to about 15 by lowering its altitude from 830 km (516 mi) to about 550 km (342 mi).

The Iridium constellation – 95 communication satellites launched during the five-year period between 1997 and 2002 – provides a set of data points on the limits of self-removal. The satellite operator – Iridium Communications – remained operational over the two-decade life of the satellites (albeit with a company name change through a corporate bankruptcy during the period) and, by December 2019, had "completed disposal of the last of its 65 working legacy satellites." However, this process left 30 satellites with a combined mass of (20,400 kg (45,000 lb), or nearly a third of the mass of this constellation) in LEO orbits at approximately 700 km (430 mi) altitude, where self-decay is quite slow. Of these satellites, 29 simply failed during their time in orbit and were thus unable to self-deorbit, while one – Iridium 33 – was involved in the 2009 satellite collision with the derelict Russian military satellite Kosmos-2251. No contingency plan was laid for the removal of satellites that were unable to remove themselves. In 2019, the Iridium CEO, Matt Desch, said that Iridium would be willing to pay an active-debris-removal company to deorbit its remaining first-generation satellites if it were possible for an unrealistically low cost, say "US$10,000 per deorbit, but [he] acknowledged that price would likely be far below what a debris-removal company could realistically offer. 'You know at what point [it’s] a no-brainer, but [I] expect the cost is really in the millions or tens of millions, at which price I know it doesn’t make sense.'"

Passive methods of increasing the orbital decay rate of spacecraft debris have been proposed. Instead of rockets, an electrodynamic tether could be attached to a spacecraft at launch; at the end of its lifetime, the tether would be rolled out to slow the spacecraft. Other proposals include a booster stage with a sail-like attachment and a large, thin, inflatable balloon envelope.

External removal

A variety of approaches have been proposed, studied, or had ground subsystems built to use other spacecraft to remove existing space debris. A consensus of speakers at a meeting in Brussels in October 2012, organized by the Secure World Foundation (a U.S. think tank) and the French International Relations Institute, reported that removal of the largest debris would be required to prevent the risk to spacecraft becoming unacceptable in the foreseeable future (without any addition to the inventory of dead spacecraft in LEO). To date in 2019, removal costs and legal questions about ownership and the authority to remove defunct satellites have stymied national or international action. Current space law retains ownership of all satellites with their original operators, even debris or spacecraft which are defunct or threaten active missions.

Multiple companies made plans in the late 2010s to conduct external removal on their satellites in mid-LEO orbits. For example, OneWeb planned to utilize onboard self-removal as "plan A" for satellite deorbiting at the end of life, but if a satellite were unable to remove itself within one year of end of life, OneWeb would implement "plan B" and dispatch a reusable (multi-transport mission) space tug to attach to the satellite at an already built-in capture target via a grappling fixture, to be towed to a lower orbit and released for re-entry.

Remotely controlled vehicles

A well-studied solution uses a remotely controlled vehicle to rendezvous with, capture, and return debris to a central station. One such system is Space Infrastructure Servicing, a commercially developed refueling depot and service spacecraft for communications satellites in geosynchronous orbit originally scheduled for a 2015 launch. The SIS would be able to "push dead satellites into graveyard orbits." The Advanced Common Evolved Stage family of upper stages is being designed with a high leftover-propellant margin (for derelict capture and de-orbit) and in-space refueling capability for the high delta-v required to de-orbit heavy objects from geosynchronous orbit. A tug-like satellite to drag debris to a safe altitude for it to burn up in the atmosphere has been researched. When debris is identified the satellite creates a difference in potential between the debris and itself, then using its thrusters to move itself and the debris to a safer orbit.

A variation of this approach is for the remotely controlled vehicle to rendezvous with debris, capture it temporarily to attach a smaller de-orbit satellite and drag the debris with a tether to the desired location. The "mothership" would then tow the debris-smallsat combination for atmospheric entry or move it to a graveyard orbit. One such system is the proposed Busek ORbital DEbris Remover (ORDER), which would carry over 40 SUL (satellite on umbilical line) de-orbit satellites and propellant sufficient for their removal.

On 7 January 2010 Star, Inc. reported that it received a contract from the Space and Naval Warfare Systems Command for a feasibility study of the ElectroDynamic Debris Eliminator (EDDE) propellantless spacecraft for space-debris removal. In February 2012 the Swiss Space Center at École Polytechnique Fédérale de Lausanne announced the Clean Space One project, a nanosatellite demonstration project for matching orbit with a defunct Swiss nanosatellite, capturing it and de-orbiting together. The mission has seen several evolutions to reach a pac-man inspired capture model. In 2013, Space Sweeper with Sling-Sat (4S), a grappling satellite which captures and ejects debris was studied. In 2022, a Chinese satellite, SJ-21, grabbed an unused satellite and "threw" it into an orbit with a lower risk for it to collide.

In December 2019, the European Space Agency awarded the first contract to clean up space debris. The €120 million mission dubbed ClearSpace-1 (a spinoff from the EPFL project) is slated to launch in 2025. It aims to remove a 100 kg VEga Secondary Payload Adapter (Vespa) left by Vega flight VV02 in an 800 km (500 mi) orbit in 2013. A "chaser" will grab the junk with four robotic arms and drag it down to Earth's atmosphere where both will burn up.

Laser methods

The laser broom uses a ground-based laser to ablate the front of the debris, producing a rocket-like thrust that slows the object. With continued application, the debris would fall enough to be influenced by atmospheric drag. During the late 1990s, the U.S. Air Force's Project Orion was a laser-broom design. Although a test-bed device was scheduled to launch on a Space Shuttle in 2003, international agreements banning powerful laser testing in orbit limited its use to measurements. The 2003 Space Shuttle Columbia disaster postponed the project and according to Nicholas Johnson, chief scientist and program manager for NASA's Orbital Debris Program Office, "There are lots of little gotchas in the Orion final report. There's a reason why it's been sitting on the shelf for more than a decade."

The momentum of the laser-beam photons could directly impart a thrust on the debris sufficient to move small debris into new orbits out of the way of working satellites. NASA research in 2011 indicates that firing a laser beam at a piece of space junk could impart an impulse of 1 mm (0.039 in) per second, and keeping the laser on the debris for a few hours per day could alter its course by 200 m (660 ft) per day. One drawback is the potential for material degradation; the energy may break up the debris, adding to the problem. A similar proposal places the laser on a satellite in Sun-synchronous orbit, using a pulsed beam to push satellites into lower orbits to accelerate their reentry. A proposal to replace the laser with an Ion Beam Shepherd has been made, and other proposals use a foamy ball of aerogel or a spray of water, inflatable balloons, electrodynamic tethers, electroadhesion, and dedicated anti-satellite weapons.

Nets

On 28 February 2014, Japan's Japan Aerospace Exploration Agency (JAXA) launched a test "space net" satellite. The launch was an operational test only. In December 2016 the country sent a space junk collector via Kounotori 6 to the ISS by which JAXA scientists experiment to pull junk out of orbit using a tether. The system failed to extend a 700-meter tether from a space station resupply vehicle that was returning to Earth. On 6 February the mission was declared a failure and leading researcher Koichi Inoue told reporters that they "believe the tether did not get released".

Since 2012, the European Space Agency has been working on the design of a mission to remove large space debris from orbit. The mission, e.Deorbit, is scheduled for launch during 2023 with an objective to remove debris heavier than 4,000 kilograms (8,800 lb) from LEO. Several capture techniques are being studied, including a net, a harpoon and a combination robot arm and clamping mechanism.

Harpoon

The RemoveDEBRIS mission plan is to test the efficacy of several ADR technologies on mock targets in low Earth orbit. In order to complete its planned experiments the platform is equipped with a net, a harpoon, a laser ranging instrument, a dragsail, and two CubeSats (miniature research satellites). The mission was launched on 2 April 2018.

National and international regulation

There is no international treaty minimizing space debris. However, the United Nations Committee on the Peaceful Uses of Outer Space (COPUOS) published voluntary guidelines in 2007, using a variety of earlier national regulatory attempts at developing standards for debris mitigation. As of 2008, the committee was discussing international "rules of the road" to prevent collisions between satellites. By 2013, a number of national legal regimes existed, typically instantiated in the launch licenses that are required for a launch in all spacefaring nations.

The U.S. issued a set of standard practices for civilian (NASA) and military (DoD and USAF) orbital-debris mitigation in 2001. The standard envisioned disposal for final mission orbits in one of three ways: 1) atmospheric reentry where even with "conservative projections for solar activity, atmospheric drag will limit the lifetime to no longer than 25 years after completion of mission;" 2) maneuver to a "storage orbit:" move the spacecraft to one of four very broad parking orbit ranges (2,000–19,700 km (1,200–12,200 mi), 20,700–35,300 km (12,900–21,900 mi), above 36,100 km (22,400 mi), or out of Earth orbit completely and into any heliocentric orbit; 3) "Direct retrieval: Retrieve the structure and remove it from orbit as soon as practicable after completion of mission." The standard articulated in option 1, which is the standard applicable to most satellites and derelict upper stages launched, has come to be known as the "25-year rule." The US updated the ODMSP in December 2019, but made no change to the 25-year rule even though "[m]any in the space community believe that the timeframe should be less than 25 years." There is no consensus however on what any new timeframe might be.

In 2002, the European Space Agency (ESA) worked with an international group to promulgate a similar set of standards, also with a "25-year rule" applying to most Earth-orbit satellites and upper stages. Space agencies in Europe began to develop technical guidelines in the mid-1990s, and ASI, UKSA, CNES, DLR and ESA signed a "European Code of Conduct" in 2006, which was a predecessor standard to the ISO international standard work that would begin the following year. In 2008, ESA further developed "its own "Requirements on Space Debris Mitigation for Agency Projects" which "came into force on 1 April 2008."

Germany and France have posted bonds to safeguard the property from debris damage. The "direct retrieval" option (option no. 3 in the US "standard practices" above) has rarely been done by any spacefaring nation (exception, USAF X-37) or commercial actor since the earliest days of spaceflight due to the cost and complexity of achieving direct retrieval, but the ESA has scheduled a 2025 demonstration mission (Clearspace-1) to do this with a single small 100 kg (220 lb) derelict upper stage at a projected cost of €120 million not including the launch costs.

By 2006, the Indian Space Research Organization (ISRO) had developed a number of technical means of debris mitigation (upper stage passivation, propellant reserves for movement to graveyard orbits, etc.) for ISRO launch vehicles and satellites, and was actively contributing to inter-agency debris coordination and the efforts of the UN COPUOS committee.

In 2007, the ISO began preparing an international standard for space-debris mitigation. By 2010, ISO had published "a comprehensive set of space system engineering standards aimed at mitigating space debris. [with primary requirements] defined in the top-level standard, ISO 24113." By 2017, the standards were nearly complete. However, these standards are not binding on any party by ISO or any international jurisdiction. They are simply available for use in any of a variety of voluntary ways. They "can be adopted voluntarily by a spacecraft manufacturer or operator, or brought into effect through a commercial contract between a customer and supplier, or used as the basis for establishing a set of national regulations on space debris mitigation."

The voluntary ISO standard also adopted the "25-year rule" for the "LEO protected region" below 2,000 km (1,200 mi) altitude that has been previously (and still is, as of 2019) used by the US, ESA, and UN mitigation standards, and identifies it as "an upper limit for the amount of time that a space system shall remain in orbit after its mission is completed. Ideally, the time to deorbit should be as short as possible (i.e., much shorter than 25 years)".

Holger Krag of the European Space Agency states that as of 2017 there is no binding international regulatory framework with no progress occurring at the respective UN body in Vienna.

Barriers

With the rapid development of the computer and digitalization industries, more countries and companies have engaged in space activities since the turn of the 20th century. The tragedy of the commons is an economic theory referring to a situation where maximizing self-interest through using a shared resource can finally lead to the resource degradation shared by all. Based on the theory, individuals’ rational action in space will finally lead to an irrational collective result: orbits are crowded with debris. As a common-pool resource, the Earth's orbits, especially LEO and GEO that accommodate most satellites, are nonexcludable and rivalry. To address the tragedy and ensure space sustainability, many technical approaches have been developed. And in terms of governance mechanisms, the top-down centralized one is less suitable to tackle the complex debris problem due to the increasing number of space actors. Instead, much evidence has proved that polycentric form of governance developed by Elinor Ostrom can work in space.

In the process of promoting the polycentric network, there are some existing barriers needed to be dealt with.

Incomplete data of space debris

As orbital debris is a global problem affecting both spacefaring and non-spacefaring nations, it is necessary to be handled in a worldwide context. Because of the complexity and dynamics of object movements like spacecrafts, debris, meteorites, etc., many countries and regions including the United States, Europe, Russia and China have developed their space situational awareness (SSA) to avoid potential threats in space or plan actions in advance. To a certain extent, SSA plays a role in tracking space debris. In order to build a powerful SSA system, there are two prerequisites: international cooperation and exchange of information and data. However, limitations still exist in spite of the substantially improving data quality over the past decades. Some space powers are not willing to share the information that they have collected, and those, such as the U.S., that have shared the data keep parts of it secret. Instead of joining in a coordinated way, a great deal of SSA programs and national databases run parallel to each other with some overlaps, hindering the formation of a collaborative monitoring system.

Some private actors are also trying to establish SSA systems. For example, the Space Data Association (SDA) formed in 2009 is a non-governmental entity. It currently consists of 21 global satellite operators and 4 executive members: Eutelsat, Inmarsat, Intelsat and SES. SDA is a non-profit platform, aiming to avoid radio interference and space collisions through pooling data from operators independently. Researchers suggest that it is essential to establish an international center for exchanging information on space debris because SSA networks do not completely equal debris tracking systems — the former ones focus more on active and threatening objects in space. And in terms of debris populations and defunct satellites, not very much operators have provided data.

In a polycentric governance network, a resource that cannot be holistically monitored is less possible to be well managed. Both insufficient transnational cooperation and information sharing bring resistance to addressing the debris problem. There is still a long way to go before building a global network that covers complete data and has strong interconnection and interoperability.

Insufficient participation of private actors

With the commercialization of satellites and space, the private sector is getting more interested in space activities. For example, SpaceX is planning to create a network of around 12,000 small satellites that can transmit high-speed internet to any place in the world. The proportion of commercial spacecrafts has increased from 4.6% in the 1980s to 55.6% in the 2010s. Despite the high participation rate of commercial entities, UN COPUOS once deliberately excluded them from having a voice in discussions unless being formally invited by a member state. Ostrom said that the involvement of all relevant stakeholders in the rule-design and implementation process is one of the critical elements of successful governance. The exclusion of private actors largely reduces the effectiveness of the committee's role in making collective-choice arrangements that reflect the interests of all space users.

The limited engagement of private actors slows down the process of addressing space debris to some degree. Ties existing between dissimilar stakeholders in the governance network offer access to diverse resources. Different competence among stakeholders can help allocate the tasks more reasonably. In that case, the expertise and experience of private operators are critical to help the world achieve space sustainability. The complementary strengths of different stakeholders enable the governance network to be more adaptable to changes and reach common goals more effectively. In recent years, many private actors have seen commercial opportunities of eliminating space debris. It is estimated that by 2022 the global market for debris monitoring and removal will generate a revenue of around $2.9 billion. For example, Astroscale has contracted with European and Japanese space agencies to develop the capacity of removing orbital debris. Despite that, they are still in small quantity compared to the number of those who have placed satellites in space. Privateer Space, a Hawaiian-based startup company started by American engineer Alex Fielding, space environmentalist Dr. Moriba Jah, and Apple co-founder Steve Wozniak, announced plans in September 2021 to launch hundreds of satellites into orbit in order to study space debris. However, the company stated it is in "stealth mode" and no such satellites have been launched.

Fortunately, the current space exploration is not completely driven by competition, and there still exists a chance for dialogues and cooperation among all stakeholders in both developed and developing countries, to reach an agreement on tackling space debris and assure an equitable and orderly exploration. Besides private actors, network governance does not necessarily exclude the states from playing a role. Instead, the different functions of states might promote the governance process. To improve the polycentric governance network of space debris, researchers suggest: encourage data-sharing among different national and organizational databases at the political level; develop shared standards for data collection systems to improve interoperability; enhance the participation of private actors through involving them in national and international discussions.

Environmental concerns

The continued practice of disposing of space debris on Earth in areas such as the spacecraft cemetery has raised environmental concerns. Klinger states that "the environmental geopolitics of Earth and outer space are inextricably linked by the spatial politics of privilege and sacrifice – among people, places, and institutions". Since 1971, 273 spacecraft and satellites have been directed to Point Nemo; this number includes the Mir Space Station (142 tonnes) and will include the International Space Station in 2024 (240 tonnes). In 2018, it was found that the water had 26 microplastic particles per cubic metre, meaning it is highly polluted. The prevalence of orbital debris has been likened to the terrestrial environmental phenomenon of "sacrifice zones," which are designated geographic regions with high levels of environmental degradation.

Since the 1960s, over three hundred rocket launch sites have been built globally. Among these launch sites, 17 hosted 90 launches in 2017 alone. Rocket launches affect local and global environments through the construction of necessary infrastructure, exposure of local environments to toxic residue and the dispersal of pollutants. Rockets are the only source of direct anthropogenic emissions into the stratosphere and emit ozone depleting substances such as nitrous oxide, hydrogen chloride and aluminium oxide; these substances can destroy 105 ozone molecules before depleting. Each launch showers an area concentrated within a kilometre with toxins, heavy metals, and acids. This results in localised regional acid rain, plant death, fish kills, and failed seed germination. Furthermore, studies on trace elements concentration in alligators, near NASA launch activities in Florida (USA), showed that over 50% of alligators had "greater than toxic levels" of trace elements in their liver. Similarly, research in Kazakhstan, Russia and China has found that unsymmetrical dimethylhydrazine (UDMH) has carcinogenic, mutagenic, convulsant, teratogenic, embryotoxic and DNA damaging effects on rodents living near the Baikonur Cosmodrome, Kazakhstan. It is unknown, however, at what trace concentrations these toxic effects manifest in humans or how it may bioaccumulate up the food chain. A lack of adequate resourcing to maintain safe, non-toxic environments makes these areas sacrifice zones and spaces of waste. The relative remoteness of these spaces makes them attractive launch sites, yet this "periphery" remain central to both their human and non-human inhabitants, who become "sacrificial".

At other celestial bodies

A piece of a thermal blanket that may have come from the descent stage of the Perseverance
 
Perseverance's backshell sitting upright on the surface of Jezero Crater

The issue of space debris has been raised as a mitigation challenge for missions around the Moon with the danger of increasing space debris around it.

In 2022, several elements of space debris were found on Mars, Perseverance's backshell was found on the surface of Jezero Crater, and a piece of a thermal blanket that may have come from the descent stage of the rover.

It is thought that on 4 March 2022, for the first time, human space debris – most likely a spent rocket body, Long March 3C third stage from the 2014 Chang'e 5 T1 mission – unintentionally hit the lunar surface, creating an unexpected double crater.

In popular culture

Until the End of the World (1991) is a French sci-fi drama set under the backdrop of an out-of-control Indian nuclear satellite, predicted to re-enter the atmosphere, threatening vast populated areas of the Earth.

In the Planetes, a Japanese hard science fiction manga (1999–2004) and anime (2003–2004), the story revolves around the crew of a space debris collection craft in the year 2075.

Gravity, a 2013 survival film directed by Alfonso Cuaron, is about a disaster on a space mission caused by Kessler syndrome.

In season 1 of Love, Death & Robots (2019), episode 11, "Helping Hand", revolves around an astronaut being struck by a screw from space debris which knocks her off a satellite in orbit.

Personality theories of addiction

From Wikipedia, the free encyclopedia https://en.wikipedia.org/wiki/Personality_theories_of_addiction ...