Search This Blog

Wednesday, August 24, 2022

Microgeneration

From Wikipedia, the free encyclopedia
 
A group of small-scale wind turbines providing electricity to a community in Dali, Yunnan, China
 

Microgeneration is the small-scale generation of heat and electric power by individuals, small businesses and communities to meet their own needs, as alternatives or supplements to traditional centralized grid-connected power. Although this may be motivated by practical considerations, such as unreliable grid power or long distance from the electrical grid, the term is mainly used currently for environmentally-conscious approaches that aspire to zero or low-carbon footprints or cost reduction. It differs from micropower in that it is principally concerned with fixed power plants rather than for use with mobile devices.

History

Technologies and set-up

Microgeneration technologies include small-scale wind turbines, micro hydro, solar PV systems, microbial fuel cells, ground source heat pumps, and micro combined heat and power installations. These technologies are often combined to form a hybrid power solution that can offer superior performance and lower cost than a system based on one generator.

Power plant

In addition to the electricity production plant (e.g. wind turbine and solar panel), infrastructure for energy storage and power conversion and a hook-up to the regular electricity grid is usually needed and/or foreseen. Although a hookup to the regular electricity grid is not essential, it helps to decrease costs by allowing financial recompensation schemes. In the developing world however, the start-up cost for this equipment is generally too high, thus leaving no choice but to opt for alternative set-ups.

Extra equipment needed besides the power plant

A complete PV-solar system

The whole of the equipment required to set up a working system and for an off-the-grid generation and/or a hook up to the electricity grid herefore is termed a balance of system and is composed of the following parts with PV-systems:

Energy storage apparatus

A major issue with off-grid solar and wind systems is that the power is often needed when the sun is not shining or when the wind is calm, this is generally not required for purely grid-connected systems:

or other means of energy storage (e.g. hydrogen fuel cells, Flywheel energy storage, pumped-storage hydroelectricity, compressed air tanks, ...)

For converting DC battery power into AC as required for many appliances, or for feeding excess power into a commercial power grid:

Safety equipment

Usually, in microgeneration for homes in the developing world, prefabricated house-wiring systems (as wiring harnesses or prefabricated distribution units) are used instead . Simplified house-wiring boxes and cables, known as wiring harnesses, can simply be bought and mounted into the building without requiring much knowledge about the wiring itself. As such, even people without technical expertise are able to install them. In addition, they are also comparatively cheap and offer safety advantages.

Small-scale (DIY) generation system

Wind turbine specific

With wind turbines, hydroelectric plants, ... the extra equipment needed is more or less the same as with PV-systems (depending on the type of wind turbine used), yet also include:

  • a manual disconnect switch
  • foundation for the tower
  • grounding system
  • shutoff and/or dummy-load devices for use in high wind when power generated exceeds current needs and storage system capacity.
Vibro-wind power

A new wind energy technology is being developed that converts energy from wind energy vibrations to electricity. This energy, called Vibro-Wind technology, can use winds of less strength than normal wind turbines, and can be placed in almost any location.

A prototype consisted of a panel mounted with oscillators made out of pieces of foam. The conversion from mechanical to electrical energy is done using a piezoelectric transducer, a device made of a ceramic or polymer that emits electrons when stressed. The building of this prototype was led by Francis Moon, professor of mechanical and aerospace engineering at Cornell University. Moon's work in Vibro-Wind Technology was funded by the Atkinson Center for a Sustainable Future at Cornell. Vibro-wind power is not yet commercially viable and in early development stages. Significant progress will be needed to commercialize this early stage venture.

Possible set-ups

Several microgeneration set-ups are possible. These are:

  • Off-the-grid set-ups which include:
    • Off-the grid set-ups without energy storage (e.g., battery, ...)
    • Off-the grid set-ups with energy storage (e.g., battery, ...)
    • Battery charging stations 
  • Grid-connected set-ups which include:
    • Grid connected with backup to power critical loads
    • Grid-connected set-ups without financial recompensation scheme
    • Grid-connected set-ups with net metering
    • Grid connected set-ups with net purchase and sale

All set-ups mentioned can work either on a single power plant or a combination of power plants (in which case it is called a hybrid power system). For safety, grid-connected set-ups must automatically switch off or enter an "anti-islanding mode" when there is a failure of the mains power supply. For more about this, see the article on the condition of islanding.

Costs

Depending on the set-up chosen (financial recompensation scheme, power plant, extra equipment), prices may vary. According to Practical Action, microgeneration at home which uses the latest in cost saving-technology (wiring harnesses, ready boards, cheap DIY-power plants, e.g. DIY wind turbines) the household expenditure can be extremely low-cost. In fact, Practical Action mentions that many households in farming communities in the developing world spend less than $1 on electricity per month. However, if matters are handled less economically (using more commercial systems/approaches), costs will be dramatically higher. In most cases however, financial advantage will still be done using microgeneration on renewable power plants; often in the range of 50-90% as local production has no electricity transportation losses on long distance power lines or energy losses from the Joule effect in transformers where in general 8-15% of the energy is lost.

In the UK, the government offers both grants and feedback payments to help businesses, communities and private homes to install these technologies. Businesses can write the full cost of installation off against taxable profits whilst homeowners receive a flat-rate grant or payments per kW h of electricity generated and paid back into the national grid. Community organizations can also receive up to £200,000 in grant funding.

In the UK, the Microgeneration Certification Scheme provides approval for Microgeneration Installers and Products which is a mandatory requirement of funding schemes such as the Feed in Tariffs and Renewable Heat Incentive.

Grid parity

Grid parity (or socket parity) occurs when an alternative energy source can generate electricity at a levelized cost of energy (LCOE) that is less than or equal to the price of purchasing power from the electricity grid. Reaching grid parity is considered to be the point at which an energy source becomes a contender for widespread development without subsidies or government support. It is widely believed that a wholesale shift in a generation to these forms of energy will take place when they reach grid parity.

Grid parity has been reached in some locations with on-shore wind power around 2000, and with solar power it was achieved for the first time in Spain in 2013.

Comparison with large-scale generation


microgeneration large-scale generation Notes
Other names Distributed generation Centralized generation
Economy of scale Necessitates mass production of generators which will create an associated environmental impact. Systems are less expensive when produced in quantity. Depends on power source - generally more economical given the larger scale of the generators. Photovoltaics, similar panels are used in all applications are affected less by this whilst wind power, where power scales approximately as the squre of size is affected greatly.
Ability to meet needs supply within the limits of the installed generation or storage
  • For wind and solar energy, the actual production is only a fraction of nameplate capacity.
  • Fuel based systems are fully dispatchable
  • Solar panels are simple and reliable, they can provide a little electricity at a reasonable cost.
generally more flexible supply within the limits of local transmission as long as the grid is effectively maintained
Environmental impact larger number of smaller devices may lead to greater impact from device production especially with the wind. larger generators can have more local impact, transmission equipment can also disrupt areas, however, the overall impact is likely reduced due to economies of scale. Commentators claim that householders who buy their electricity with green energy tariffs can reduce their carbon usage further than with microgeneration and at a lower cost.
Transmission losses Proximity to end user typically closer resulting in potentially fewer losses. (Potentially, because the lack of scale at each individual installation may lead to use of less efficient transmission technologies.) A significant proportion of electrical power is lost during transmission (approximately 8% in the United Kingdom according to BBC Radio 4 Today programme in March 2006).
Changes to Grid reduces the transmission load, and thus reduces the need for grid upgrades increases the power transmitted, and thus increases the need for grid upgrades
Grid failure event Electricity may still be available to local area in many circumstances Electricity may be not available due to grid
Generator failure event Electricity will not be available except in hybrid scenario Electricity is very likely to be available due to grid redundancy
Consumer choices May choose to purchase any legal system May choose to purchase offerings of the power companies depending on market
Reliability and Maintenance requirements photovoltaics, Stirling engines, and certain other systems, are usually extremely reliable, and can generate electric power continuously for many thousands of hours with little or no maintenance. However, unreliable systems will incur additional maintenance labor and costs. Managed by power company. Grid reliability varies with location.
Waste Heat by-product Can be used for heating purposes in cold climates, thus greatly increasing efficiency and offsetting energy total costs. This method is known as micro combined heat and power (microCHP).

Used in some privately owned industrial combined heat and power (CHP) installations. It is also used in large-scale applications where it's called district heating and uses the heat that is normally exhausted by inefficient powerplants.


Most forms of microgeneration can dynamically balance the supply and demand for electric power, by producing more power during periods of high demand and high grid prices, and less power during periods of low demand and low grid prices. This "hybridized grid" allows both microgeneration systems and large power plants to operate with greater energy efficiency and cost effectiveness than either could alone.

Domestic self-sufficiency

Horizontal Axis Micro-Windmill in Lahore, 1000Watt Rated Output

Microgeneration can be integrated as part of a self-sufficient house and is typically complemented with other technologies such as domestic food production systems (permaculture and agroecosystem), rainwater harvesting, composting toilets or even complete greywater treatment systems. Domestic microgeneration technologies include: photovoltaic solar systems, small-scale wind turbines, micro combined heat and power installations, biodiesel and biogas.

A small Quietrevolution QR5 Gorlov type vertical axis wind turbine in Bristol, England. Measuring 3 m in diameter and 5 m high, it has a nameplate rating of 6.5 kW to the grid.

Private generation decentralizes the generation of electricity and may also centralize the pooling of surplus energy. While they have to be purchased, solar shingles and panels are both available. Capital cost is high, but saves in the long run. With appropriate power conversion, solar PV panels can run the same electric appliances as electricity from other sources.

Passive solar water heating is another effective method of utilizing solar power. The simplest method is the solar (or a black plastic) bag. Set between 5 to 20 litres (1 to 5 US gal) out in the sun and allow to heat. Perfect for a quick warm shower.

The ‘breadbox’ heater can be constructed easily with recycled materials and basic building experience. Consisting of a single or array of black tanks mounted inside a sturdy box insulated on the bottom and sides. The lid, either horizontal or angled to catch the most sun, should be well sealed and of a transparent glazing material (glass, fiberglass, or high temp resistant molded plastic). Cold water enters the tank near the bottom, heats and rises to the top where it is piped back into the home.

Ground source heat pumps exploit stable ground temperatures by benefiting from the thermal energy storage capacity of the ground. Typically ground source heat pumps have a high initial cost and are difficult to install by the average homeowner. They use electric motors to transfer heat from the ground with a high level of efficiency. The electricity may come from renewable sources or from external non-renewable sources.

Fuel

Biodiesel is an alternative fuel that can power diesel engines and can be used for domestic heating. Numerous forms of biomass, including soybeans, peanuts, and algae (which has the highest yield), can be used to make biodiesel. Recycled vegetable oil (from restaurants) can also be converted into biodiesel.

Biogas is another alternative fuel, created from the waste product of animals. Though less practical for most homes, a farm environment provides a perfect place to implement the process. By mixing the waste and water in a tank with space left for air, methane produces naturally in the airspace. This methane can be piped out and burned, and used for a cookfire.

Government policy

Policymakers were accustomed to an energy system based on big, centralised projects like nuclear or gas-fired power stations. A change of mindsets and incentives are bringing microgeneration into the mainstream. Planning regulations may also require streamlining to facilitate the retrofitting of microgenerating facilities onto homes and buildings.

Most of developed countries, including Canada (Alberta), the United Kingdom, Germany, Poland, Israel and USA have laws allowing microgenerated electricity to be sold into the national grid.

Alberta, Canada

In January 2009, the Government of Alberta's Micro-Generation Regulation came into effect, setting rules that allow Albertans to generate their own environmentally friendly electricity and receive credit for any power they send into the electricity grid.

Poland

In December 2014, the Polish government will vote on a bill which calls for microgeneration, as well as large scale wind farms in the Baltic Sea as a solution to cut back on CO2 emissions from the country's coal plants as well as to reduce Polish dependence on Russian gas. Under the terms of the new bill, individuals and small businesses which generate up to 40 kW of 'green' energy will receive 100% of market price for any electricity they feed back into the grid, and businesses who set up large-scale offshore wind farms in the Baltic will be eligible for subsidization by the state. Costs of implementing these new policies will be offset by the creation of a new tax on non-sustainable energy use.

United States

The United States has inconsistent energy generation policies across its 50 states. State energy policies and laws may vary significantly with location. Some states have imposed requirements on utilities that a certain percentage of total power generation be from renewable sources. For this purpose, renewable sources include wind, hydroelectric, and solar power whether from large or microgeneration projects. Further, in some areas transferable "renewable source energy" credits are needed by power companies to meet these mandates. As a result, in some portions of the United States, power companies will pay a portion of the cost of renewable source microgeneration projects in their service areas. These rebates are in addition to any Federal or State renewable-energy income-tax credits that may be applicable. In other areas, such rebates may differ or may not be available.

United Kingdom

The UK Government published its Microgeneration Strategy in March 2006, although it was seen as a disappointment by many commentators. In contrast, the Climate Change and Sustainable Energy Act 2006 has been viewed as a positive step. To replace earlier schemes, the Department of Trade and Industry (DTI) launched the Low Carbon Buildings Programme in April 2006, which provided grants to individuals, communities and businesses wishing to invest in microgenerating technologies. These schemes have been replaced in turn by new proposals from the Department for Energy and Climate Change (DECC) for clean energy cashback via Feed-In Tariffs  for generating electricity from April 2010 and the Renewable Heat Incentive  for generating renewable heat from 28 November 2011.

Feed-In Tariffs are intended to incentivise small-scale (less than 5MW), low-carbon electricity generation. These feed-in tariffs work alongside the Renewables Obligation (RO), which will remain the primary mechanism to incentivise deployment of large-scale renewable electricity generation. The Renewable Heat Incentive (RHI) in intended to incentivise the generation of heat from renewable sources. They also currently offer up to 21p per kWh from December 2011 in the Tariff for photovoltaics plus another 3p for the Export Tariff - an overall figure which could see a household earning back double what they currently pay for their electricity.

On 31 October 2011, the government announced a sudden cut in the feed-in tariff from 43.3p/kWh to 21p/kWh with the new tariff to apply to all new solar PV installations with an eligibility date on or after 12 December 2011.

Prominent British politicians who have announced they are fitting microgenerating facilities to their homes include the Conservative party leader, David Cameron, and the Labour Science Minister, Malcolm Wicks. These plans included small domestic sized wind turbines. Cameron, before becoming Prime Minister in the 2010 general elections, had been asked during an interview on BBC One's The Politics Show on October 29, 2006, if he would do the same should he get to 10 Downing Street. “If they’d let me, yes,” he replied.

In the December 2006 Pre-Budget Report the government announced that the sale of surplus electricity from installations designed for personal use, would not be subject to Income Tax. Legislation to this effect has been included in the Finance Bill 2007.

In popular culture

Several movies and TV shows such as The Mosquito Coast, Jericho, The Time Machine and Beverly Hills Family Robinson have done a great deal in raising interest in microgeneration among the general public. Websites such as Instructables and Practical Action propose DIY solutions that can lower the cost of microgeneration, thus increasing its popularity. Specialised magazines such as OtherPower and Home Power also provide practical advice and guidance.

Environmental impact of the petroleum industry

From Wikipedia, the free encyclopedia
https://en.wikipedia.org/wiki/Environmental_impact_of_the_petroleum_industry

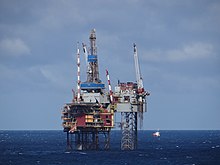
Flaring of gas from offshore oil extraction platforms
 
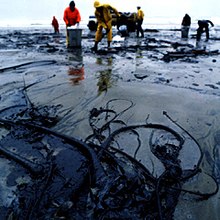
A beach after an oil spill.
 
Accumulation of plastic waste on a beach.

The environmental impact of the petroleum industry is extensive and expansive due to petroleum having many uses. Crude oil and natural gas are primary energy and raw material sources that enable numerous aspects of modern daily life and the world economy. Their supply has grown quickly over the last 150 years to meet the demands of rapidly increasing human population, creativity, and consumerism.

Substantial quantities of toxic and non-toxic waste are generated during the extraction, refinement, and transportation stages of oil and gas. Some industry by-products, such as volatile organic compounds, nitrogen & sulfur compounds, and spilled oil can pollute air, water, and soil at levels that are harmful to life where improperly managed. Climate warming, ocean acidification, and sea level rise are global changes enhanced by the industry's emissions of greenhouse gases like carbon dioxide (CO2) and methane, and micro-particulate aerosols like black carbon.

Among all human activities, fossil fuel combustion is the largest contributor to the ongoing buildup of carbon in the earth's biosphere. The International Energy Agency and others report that oil & gas use comprised over 55% (18 Billion Tons) of the record 32.8 Billion Tons (BT) of CO2 released into the atmosphere from all energy sources during year 2017. Coal use comprised most of the remaining 45%. Total emissions continue to rise nearly every year: up another 1.7% to 33.1 BT in 2018.

Through its own operations, the petroleum industry directly contributed about 8% (2.7 BT) of the 32.8 BT in 2017. Also, due to its intentional and other releases of natural gas, the industry directly contributed at least 79 Million Tons of methane (2.4 BT CO2-equivalent) that same year; an amount equal to about 14% of all known anthropogenic and natural emissions of the potent warming gas.

Along with fuels like gasoline and liquified natural gas, petroleum enables many consumer chemicals and products, such as fertilizers and plastics. Most alternative technologies for energy generation, transportation, and storage can only be realized at this time because of its diverse usefulness. Conservation, efficiency, and minimizing waste impacts of petroleum products are effective industry and consumer actions toward achieving better environmental sustainability.

General Issues

Toxic compounds

Petroleum distillates can create a sheen on the surface of water as a thin layer creating an optical phenomenon called interphase.

Petroleum is a complex mixture of many components . These components include straight chained, branched, cyclic, monocyclic aromatic and polycyclic aromatic hydrocarbons. The toxicity of oils can be understood using the toxic potential or the toxicity of each individual component of oil at the water solubility of that component. There are many methods that can be used to measure the toxicity of crude oil and other petroleum related products. Certain studies analyzing levels of toxicity can use the target lipid model or colorimetric analysis using colored-dyes in order to assess toxicity and biodegradability.

Different oils and petroleum-related products have different levels of toxicity. Levels of toxicity are influenced by many factors such as weathering, solubility, as well as chemical properties such as persistence. Increased weathering tends to decrease levels of toxicity as more soluble and lower molecular weight substances are removed. Highly soluble substances tend to have higher levels of toxicity than substances that are not very soluble in water. Generally oils that have longer carbon chains and with more benzene rings have higher levels of toxicity. Benzene is the petroleum-related product with the highest level of toxicity. Other substances other than benzene which are highly toxic are toluene, methylbenzene and xylenes (BETX). Substances with the lowest toxicity are crude oil and motor oil.

Despite varying levels of toxicity amongst different variants of oil, all petroleum -derived products have adverse impacts on human health and the ecosystem. Examples of adverse effects are oil emulsions in digestive systems in certain mammals might result in decreased ability to digest nutrients that might lead to death of certain mammals. Further symptoms include capillary ruptures and hemorrhages. Ecosystem food chains can be affected due to a decrease in algae productivity therefore threatening certain species. Oil is "acutely lethal" to fish - that is, it kills fish quickly, at a concentration of 4000 parts per million (ppm) (0.4%). The toxicity of petroleum related products threaten human health. Many compounds found in oil are highly toxic and can cause cancer (carcinogenic) as well as other diseases. Studies in Taiwan link proximity to oil refineries to premature births. Crude oil and petroleum distillates cause birth defects.

Benzene is present in both crude oil and gasoline and is known to cause leukaemia in humans. The compound is also known to lower the white blood cell count in humans, which would leave people exposed to it more susceptible to infections. "Studies have linked benzene exposure in the mere parts per billion (ppb) range to terminal leukaemia, Hodgkin's lymphoma, and other blood and immune system diseases within 5-15 years of exposure."

Fossil gas and oil naturally contain small amounts of radioactive elements which are released during mining. High concentration of these elements in brine is a technological and environmental concern.

Greenhouse gases

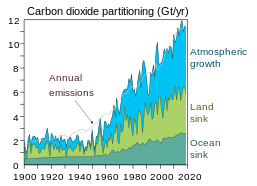
Carbon dioxide emissions and partitioning
Emissions of CO2 have been caused by different sources ramping up one after the other (Global Carbon Project)
 
Partitioning of CO2 emissions show that most emissions are being absorbed by carbon sinks, including plant growth, soil uptake, and ocean uptake (Global Carbon Project)

Petroleum extraction disrupts the equilibrium of earth's carbon cycle by transporting sequestered geologic carbon into the biosphere. The carbon is used by consumers in various forms and a large fraction is combusted into the atmosphere; thus creating massive amounts of the greenhouse gas, carbon dioxide, as a waste product. Natural gas (mostly methane) is an even more potent greenhouse house when it escapes into the atmosphere prior to being burned.

Since the industrial age began circa 1750–1850 with growing wood and coal use, the atmospheric concentration of carbon dioxide and methane have increased about 50% and 150%, respectively, above their relatively stable levels of the prior 800,000+ years. Each is currently increasing at a rate of about 1% every year, since about half of the added carbon has been absorbed by Earth's land vegetation and ocean sinks. The growth in annual emissions has also been so rapid that the total amount of fossil carbon extracted in the last 30 years exceeds the total amount extracted during all prior human history.

Microplastics

Microplastics in Mljet National Park, Croatia

Petroleum has enabled plastics to be used to create a wide range and massive quantity of consumer items at extremely low production costs. Annual growth rates in production have been near 10%, and are driven largely by single-use plastics for which improper disposal is common.

The majority of plastic is not recycled, and it fragments into smaller and smaller pieces over time. Microplastics are particles that are smaller than 5 mm in size. Microplastics are observable in air, water, and soil samples gathered from nearly every location on earth's surface, and also increasingly within biological samplings. Long-term effects from the environmental buildup of plastic waste are under scientific evaluation but thus far mostly unknown. Microplastics are concern because they have a tendency to adsorb pollutants on their surface, as well as an ability to bioaccumulate.

Microplastics can be found in the ocean and marine habitats.

When particles are ingested by marine organisms they usually end up in tissues such as the digestive glands, circulatory system, gills and guts. When these organisms are consumed and shifted upwards in the food chain, they end up creating an exposure risk towards bigger organisms and ultimately humans. Microplastics possess many risks to various organisms. They are known to disrupt algal feeding, increase mortality and lower fertility in copepods. Amongst mussels, microplastics are known to interrupt filtration and induce inflammatory responses. There is still a lack of data in how these particles ultimately affect humans because most marine organisms are gutted before consumed. In spite of that, their environmental effects are well documented and the extent of their damage is well understood.

Local and regional impacts

Some harmful impacts of petroleum can be limited to the geographic locations where it is produced, consumed, and/or disposed. In many cases, the impacts may be reduced to safe levels when consumers practice responsible use and disposal. Producers of specific products can further reduce the impacts through life cycle assessment and environmental design practices.

Air pollution

Petroleum diesel exhaust from a truck

Exhaust emissions

Emissions from the petroleum industry occur in every chain of the oil-producing process from the extraction to the consumption phase . In the extraction phase, gas venting and flaring release not only methane and carbon dioxide, but various other pollutants like nitrous oxides and aerosols. Certain by-products include carbon monoxide and methanol. When oil or petroleum distillates are combusted, usually the combustion is not complete and the chemical reaction leaves by-products which are not water or carbon dioxide. However, despite the large amounts of pollutants, there is variation in the amount and concentration of certain pollutants. In the refinement stages of petroleum also contributes to large amounts of pollution in urban areas. This increase in pollution has adverse effects on human health due to the toxicity of oil. A study investigating the effects of oil refineries in Taiwan. The study found an increased occurrence of premature births in mothers that lived in close proximity to oil refineries than mothers who lived away from oil refineries. There were also differences observed in sex ratios and the birth weight of the children. Also, fine particulates of soot blacken humans' and other animals' lungs and cause heart problems or death. Soot is cancer causing (carcinogenic).

Vapor intrusion

Volatile organic compounds (VOCs) are gases or vapours emitted by various solids and liquids." Petroleum hydrocarbons such as gasoline, diesel, or jet fuel intruding into indoor spaces from underground storage tanks or brownfields threaten safety (e.g., explosive potential) and causes adverse health effects from inhalation.

Acid rain

Trees killed by acid rain, an unwanted side effect of burning petroleum

The combustion process of petroleum , coal , and wood is responsible for increased occurrence of acid rain. Combustion causes an increased amount of nitrous oxide, along with sulfur dioxide from the sulfur in the oil. These by-products combine with water in the atmosphere to create acid rain. The increased concentrations of nitrates and other acidic substances have significant effects on the pH levels of rainfall. Data samples analyzed from the United States and Europe from the past 100 years and showed an increase in nitrous oxide emissions from combustion. The emissions were large enough to acidify the rainfall. The acid rain has adverse impacts on the larger ecosystem. For example, acid rain can kill trees, and can kill fish by acidifying lakes. Coral reefs are also destroyed by acid rain. Acid rain also leads to the corrosion of machinery and structures (large amounts of capital) and to the slow destruction of archeological structures like the marble ruins of Rome and Greece.

Oil spills

An oil spill is the release of a liquid petroleum hydrocarbon into the environment, especially marine areas, due to human activity, and is a form of pollution. The term is usually applied to marine oil spills, where oil is released into the ocean or coastal waters, but spills may also occur on land. Oil spills may be due to releases of crude oil from tankers, pipelines, railcars, offshore platforms, drilling rigs and wells, as well as spills of refined petroleum products (such as gasoline, diesel) and their by-products, heavier fuels used by large ships such as bunker fuel, or the spill of any oily refuse or waste oil.

Major oil spills include, Lakeview Gusher, Gulf War oil spill, and the Deepwater Horizon oil spill. Spilt oil penetrates into the structure of the plumage of birds and the fur of mammals, reducing its insulating ability, and making them more vulnerable to temperature fluctuations and much less buoyant in the water. Cleanup and recovery from an oil spill is difficult and depends upon many factors, including the type of oil spilled, the temperature of the water (affecting evaporation and biodegradation), and the types of shorelines and beaches involved. Other factors influencing the rate of long-term contamination is the continuous inputs of petroleum residues and the rate at which the environment can clean itself. Spills may take weeks, months or even years to clean up.

Waste oil

Waste oil in the form of motor oil

Waste oil is oil containing not only breakdown products but also impurities from use. Some examples of waste oil are used oils such as hydraulic oil, transmission oil, brake fluids, motor oil, crankcase oil, gear box oil and synthetic oil. Many of the same problems associated with natural petroleum exist with waste oil. When waste oil from vehicles drips out engines over streets and roads, the oil travels into the water table bringing with it such toxins as benzene. This poisons both soil and drinking water. Runoff from storms carries waste oil into rivers and oceans, poisoning them as well.

Produced water and drilling waste discharges

North Sea Oil Rig

Produced water (PW) discharges from petroleum extraction results in PAH (Poly-aromatic Hydrocarbon) emission in the ocean. Approximately 400 million tons of PW discharge is released annually from oil-fields in the North Sea, UK and Norwegian discharges combined. PW discharge is the largest emission event in the marine environment world and it is a result of offshore oil and gas production. The composition of materials in the PW depends on the characteristics of the region. However, PW mainly contains a mixture of a few select products such as formation water, oil, gas, brine water and added chemicals. Just like PW, formation water composition also depends on its surroundings although, it mainly consists of dissolved inorganic and organic compounds. PW was responsible for releasing 129 tons of PAHs in 2017. Due to the presence of harmful chemicals in PW, it is responsible for evoking toxic responses in the surrounding environment. For example, surveys done in the Norwegian Continental Shelf (NCS) found that PAHs released by PW were responsible for biological changes in mussel and Atlantic cod. Formation of PAH burden caused DNA damage and digestive-gland histochemistry in mussel. PAHs also pose a serious threat to human health. Long term exposure to PAHs have been linked to a series of health problems such as lung, skin, bladder, gastrointestinal cancer.

Global impacts

Climate change

The emissions from the extraction, refinement, transportation, and consumption of petroleum have caused changes in our environment's natural greenhouse gas levels, most significantly our carbon dioxide emissions. Carbon dioxide is a greenhouse gas that attracts heat in order to keep our planet's temperature from below freezing but the excess amount of carbon dioxide in our atmosphere from things like the petroleum industry have caused an imbalance. Swedish Nobel chemist Svante Arrhenius created a mathematical model that showed an increase of carbon dioxide results in an increase in surface temperature. Furthermore, these emissions are at a record high and the IPCC (2007) states that earth's climate system will heat up by 3 degrees Celsius for a doubling of carbon dioxide. These numbers are troubling as the resulting climate change will cause more intense hurricanes and storms, increased droughts and heat waves, frequent flooding, and more severe wildfires.

Ocean acidification

Following the carbon cycle, carbon dioxide enters our oceans where it reacts with the water molecules and produces a substance called carbonic acid. This increase in carbonic acid had dropped the pH of our oceans, causing increased acidity. Since the Industrial Revolution, the start of the petroleum industry, the pH of our oceans have dropped from 8.21 to 8.10. It may not seem like much but this change shows a 30% increase in acidity which has caused a lot of problems for our sea life. As our oceans continue to acidify there are less carbonate ions available for calcifying meaning that organisms have a hard time building and maintaining their shells and skeletons. Based on of our current levels of carbon dioxide our oceans could have a pH level of 7.8 by the end of this century.

Subsidies

Modern human societies utilize cheap and abundant energy to promote economic growth and maintain political stability. Government's and economic institutions around the world lower prices and increase supplies of fossil fuels for both consumers and producers by providing various forms of financial support to the industry. These include such traditional subsidies as direct payments, tax preferences, depletion allowances, research & development grants, and the removal of existing environmental protections. Considering all forms of support, the largest assistance to fossil fuels arises from the failure of governments to pass along most costs from the environmental and human-health impacts of the waste.

Accounting by the International Energy Agency and OECD indicates that traditional subsidies throughout the world amounted to about $400–600 Billion annually during years 2010–2015, and remained near $400 Billion in year 2018 with 40% going to oil. By comparison, a working group at the International Monetary Fund estimates that all support to the fossil-fuel industry totaled about $5.2 Trillion (6.4% of global gross domestic product) during year 2017. The largest subsidizers were China, the United States, Russia, the European Union, and India which together accounted for about 60% of the total.

According to the theory of ideal market competition, accurate prices could act to drive more responsible industry and consumer choices that reduce waste and long-term scarcity. Eliminating subsidies and implementing carbon fees to realize accurate prices would have their most direct effects from the supply side of the industry. By contrast, the objective of some carbon tax and carbon trading mechanisms is to enforce pricing accuracy from the consumption side.

Mitigation

Conservation and phasing out

Many countries across the World have subsidies and policies designed to reduce the use of petroleum and fossil fuels. Examples include China which switched from providing subsidies for fossil fuels to providing subsidies for renewable energy. Other examples include Sweden which created laws which are designed to eventually phase out the use of petroleum, which is known as the 15-year plan. These policies have their benefits and their challenges and every country has had their different experiences. In China, positive benefits were observed in the energy system due to higher renewable energy subsidies in three ways. It made consumption of energy cleaner due to moving for cleaner sources. Secondly, it helped increase the efficiency and third it resolved the issue of imbalanced distribution and consumption. However, from the Chinese experience, there were challenges observed. These challenges included economic challenges like initially lower economic benefits for subsidies from renewable energy than for oil. Other challenges included a high cost of research and development, the uncertainty of cost and potentially high-risk investments. These factors make the development of renewable energy very dependent on government support. However, aims of phasing out fossil fuels and petroleum use may also present economic benefits such as increased investment. This strategy may help achieve social goals for example reduction in pollution which might translate to better environmental and health outcomes.

Another option for conserving energy and phasing out petroleum use is adopting new technologies in order to increase efficiency. This can include changing production methods and modes of transportation.

Substitution of other energy sources

Alternatives to petroleum can include using other “cleaner” energy sources such as renewable energy, natural gas or biodiesel. Some of the alternatives have their strengths and limitations that might impact on the possibility of adopting them in the future.

Using corn-based ethanol might be an alternative to using petroleum. However, studies that concluded that corn-based ethanol uses less net energy do not factor in the co-products of production. Current corn-ethanol technologies are much less petroleum intensive than gasoline however have the GHG emission levels similar to gasoline. The literature is mainly unclear what the GHG emission changes would be by adopting corn-based ethanol for biodiesel. Some studies report a 20% increase in GHG emissions and some report a 32% decrease. However, the actual number might be a 13% decrease in GHG emissions which is not a significant decrease. The future of biodiesel might be adopting cellulose ethanol technology to produce biodiesel as that technology will contribute to a decrease in emissions.

Renewable energy alternatives also exist. These include solar energy, wind energy, geothermal and hydroelectricity as well as other sources. These sources are said to have much lower emissions, and almost minimal secondary by products. The production of renewable energy is projected to grow in nearly every region in the World. Natural gas is also seen as a potential alternative to oil. Natural gas is much cleaner than oil in terms of emissions. However natural gas has its limitation in terms of mass production. For example, in order to switch from crude oil to natural gas there are technical and network changes that need to occur before the implementation can be complete. Two possible strategies are to first develop the end use technology first or second is to completely change the fuel infrastructure.

Use of biomass instead of petroleum

Biomass is becoming a potential option as a substitute for petroleum. This is due to the increased environmental impacts of petroleum and the desire to reduce the use of petroleum. Potential substitutes include cellulose from fibrous plant materials as a substitute for oil-based products. Plastics can be created by cellulose instead of oil and plant fat can be substituted for oil to fuel cars. In order for biomass to succeed there needs to be an integration of different technologies to different biomass feedstock in to produce different bioproducts. Incentives for biomass are a decrease of carbon dioxide, need for a new energy supply and need to revitalize rural areas.

Safety measures

There is also the potential to implement many technologies as safety measures to mitigate safety and health risks of the petroleum industry. These include measures to reduce oil spills, false floors to prevent gasoline drips in the water table and double-hulled tanker ships. A relatively new technology that can mitigate air pollution is called bio-filtration. Bio filtration is where off-gasses that have biodegradable VOCs or inorganic air toxins are vented out through a biologically active material. This technology successfully used in Germany and the Netherlands mainly for odor control. There are lower costs and environmental benefits include low energy requirements.

Cloud physics

From Wikipedia, the free encyclopedia
https://en.wikipedia.org/wiki/Cloud_physics

Cloud physics is the study of the physical processes that lead to the formation, growth and precipitation of atmospheric clouds. These aerosols are found in the troposphere, stratosphere, and mesosphere, which collectively make up the greatest part of the homosphere. Clouds consist of microscopic droplets of liquid water (warm clouds), tiny crystals of ice (cold clouds), or both (mixed phase clouds). Cloud droplets initially form by the condensation of water vapor onto condensation nuclei when the supersaturation of air exceeds a critical value according to Köhler theory. Cloud condensation nuclei are necessary for cloud droplets formation because of the Kelvin effect, which describes the change in saturation vapor pressure due to a curved surface. At small radii, the amount of supersaturation needed for condensation to occur is so large, that it does not happen naturally. Raoult's law describes how the vapor pressure is dependent on the amount of solute in a solution. At high concentrations, when the cloud droplets are small, the supersaturation required is smaller than without the presence of a nucleus.

In warm clouds, larger cloud droplets fall at a higher terminal velocity; because at a given velocity, the drag force per unit of droplet weight on smaller droplets is larger than on large droplets. The large droplets can then collide with small droplets and combine to form even larger drops. When the drops become large enough that their downward velocity (relative to the surrounding air) is greater than the upward velocity (relative to the ground) of the surrounding air, the drops can fall as precipitation. The collision and coalescence is not as important in mixed phase clouds where the Bergeron process dominates. Other important processes that form precipitation are riming, when a supercooled liquid drop collides with a solid snowflake, and aggregation, when two solid snowflakes collide and combine. The precise mechanics of how a cloud forms and grows is not completely understood, but scientists have developed theories explaining the structure of clouds by studying the microphysics of individual droplets. Advances in weather radar and satellite technology have also allowed the precise study of clouds on a large scale.

History of cloud physics

The modern cloud physics began in the 19th century and was described in several publications. Otto von Guericke originated the idea that clouds were composed of water bubbles. In 1847 Augustus Waller used spider web to examine droplets under the microscope. These observations were confirmed by William Henry Dines in 1880 and Richard Assmann in 1884.

Cloud formation: how the air becomes saturated

Cooling air to its dew point

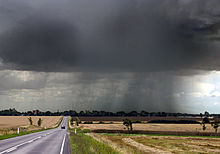
Late-summer rainstorm in Denmark. Nearly black color of base indicates main cloud in foreground probably cumulonimbus.

Adiabatic cooling: rising packets of moist air

As water evaporates from an area of Earth's surface, the air over that area becomes moist. Moist air is lighter than the surrounding dry air, creating an unstable situation. When enough moist air has accumulated, all the moist air rises as a single packet, without mixing with the surrounding air. As more moist air forms along the surface, the process repeats, resulting in a series of discrete packets of moist air rising to form clouds.

This process occurs when one or more of three possible lifting agents—cyclonic/frontal, convective, or orographic—causes air containing invisible water vapor to rise and cool to its dew point, the temperature at which the air becomes saturated. The main mechanism behind this process is adiabatic cooling. Atmospheric pressure decreases with altitude, so the rising air expands in a process that expends energy and causes the air to cool, which makes water vapor condense into cloud. Water vapor in saturated air is normally attracted to condensation nuclei such as dust and salt particles that are small enough to be held aloft by normal circulation of the air. The water droplets in a cloud have a normal radius of about 0.002 mm (0.00008 in). The droplets may collide to form larger droplets, which remain aloft as long as the velocity of the rising air within the cloud is equal to or greater than the terminal velocity of the droplets.

For non-convective cloud, the altitude at which condensation begins to happen is called the lifted condensation level (LCL), which roughly determines the height of the cloud base. Free convective clouds generally form at the altitude of the convective condensation level (CCL). Water vapor in saturated air is normally attracted to condensation nuclei such as salt particles that are small enough to be held aloft by normal circulation of the air. If the condensation process occurs below the freezing level in the troposphere, the nuclei help transform the vapor into very small water droplets. Clouds that form just above the freezing level are composed mostly of supercooled liquid droplets, while those that condense out at higher altitudes where the air is much colder generally take the form of ice crystals. An absence of sufficient condensation particles at and above the condensation level causes the rising air to become supersaturated and the formation of cloud tends to be inhibited.

Frontal and cyclonic lift

Frontal and cyclonic lift occur in their purest manifestations when stable air, which has been subjected to little or no surface heating, is forced aloft at weather fronts and around centers of low pressure. Warm fronts associated with extratropical cyclones tend to generate mostly cirriform and stratiform clouds over a wide area unless the approaching warm airmass is unstable, in which case cumulus congestus or cumulonimbus clouds will usually be embedded in the main precipitating cloud layer. Cold fronts are usually faster moving and generate a narrower line of clouds which are mostly stratocumuliform, cumuliform, or cumulonimbiform depending on the stability of the warm air mass just ahead of the front.

Convective lift

Another agent is the buoyant convective upward motion caused by significant daytime solar heating at surface level, or by relatively high absolute humidity. Incoming short-wave radiation generated by the sun is re-emitted as long-wave radiation when it reaches Earth's surface. This process warms the air closest to ground and increases air mass instability by creating a steeper temperature gradient from warm or hot at surface level to cold aloft. This causes it to rise and cool until temperature equilibrium is achieved with the surrounding air aloft. Moderate instability allows for the formation of cumuliform clouds of moderate size that can produce light showers if the airmass is sufficiently moist. Typical convection upcurrents may allow the droplets to grow to a radius of about 0.015 millimetres (0.0006 in) before precipitating as showers. The equivalent diameter of these droplets is about 0.03 millimetres (0.001 in).

If air near the surface becomes extremely warm and unstable, its upward motion can become quite explosive, resulting in towering cumulonimbiform clouds that can cause severe weather. As tiny water particles that make up the cloud group together to form droplets of rain, they are pulled down to earth by the force of gravity. The droplets would normally evaporate below the condensation level, but strong updrafts buffer the falling droplets, and can keep them aloft much longer than they would otherwise. Violent updrafts can reach speeds of up to 180 miles per hour (290 km/h). The longer the rain droplets remain aloft, the more time they have to grow into larger droplets that eventually fall as heavy showers.

Rain droplets that are carried well above the freezing level become supercooled at first then freeze into small hail. A frozen ice nucleus can pick up 0.5 inches (1.3 cm) in size traveling through one of these updrafts and can cycle through several updrafts and downdrafts before finally becoming so heavy that it falls to the ground as large hail. Cutting a hailstone in half shows onion-like layers of ice, indicating distinct times when it passed through a layer of super-cooled water. Hailstones have been found with diameters of up to 7 inches (18 cm).

Convective lift can occur in an unstable air mass well away from any fronts. However, very warm unstable air can also be present around fronts and low-pressure centers, often producing cumuliform and cumulonimbiform clouds in heavier and more active concentrations because of the combined frontal and convective lifting agents. As with non-frontal convective lift, increasing instability promotes upward vertical cloud growth and raises the potential for severe weather. On comparatively rare occasions, convective lift can be powerful enough to penetrate the tropopause and push the cloud top into the stratosphere.

Orographic lift

A third source of lift is wind circulation forcing air over a physical barrier such as a mountain (orographic lift). If the air is generally stable, nothing more than lenticular cap clouds will form. However, if the air becomes sufficiently moist and unstable, orographic showers or thunderstorms may appear.

Windy evening twilight enhanced by the Sun's angle, can visually mimic a tornado resulting from orographic lift

Non-adiabatic cooling

Along with adiabatic cooling that requires a lifting agent, there are three other main mechanisms for lowering the temperature of the air to its dew point, all of which occur near surface level and do not require any lifting of the air. Conductive, radiational, and evaporative cooling can cause condensation at surface level resulting in the formation of fog. Conductive cooling takes place when air from a relatively mild source area comes into contact with a colder surface, as when mild marine air moves across a colder land area. Radiational cooling occurs due to the emission of infrared radiation, either by the air or by the surface underneath. This type of cooling is common during the night when the sky is clear. Evaporative cooling happens when moisture is added to the air through evaporation, which forces the air temperature to cool to its wet-bulb temperature, or sometimes to the point of saturation.

Adding moisture to the air

There are five main ways water vapor can be added to the air. Increased vapor content can result from wind convergence over water or moist ground into areas of upward motion. Precipitation or virga falling from above also enhances moisture content. Daytime heating causes water to evaporate from the surface of oceans, water bodies or wet land. Transpiration from plants is another typical source of water vapor. Lastly, cool or dry air moving over warmer water will become more humid. As with daytime heating, the addition of moisture to the air increases its heat content and instability and helps set into motion those processes that lead to the formation of cloud or fog.

Supersaturation

The amount of water that can exist as vapor in a given volume increases with the temperature. When the amount of water vapor is in equilibrium above a flat surface of water the level of vapor pressure is called saturation and the relative humidity is 100%. At this equilibrium there are equal numbers of molecules evaporating from the water as there are condensing back into the water. If the relative humidity becomes greater than 100%, it is called supersaturated. Supersaturation occurs in the absence of condensation nuclei.

Since the saturation vapor pressure is proportional to temperature, cold air has a lower saturation point than warm air. The difference between these values is the basis for the formation of clouds. When saturated air cools, it can no longer contain the same amount of water vapor. If the conditions are right, the excess water will condense out of the air until the lower saturation point is reached. Another possibility is that the water stays in vapor form, even though it is beyond the saturation point, resulting in supersaturation.

Supersaturation of more than 1–2% relative to water is rarely seen in the atmosphere, since cloud condensation nuclei are usually present. Much higher degrees of supersaturation are possible in clean air, and are the basis of the cloud chamber.

There are no instruments to take measurements of supersaturation in clouds.

Supercooling

Water droplets commonly remain as liquid water and do not freeze, even well below 0 °C (32 °F). Ice nuclei that may be present in an atmospheric droplet become active for ice formation at specific temperatures in between 0 °C (32 °F) and −38 °C (−36 °F), depending on nucleus geometry and composition. Without ice nuclei, supercooled water droplets (as well as any extremely pure liquid water) can exist down to about −38 °C (−36 °F), at which point spontaneous freezing occurs.

Collision-coalescence

One theory explaining how the behavior of individual droplets in a cloud leads to the formation of precipitation is the collision-coalescence process. Droplets suspended in the air will interact with each other, either by colliding and bouncing off each other or by combining to form a larger droplet. Eventually, the droplets become large enough that they fall to the earth as precipitation. The collision-coalescence process does not make up a significant part of cloud formation, as water droplets have a relatively high surface tension. In addition, the occurrence of collision-coalescence is closely related to entrainment-mixing processes.

Bergeron process

The primary mechanism for the formation of ice clouds was discovered by Tor Bergeron. The Bergeron process notes that the saturation vapor pressure of water, or how much water vapor a given volume can contain, depends on what the vapor is interacting with. Specifically, the saturation vapor pressure with respect to ice is lower than the saturation vapor pressure with respect to water. Water vapor interacting with a water droplet may be saturated, at 100% relative humidity, when interacting with a water droplet, but the same amount of water vapor would be supersaturated when interacting with an ice particle. The water vapor will attempt to return to equilibrium, so the extra water vapor will condense into ice on the surface of the particle. These ice particles end up as the nuclei of larger ice crystals. This process only happens at temperatures between 0 °C (32 °F) and −40 °C (−40 °F). Below −40 °C (−40 °F), liquid water will spontaneously nucleate, and freeze. The surface tension of the water allows the droplet to stay liquid well below its normal freezing point. When this happens, it is now supercooled liquid water. The Bergeron process relies on super cooled liquid water (SLW) interacting with ice nuclei to form larger particles. If there are few ice nuclei compared to the amount of SLW, droplets will be unable to form. A process whereby scientists seed a cloud with artificial ice nuclei to encourage precipitation is known as cloud seeding. This can help cause precipitation in clouds that otherwise may not rain. Cloud seeding adds excess artificial ice nuclei which shifts the balance so that there are many nuclei compared to the amount of super cooled liquid water. An over seeded cloud will form many particles, but each will be very small. This can be done as a preventative measure for areas that are at risk for hail storms.

Cloud classification

Clouds in the troposphere, the atmospheric layer closest to Earth, are classified according to the height at which they are found, and their shape or appearance. There are five forms based on physical structure and process of formation. Cirriform clouds are high, thin and wispy, and are seen most extensively along the leading edges of organized weather disturbances. Stratiform clouds are non-convective and appear as extensive sheet-like layers, ranging from thin to very thick with considerable vertical development. They are mostly the product of large-scale lifting of stable air. Unstable free-convective cumuliform clouds are formed mostly into localized heaps. Stratocumuliform clouds of limited convection show a mix of cumuliform and stratiform characteristics which appear in the form of rolls or ripples. Highly convective cumulonimbiform clouds have complex structures often including cirriform tops and stratocumuliform accessory clouds.

These forms are cross-classified by altitude range or level into ten genus types which can be subdivided into species and lesser types. High-level clouds form at altitudes of 5 to 12 kilometers. All cirriform clouds are classified as high-level and therefore constitute a single cloud genus cirrus. Stratiform and stratocumuliform clouds in the high level of the troposphere have the prefix cirro- added to their names yielding the genera cirrostratus and cirrocumulus. Similar clouds found in the middle level (altitude range 2 to 7 kilometers) carry the prefix alto- resulting in the genus names altostratus and altocumulus.

Low level clouds have no height-related prefixes, so stratiform and stratocumuliform clouds based around 2 kilometres or lower are known simply as stratus and stratocumulus. Small cumulus clouds with little vertical development (species humilis) are also commonly classified as low level.

Cumuliform and cumulonimbiform heaps and deep stratiform layers often occupy at least two tropospheric levels, and the largest or deepest of these can occupy all three levels. They may be classified as low or mid-level, but are also commonly classified or characterized as vertical or multi-level. Nimbostratus clouds are stratiform layers with sufficient vertical extent to produce significant precipitation. Towering cumulus (species congestus), and cumulonimbus may form anywhere from near the surface to intermediate heights of around 3 kilometres. Of the vertically developed clouds, the cumulonimbus type is the tallest and can virtually span the entire troposphere from a few hundred metres above the ground up to the tropopause. It is the cloud responsible for thunderstorms.

Some clouds can form at very high to extreme levels above the troposphere, mostly above the polar regions of Earth. Polar stratospheric clouds are seen but rarely in winter at altitudes of 18 to 30 kilometers, while in summer, noctilucent clouds occasionally form at high latitudes at an altitude range of 76 to 85 kilometers. These polar clouds show some of the same forms as seen lower in the troposphere.

Homospheric types determined by cross-classification of forms and levels.

Forms and levels Stratiform
non-convective
Cirriform
mostly non-convective
Stratocumuliform
limited-convective
Cumuliform
free-convective
Cumulonimbiform
strong-convective
Extreme level PMC: Noctilucent veils Noctilucent billow or whirls Noctilucent bands

Very high level Nitric acid & water PSC Cirriform nacreous PSC Lenticular nacreous PSC

High-level Cirrostratus Cirrus Cirrocumulus

Mid-level Altostratus
Altocumulus

Low-level Stratus
Stratocumulus Cumulus humilis or fractus
Multi-level or moderate vertical Nimbostratus

Cumulus mediocris
Towering vertical


Cumulus congestus Cumulonimbus

Homospheric types include the ten tropospheric genera and several additional major types above the troposphere. The cumulus genus includes four species that indicate vertical size and structure.

Determination of properties

Satellites are used to gather data about cloud properties and other information such as Cloud Amount, height, IR emissivity, visible optical depth, icing, effective particle size for both liquid and ice, and cloud top temperature and pressure.

Detection

Data sets regarding cloud properties are gathered using satellites, such as MODIS, POLDER, CALIPSO or ATSR. The instruments measure the radiances of the clouds, from which the relevant parameters can be retrieved. This is usually done by using inverse theory.

The method of detection is based on the fact that the clouds tend to appear brighter and colder than the land surface. Because of this, difficulties rise in detecting clouds above bright (highly reflective) surfaces, such as oceans and ice.

Parameters

The value of a certain parameter is more reliable the more satellites are measuring the said parameter. This is because the range of errors and neglected details varies from instrument to instrument. Thus, if the analysed parameter has similar values for different instruments, it is accepted that the true value lies in the range given by the corresponding data sets.

The Global Energy and Water Cycle Experiment uses the following quantities in order to compare data quality from different satellites in order to establish a reliable quantification of the properties of the clouds:

  • the cloud cover or cloud amount with values between 0 and 1
  • the cloud temperature at cloud top ranging from 150 to 340 K
  • the cloud pressure at top 1013 - 100 hPa
  • the cloud height, measured above sea level, ranging from 0 to 20 km
  • the cloud IR emissivity, with values between 0 and 1, with a global average around 0.7
  • the effective cloud amount, the cloud amount weighted by the cloud IR emissivity, with a global average of 0.5
  • the cloud (visible) optical depth varies within a range of 4 and 10.
  • the cloud water path for the liquid and solid (ice) phases of the cloud particles
  • the cloud effective particle size for both liquid and ice, ranging from 0 to 200 μm

Icing

Another vital property is the icing characteristic of various cloud genus types at various altitudes, which can have great impact on the safety of flying. The methodologies used to determine these characteristics include using CloudSat data for the analysis and retrieval of icing conditions, the location of clouds using cloud geometric and reflectivity data, the identification of cloud types using cloud classification data, and finding vertical temperature distribution along the CloudSat track (GFS).

The range of temperatures that can give rise to icing conditions is defined according to cloud types and altitude levels:

Low-level stratocumulus and stratus can cause icing at a temperature range of 0 to -10 °C.
For mid-level altocumulus and altostratus, the range is 0 to -20 °C.
Vertical or multi-level cumulus, cumulonimbus, and nimbostatus, create icing at a range of 0 to -25 °C.
High-level cirrus, cirrocumulus, and cirrostratus generally cause no icing because they are made mostly of ice crystals colder than -25 °C.

Cohesion and dissolution

There are forces throughout the homosphere (which includes the troposphere, stratosphere, and mesosphere) that can impact the structural integrity of a cloud. It has been speculated that as long as the air remains saturated, the natural force of cohesion that hold the molecules of a substance together may act to keep the cloud from breaking up. However, this speculation has a logical flaw in that the water droplets in the cloud are not in contact with each other and therefore not satisfying the condition required for the intermolecular forces of cohesion to act. Dissolution of the cloud can occur when the process of adiabatic cooling ceases and upward lift of the air is replaced by subsidence. This leads to at least some degree of adiabatic warming of the air which can result in the cloud droplets or crystals turning back into invisible water vapor. Stronger forces such as wind shear and downdrafts can impact a cloud, but these are largely confined to the troposphere where nearly all the Earth's weather takes place. A typical cumulus cloud weighs about 500 metric tons, or 1.1 million pounds, the weight of 100 elephants.

Models

There are two main model schemes that can represent cloud physics, the most common is bulk microphysics models that uses mean values to describe the cloud properties (e.g. rain water content, ice content), the properties can represent only the first order (concentration) or also the second order (mass). The second option is to use bin microphysics scheme that keep the moments (mass or concentration) in different for different size of particles. The bulk microphysics models are much faster than the bin models but are less accurate.

Gene

From Wikipedia, the free encyclopedia https://en.wikipedia.org/wiki/Gene Chromosome ...