Chemical looping reforming (CLR) and gasification (CLG)
are the operations that involve the use of gaseous carbonaceous
feedstock and solid carbonaceous feedstock, respectively, in their
conversion to syngas in the chemical looping scheme. The typical gaseous carbonaceous feedstocks used are natural gas and reducing tail gas, while the typical solid carbonaceous feedstocks used are coal and biomass.
The feedstocks are partially oxidized to generate syngas using metal
oxide oxygen carriers as the oxidant. The reduced metal oxide is then
oxidized in the regeneration step using air. The syngas is an important
intermediate for generation of such diverse products as electricity,
chemicals, hydrogen, and liquid fuels.
The motivation for developing the CLR and CLG processes lies in
their advantages of being able to avoid the use of pure oxygen in the
reaction, thereby circumventing the energy intensive air separation
requirement in the conventional reforming and gasification
processes. The energy conversion efficiency of the processes can, thus,
be significantly increased. Steam and carbon dioxide can also be used
as the oxidants. As the metal oxide also serves as the heat transfer
medium in the chemical looping process, the exergy
efficiency of the reforming and gasification processes like that for
the combustion process is also higher as compared to the conventional
processes.
Description
The
CLR and CLG processes use solid metal oxides as the oxygen carrier
instead of pure oxygen as the oxidant. In one reactor, termed the
reducer or fuel reactor, the carbonaceous feedstock is partially
oxidized to syngas, while the metal oxide is reduced to a lower
oxidation state as given by:
CHaOb + 1-b/δ MeOx → CO + a/2 H2 + 1-b/δ MeOx-δ
where Me is a metal. It is noted that the reaction in the reducer of the CLR and CLG processes differs from that in the chemical looping combustion (CLC) process in that, the feedstock in CLC process is fully oxidized to CO2 and H2O.
In another reactor, termed the oxidizer, combustor or air reactor (when
air is used as the regeneration agent), the reduced metal oxide from
the reducer is re-oxidized by air or steam as given by:
The solid metal oxide oxygen carrier is then circulated between these
two reactors. That is the reducer and the oxidizer/combustor are
connected in a solids circulatory loop, while the gaseous reactants and
products from each of the two reactors are isolated by the gas seals
between the reactors. This streamlining configuration of the chemical
looping system possesses a process intensification property with a
smaller process footprint as compared to that for the traditional
systems.
Oxygen carriers
Fig
1. Modified Ellingham diagram:(a) to determine metal oxide performance
in chemical looping processes; (b) with sections indicated for chemical
looping applications.
The Ellingham diagram
that provides the Gibbs free energy formation of a variety of metal
oxides is widely used in metallurgical processing for determining the
relative reduction-oxidation potentials of metal oxides at different
temperatures.
It depicts the thermodynamic property of a variety of metal oxides to
be used as potential oxygen carrier materials. It can be modified to
provide the Gibbs free energy
changes for metals and metal oxides under various oxidation states so
that it can be directly used for the selection of metal oxide oxygen
carrier materials based on their oxidation capabilities for specific
chemical looping applications.
The modified Ellingham diagram is given in Fig 1a. As shown in Fig 1b,
the diagram can be divided into four different sections based on the
following four key reactions:
Reaction line 1: 2CO + O2 → 2CO2
Reaction line 2: 2H2 + O2 → 2H2O
Reaction line 3: 2C + O2 → 2CO
Reaction line 4: 2CH4 + O2 → 2CO + 4H2
The sections identified in Fig 1b provide the information on metal
oxide materials that can be selected as potential oxygen carriers for
desired chemical looping applications. Specifically, highly oxidative
metal oxides, such as NiO, CoO, CuO, Fe2O3 and Fe3O4
belong to the combustion section (Section A) and they all lie above the
reaction lines 1 and 2. These metal oxides have a high oxidizing
tendency and can be used as oxygen carriers for the chemical looping combustion,
gasification or partial oxidation processes. The metal oxides in
Section E, the small section between the reaction lines 1 and 2, can be
used for CLR and CLG, although a significant amount of H2O
may present in the syngas product. The section for syngas production
lies between reaction lines 2 and 3 (Section B). Metal oxides lying in
this region, such as CeO2, have moderate oxidation tendencies
and are suitable for CLR and CLG but not for the complete oxidation
reactions. Metal oxides below reaction line 3 (Sections C and D) are not
thermodynamically favored for oxidizing the fuels to syngas. Thus, they
cannot be used as oxygen carriers and are generally considered to be
inert. These materials include Cr2O3 and SiO2.
They can, however, be used as support materials along with active
oxygen carrier materials. In addition to the relative redox potentials
of metal oxide materials illustrated in Fig 1b, the development of
desired oxygen carriers for chemical looping applications requires to
consider such properties as oxygen carrying capacity, redox reactivity,
reaction kinetics, recyclability, attrition resistance, heat carrying
capacity, melting point, and production cost.
Process configurations
The
CLR and CLG processes can be configured based on the types of
carbonaceous feedstocks given and desired products to be produced. Among
a broad range of products, the CLG process can produce electricity
through chemical looping IGCC.
The syngas produced from the CLR and the CLG can be used to synthesize a
variety of chemicals, liquid fuels and hydrogen. Given below are some
specific examples of the CLR and CLG processes.
Steam methane reforming with chemical looping combustion (CLC-SMR)
Fig 2. CLC-SMR system for H2 production: (a) SMR reactor inside the reducer (fuel reactor) (b) SMR reactor inside the combustor (air reactor)
Hydrogen and syngas are currently produced largely by steam methane reforming (SMR). The main reaction in SMR is:
The SMR reaction is endothermic, which requires heat input. The
state-of-art SMR system places the tubular catalytic reactors in a
furnace, in which fuel gas is burned to provide the required heat.
In the SMR with chemical looping combustion (CLC-SMR) concepts shown in Fig 2,
the syngas production is carried out by the SMR in a tubular catalytic
reactor while the chemical looping combustion system is used to provide
the heat for the catalytic reaction. Depending on which chemical looping
reactor is used to provide the SMR reaction heat, two CLC-SMR schemes
can be configured. In Scheme 1 (Fig 2a), the reaction heat is provided
by the reducer (fuel reactor). In Scheme 2 (Fig 2b), the reaction heat
is provided by the combustor (air reactor). In either scheme, the
combustion of metal oxide by air in the chemical looping system provides
the heat source that sustains the endothermic SMR reactions. In the
chemical looping system, natural gas and the recycled off-gas from the pressure swing adsorption (PSA) of the SMR process system are used as the feedstock for the CLC fuel reactor operation with CO2
and the steam as the reaction products. The CLC-SMR concepts have
mainly been studied from the perspective of the process simulation. It
is seen that both schemes do not engage directly the chemical looping
system as a means for syngas production.
Chemical looping reforming (CLR)
Fig 3. CLR using a circulating fluidized bed configurationFig 4. CLR system with a moving bed reducer
Chemical looping systems can directly be engaged as an effective means for syngas production. Compared to the conventional partial oxidation (POX) or autothermal reforming
(ATR) processes, the key advantage of the chemical looping reforming
(CLR) process is the elimination of the air separation unit (ASU) for
oxygen production. The gaseous fuel, typically natural gas, is fed to
the fuel reactor, in which a solid metal oxide oxygen carrier partially
oxidizes the fuel to generate syngas:
CH4 + 1⁄δ MeOx → CO + 2H2 + 1⁄δ MeOx-δ
Steam can be added to the reaction in order to increase the generation of H2, via the water-gas shift reaction (WGS) and/or steam methane reforming.
The CLR process can produce a syngas with a H2:CO molar ratio of 2:1 or higher, which is suitable for Fischer–Tropsch synthesis, methanol synthesis, or hydrogen production. The reduced oxygen carrier from the reducer is oxidized by air in the combustor:
2⁄δ MeOx-δ + O2 (air) → 2⁄δ MeOx
The overall reaction in the CLR system is a combination of the partial oxidation reaction of the fuel and the WGS reaction:
CH4 + 1-a/2 O2 + a H2O → CO + (2+a) H2
It is noted that the actual reaction products for such reactions as
those given above can vary depending on the actual operating conditions.
For example, the CLR reactions can also produce CO2 when highly oxidative oxygen carriers such as NiO and Fe2O3
are used. The carbon deposition occurs particularly when the oxygen
carrier is highly reduced. Reduced oxygen carrier species, such as Ni
and Fe, catalyze the hydrocarbon pyrolysis reactions.
Fig 3 shows a CLR system that has been studied experimentally by Vienna University of Technology. The system consists of a fluidized bed reducer and a fluidized bed combustor, connected by loop seals and cyclones. Commonly used oxygen carriers are based on NiO or Fe2O3. The NiO-based oxygen carriers exhibit excellent reactivity, as shown by the high conversion of natural gas. The Fe2O3-based
oxygen carriers have a lower material cost while their reactivity is
lower than that of the NiO-based ones. Operating variables such as
temperature, pressure, type of metal oxide, and molar ratio of metal
oxide to gaseous fuel will influence the fuel conversion and product
compositions. However, with the effects of the back mixing and
distributed residence time for the metal oxide particles in the
fluidized bed, the oxidation state of the metal oxide particles in the
fluidized bed varies that prevents a high purity of the syngas to be
produced from the reactor.
The moving bed reactor that does not have the effects of back
mixing of the metal oxide particles is another gas-solid contact
configuration for CLR/CLG operation.
This reactor system developed by Ohio State University is characterized
by a co-current gas-solid moving bed reducer as given in Fig 4. The
moving bed reducer can maintain the uniform oxidation state of the exit
metal oxide particles from the reactor. thereby synchronizing the
process operation to achieve the thermodynamic equilibrium conditions.The CLR moving bed process applied to the methane to syngas (MTS) reactions has the flexibility of co-feeding CO2 as a feedstock with such gaseous fuels as natural gas, shale gas, and reducing tail gases, yielding a CO2 negative process system.
The CLR-MTS system can yield a higher energy efficiency and cost
benefits over the conventional syngas technologies. In a benchmark study
for production of 50,000 barrels per day of liquid fuels using the
natural gas as the feedstock, the CLR - MTS system for syngas production
can reduce the natural gas usage by 20% over the conventional systems
involving the Fischer–Tropsch technology.
Chemical looping gasification (CLG)
Chemical
looping gasification (CLG) differs from the CLR in that it uses solid
fuels such as coal and biomass instead of gaseous fuels as feedstocks.
The operating principles for the CLG is similar to CLR. For solid
feedstocks, devolatilization and pyrolysis
of the solid fuel occur when the solid fuels are introduced into the
reducer and mixed with the oxygen carrier particles. With the fluidized
bed reducer, the released volatiles, including light organic compounds
and tars, may channel through the reducer and exit with the syngas. The
light organic compounds may reduce the purity of the syngas, while the
tars may accumulate in downstream pipelines and instruments. For
example, the carbon efficiency using the coal CLG fluidized bed reducer
may vary from 55% to 81%, whereas the carbon efficiency using the coal moving bed reducer can reach 85% to 98%.
The syngas derived from the biomass CLG fluidized bed reducer may
consist of up to 15% methane, while the syngas derived from the biomass
CLG moving bed reducer can reach a methane concentration of less than
5%.
In general, increasing the temperature of the CLG system can promote
volatile and char conversion. This may also promote the full oxidation
side reaction resulting in an increased CO2 concentration in
the syngas. Additional equipment for gas cleanup including scrubber,
catalytic steam reformer and/or tar reformer may be necessary downstream
of the CLG system in order to remove or convert the unwanted byproducts
in the syngas stream. Char, the remaining solid from the
devolatilization and reactions, requires additional time for conversion.
For a fluidized bed reducer with particle back mixing, unconverted char
may leave the reducer with the reduced metal oxide particles. A carbon
stripper may be needed at the solid outlet of the fluidized bed reducer
to allow the unconverted char to be separated from the oxygen carriers. The char can be recycled back to the reducer for further conversion.
Fig 5. Chemical looping three-reactor system for hydrogen production
In a similar operating scheme to the CLR - MTS system given in Fig 4,
chemical looping gasification (CLG) of solid fuels carried out in a
co-current moving bed reducer to partially oxidize solid fuels into
syngas can reach an appropriate H2/CO ratio for downstream processing.
Coal ash is removed through in-situ gas-solid separation operation. The
moving bed prevents the channeling or bypassing of the volatiles and
chars, thereby maximizing the conversion of the solid fuel. The full
oxidation side reactions can be impeded through the control of the
oxidation state formed for the oxygen carriers in the moving bed
reactor. The CLR moving bed process applied to the coal to syngas (CTS)
reactions also has the flexibility of co-feeding CO2 as a feedstock with coal yielding a CO2 negative process system with a high purity of syngas production.
In a benchmark study for production of 10,000 ton/day of methanol from
coal, the upstream gasification capital cost can be reduced by 50% when
the chemical looping moving bed gasification system is used.
Broader context
In
a general sense, the CLR and CLG processes for syngas production are
part of the chemical looping partial oxidation or selective oxidation
reaction schemes. The syngas production can lead to the hydrogen
production from the downstream water-gas shift reaction. The CLG process
can also be applied to electricity generation, resembling the IGCC
based on the syngas generated from the chemical looping processes. The
chemical looping three-reactor (including reducer, oxidizer and
combustor) system using a moving bed reducer for metal oxide reduction
by fuel followed by a moving bed oxidizer for the water splitting to
produce hydrogen is given in Fig 5.
For coal-based feedstock applications, this system is estimated to
reduce the cost for electricity generation by 5-15% as compared to
conventional systems.
The selective oxidation based chemical looping processes can be
used to produce directly in one step value-added products beyond syngas.
These chemical looping processes require the use of designed metal
oxide oxygen carrier that has a high product selectivity and a high
feedstock conversion. An example is the chemical looping selective
oxidation process developed by DuPont for producing maleic anhydride
from butane. The oxygen carrier used in this process is vanadium
phosphorus oxide (VPO) based material. This chemical looping process was
advanced to the commercial level. Its commercial operation, however,
was hampered in part by the inadequacies in the chemical and mechanical
viability of the oxygen carrier VPO and its associated effects on the
reaction kinetics of the particles.
Chemical looping selective oxidation was also applied to the production of olefins from methane. In chemical looping oxidative coupling of methane (OCM), the oxygen carrier selectively converts methane into ethylene.
Liquefied natural gas (LNG) is natural gas (predominantly methane, CH4, with some mixture of ethane, C2H6)
that has been cooled down to liquid form for ease and safety of
non-pressurized storage or transport. It takes up about 1/600th the
volume of natural gas in the gaseous state at standard conditions for temperature and pressure.
LNG is odorless, colorless, non-toxic and non-corrosive. Hazards include flammability after vaporization into a gaseous state, freezing and asphyxia. The liquefaction process involves removal of certain components, such as dust, acid gases, helium, water, and heavy hydrocarbons, which could cause difficulty downstream. The natural gas is then condensed
into a liquid at close to atmospheric pressure by cooling it to
approximately −162 °C (−260 °F); maximum transport pressure is set at
around 25 kPa (4 psi) (gauge pressure), which is about 1.25 times atmospheric pressure at sea level.
The gas extracted from underground hydrocarbon deposits contains a
varying mix of hydrocarbon components, which usually includes mostly
methane (CH4), along with ethane (C2H6), propane (C3H8) and butane (C4H10). Other gases also occur in natural gas, notably CO2.
These gases have wide-ranging boiling points and also different
heating values, allowing different routes to commercialization and also
different uses. The "acidic" elements such as hydrogen sulphide (H2S) and carbon dioxide (CO2), together with oil, mud, water, and mercury, are removed from the gas to deliver a clean sweetened
stream of gas. Failure to remove much or all of such acidic molecules,
mercury, and other impurities could result in damage to the equipment.
Corrosion of steel pipes and amalgamization of mercury to aluminum
within cryogenic heat exchangers could cause expensive damage.
The gas stream is typically separated into the liquefied
petroleum fractions (butane and propane), which can be stored in liquid
form at relatively low pressure, and the lighter ethane and methane
fractions. These lighter fractions of methane and ethane are then
liquefied to make up the bulk of LNG that is shipped.
Natural gas was considered during the 20th century to be
economically unimportant wherever gas-producing oil or gas fields were
distant from gas pipelines or located in offshore locations where
pipelines were not viable. In the past this usually meant that natural
gas produced was typically flared,
especially since unlike oil, no viable method for natural gas storage
or transport existed other than compressed gas pipelines to end users of
the same gas. This meant that natural gas markets were historically
entirely local, and any production had to be consumed within the local
or regional network.
Developments of production processes, cryogenic storage, and
transportation effectively created the tools required to commercialize
natural gas into a global market which now competes with other fuels.
Furthermore, the development of LNG storage also introduced a
reliability in networks which was previously thought impossible. Given
that storage of other fuels is relatively easily secured using simple
tanks, a supply for several months could be kept in storage. With the
advent of large-scale cryogenic storage, it became possible to create
long term gas storage reserves. These reserves of liquefied gas could be
deployed at a moment's notice through regasification processes, and today are the main means for networks to handle local peak shaving requirements.
A typical LNG process
Specific energy content and energy density
The heating value
depends on the source of gas that is used and the process that is used
to liquefy the gas. The range of heating value can span ±10 to 15
percent. A typical value of the higher heating value of LNG is approximately 50 MJ/kg or 21,500 BTU/lb. A typical value of the lower heating value of LNG is 45 MJ/kg or 19,350 BTU/lb.
For the purpose of comparison of different fuels, the heating
value may be expressed in terms of energy per volume, which is known as
the energy density
expressed in MJ/litre. The density of LNG is roughly 0.41 kg/litre to
0.5 kg/litre, depending on temperature, pressure, and composition,
compared to water at 1.0 kg/litre. Using the median value of
0.45 kg/litre, the typical energy density values are 22.5 MJ/litre
(based on higher heating value) or 20.3 MJ/litre (based on lower heating
value).
The volumetric energy density of LNG is approximately 2.4 times that of compressed natural gas
(CNG), which makes it economical to transport natural gas by ship in
the form of LNG. The energy density of LNG is comparable to propane and ethanol but is only 60 percent that of diesel and 70 percent that of gasoline.
History
Experiments on the properties of gases started early in the 17th century. By the middle of the seventeenth century Robert Boyle had derived the inverse relationship between the pressure and the volume of gases. About the same time, Guillaume Amontons
started looking into temperature effects on gas. Various gas
experiments continued for the next 200 years. During that time there
were efforts to liquefy gases. Many new facts about the nature of gases
were discovered. For example, early in the nineteenth century Cagniard de la Tour
showed there was a temperature above which a gas could not be
liquefied. There was a major push in the mid to late nineteenth century
to liquefy all gases. A number of scientists including Michael Faraday, James Joule, and William Thomson (Lord Kelvin) did experiments in this area. In 1886 Karol Olszewski liquefied methane, the primary constituent of natural gas. By 1900 all gases had been liquefied except helium, which was liquefied in 1908.
The first large-scale liquefaction of natural gas in the U.S. was
in 1918 when the U.S. government liquefied natural gas as a way to
extract helium, which is a small component of some natural gas. This
helium was intended for use in British dirigibles for World War I. The
liquid natural gas (LNG) was not stored, but regasified and immediately
put into the gas mains.
The key patents having to do with natural gas liquefaction date from 1915 and the mid-1930s. In 1915 Godfrey Cabot patented a method for storing liquid gases at very low temperatures. It consisted of a Thermos bottle-type
design which included a cold inner tank within an outer tank; the tanks
being separated by insulation. In 1937 Lee Twomey received patents for a
process for large-scale liquefaction of natural gas. The intention was
to store natural gas as a liquid so it could be used for shaving peak
energy loads during cold snaps. Because of large volumes it is not
practical to store natural gas, as a gas, near atmospheric pressure.
However, when liquefied, it can be stored in a volume 1/600th as large.
This is a practical way to store it but the gas must be kept at −260 °F
(−162 °C).
There are two processes for liquefying natural gas in large
quantities. The first is the cascade process, in which the natural gas
is cooled by another gas which in turn has been cooled by still another
gas, hence named the "cascade" process. There are usually two cascade
cycles before the liquid natural gas cycle. The other method is the Linde process,
with a variation of the Linde process, called the Claude process, being
sometimes used. In this process, the gas is cooled regeneratively by
continually passing and expanding it through an orifice until it is
cooled to temperatures at which it liquefies. This process was developed
by James Joule and William Thomson and is known as the Joule–Thomson effect. Lee Twomey used the cascade process for his patents.
Commercial operations in the United States
U.S. LNG exports 1997–2022Natural gas capacity and exports
The East Ohio Gas
Company built a full-scale commercial LNG plant in Cleveland, Ohio, in
1940 just after a successful pilot plant built by its sister company,
Hope Natural Gas Company of West Virginia. This was the first such plant
in the world. Originally it had three spheres, approximately 63 feet in
diameter containing LNG at −260 °F. Each sphere held the equivalent of
about 50 million cubic feet of natural gas. A fourth tank, a cylinder,
was added in 1942. It had an equivalent capacity of 100 million cubic
feet of gas. The plant operated successfully for three years. The stored
gas was regasified and put into the mains when cold snaps hit and extra
capacity was needed. This precluded the denial of gas to some customers
during a cold snap.
The Cleveland plant failed
on October 20, 1944, when the cylindrical tank ruptured, spilling
thousands of gallons of LNG over the plant and nearby neighborhood. The
gas evaporated and caught fire, which caused 130 fatalities.
The fire delayed further implementation of LNG facilities for several
years. However, over the next 15 years new research on low-temperature
alloys, and better insulation materials, set the stage for a revival of
the industry. It restarted in 1959 when a U.S. World War II Liberty ship, the Methane Pioneer,
converted to carry LNG, made a delivery of LNG from the U.S. Gulf Coast
to energy-starved Great Britain. In June 1964, the world's first
purpose-built LNG carrier, the Methane Princess, entered service.
Soon after that a large natural gas field was discovered in Algeria.
International trade in LNG quickly followed as LNG was shipped to France
and Great Britain from the Algerian fields. One more important
attribute of LNG had now been exploited. Once natural gas was liquefied
it could not only be stored more easily, but it could be transported.
Thus energy could now be shipped over the oceans via LNG the same way it
was shipped in the form of oil.
The LNG industry in the U.S. restarted in 1965 with the building
of a number of new plants, which continued through the 1970s. These
plants were not only used for peak-shaving, as in Cleveland, but also
for base-load supplies for places that never had natural gas before
this. A number of import facilities were built on the East Coast in
anticipation of the need to import energy via LNG. However, a recent
boom in U.S. natural gas production (2010–2014), enabled by hydraulic fracturing
("fracking"), has many of these import facilities being considered as
export facilities. The first U.S. LNG export was completed in early
2016.
LNG life cycle
LNG life cycle
The process begins with the pre-treatment of a feedstock of natural gas entering the system to remove impurities such as H2S, CO2, H2O, mercury and higher-chained hydrocarbons. Feedstock gas then enters the liquefaction unit where it is cooled to between -145 °C and -163 °C Although the type or number of heating cycles and/or refrigerants
used may vary based on the technology, the basic process involves
circulating the gas through aluminum tube coils and exposure to a
compressed refrigerant. As the refrigerant is vaporized, the heat transfer causes the gas in the coils to cool. The LNG is then stored in a specialized double-walled insulated tank at atmospheric pressure ready to be transported to its final destination.
Most domestic LNG is transported by land via truck/trailer designed for cryogenic temperatures.
Intercontinental LNG transport travels by special tanker ships. LNG
transport tanks comprise an internal steel or aluminum compartment and
an external carbon or steel compartment with a vacuum system in between
to reduce the amount of heat transfer. Once on site, the LNG must be stored in vacuum insulated or flat bottom storage tanks.
When ready for distribution, the LNG enters a regasification facility
where it is pumped into a vaporizer and heated back into gaseous form. The gas then enters the gas pipeline distribution system and is delivered to the end-user.
Production
The natural gas fed into the LNG plant will be treated to remove water, hydrogen sulfide, carbon dioxide, benzene and other components that will freeze
under the low temperatures needed for storage or be destructive to the
liquefaction facility. LNG typically contains more than 90% methane. It also contains small amounts of ethane, propane, butane, some heavier alkanes, and nitrogen. The purification process can be designed to give almost 100% methane. One of the risks of LNG is a rapid phase transition explosion (RPT), which occurs when cold LNG comes into contact with water.
The most important infrastructure needed for LNG production and
transportation is an LNG plant consisting of one or more LNG trains,
each of which is an independent unit for gas liquefaction and
purification. A typical train consists of a compression area, propane condenser area, and methane and ethane areas.
The largest LNG train in operation is in Qatar, with a total
production capacity of 7.8 million tonnes per annum (MTPA). LNG is
loaded onto ships and delivered to a regasification terminal, where the
LNG is allowed to expand and reconvert into gas. Regasification
terminals are usually connected to a storage and pipeline distribution
network to distribute natural gas to local distribution companies (LDCs)
or independent power plants (IPPs).
LNG plant production
Information for the following table is derived in part from publication by the U.S. Energy Information Administration.
Global LNG import trends, by volume (in red), and as a percentage of global natural gas imports (in black) (US EIA data)Trends in the top five LNG-importing nations as of 2009 (US EIA data)
Year
Capacity (MTPA)
1990
50
2002
130
2007
160
2014
246
The LNG industry developed slowly during the second half of the last
century because most LNG plants are located in remote areas not served
by pipelines, and because of the high costs of treating and transporting
LNG. Constructing an LNG plant costs at least $1.5 billion per 1 MTPA
capacity, a receiving terminal costs $1 billion per 1 bcf/day throughput
capacity and LNG vessels cost $200 million–$300 million.
In the early 2000s, prices for constructing LNG plants, receiving
terminals and vessels fell as new technologies emerged and more players
invested in liquefaction and regasification. This tended to make LNG
more competitive as a means of energy distribution, but increasing
material costs and demand for construction contractors have put upward
pressure on prices in the last few years.
The standard price for a 125,000 cubic meter LNG vessel built in
European and Japanese shipyards used to be US$250 million. When Korean
and Chinese shipyards entered the race, increased competition reduced
profit margins and improved efficiency—reducing costs by 60 percent.
Costs in US dollars also declined due to the devaluation of the
currencies of the world's largest shipbuilders: the Japanese yen and
Korean won.
Since 2004, the large number of orders increased demand for
shipyard slots, raising their price and increasing ship costs. The
per-ton construction cost of an LNG liquefaction plant fell steadily
from the 1970s through the 1990s. The cost reduced by approximately 35
percent. However, recently the cost of building liquefaction and
regasification terminals doubled due to increased cost of materials and a
shortage of skilled labor, professional engineers, designers, managers
and other white-collar professionals.
Due to natural gas shortage concerns in the northeastern U.S. and
surplus natural gas in the rest of the country, many new LNG import and
export terminals are being contemplated in the United States. Concerns
about the safety of such facilities create controversy in some regions
where they are proposed. One such location is in the Long Island Sound
between Connecticut and Long Island. Broadwater Energy, an effort of TransCanada Corp.
and Shell, wishes to build an LNG import terminal in the sound on the
New York side. Local politicians including the Suffolk County Executive
raised questions about the terminal. In 2005, New York Senators Chuck Schumer and Hillary Clinton also announced their opposition to the project. Several import terminal proposals along the coast of Maine were also met with high levels of resistance and questions. On Sep. 13, 2013 the U.S. Department of Energy approved Dominion Cove Point's
application to export up to 770 million cubic feet per day of LNG to
countries that do not have a free trade agreement with the U.S.
In May 2014, the FERC concluded its environmental assessment of the
Cove Point LNG project, which found that the proposed natural gas export
project could be built and operated safely. Another LNG terminal is currently proposed for Elba Island, Ga. Plans for three LNG export terminals in the U.S. Gulf Coast region have also received conditional Federal approval. In Canada, an LNG export terminal is under construction near Guysborough, Nova Scotia.
Commercial aspects
Global Trade
In the commercial development of an LNG value chain, LNG suppliers
first confirm sales to the downstream buyers and then sign long-term
contracts (typically 20–25 years) with strict terms and structures for
gas pricing. Only when the customers are confirmed and the development
of a greenfield project deemed economically feasible, could the sponsors
of an LNG project invest in their development and operation. Thus, the
LNG liquefaction business has been limited to players with strong
financial and political resources. Major international oil companies
(IOCs) such as ExxonMobil, Royal Dutch Shell, BP, Chevron, TotalEnergies and national oil companies (NOCs) such as Pertamina and Petronas are active players.
LNG is shipped around the world in specially constructed seagoing vessels.
The trade of LNG is completed by signing an SPA (sale and purchase
agreement) between a supplier and receiving terminal, and by signing a
GSA (gas sale agreement) between a receiving terminal and end-users.
Most of the contract terms used to be DES or ex ship,
holding the seller responsible for the transport of the gas. With low
shipbuilding costs, and the buyers preferring to ensure reliable and
stable supply, however, contracts with FOB
terms increased. Under such terms the buyer, who often owns a vessel or
signs a long-term charter agreement with independent carriers, is
responsible for the transport.
LNG purchasing agreements used to be for a long term with
relatively little flexibility both in price and volume. If the annual
contract quantity is confirmed, the buyer is obliged to take and pay for
the product, or pay for it even if not taken, in what is referred to as
the obligation of take-or-pay contract (TOP).
In the mid-1990s, LNG was a buyer's market. At the request of
buyers, the SPAs began to adopt some flexibilities on volume and price.
The buyers had more upward and downward flexibilities in TOP, and
short-term SPAs less than 16 years came into effect. At the same time,
alternative destinations for cargo and arbitrage were also allowed. By
the turn of the 21st century, the market was again in favor of sellers.
However, sellers have become more sophisticated and are now proposing
sharing of arbitrage opportunities and moving away from S-curve pricing.
There has been much discussion regarding the creation of an "OGEC" as a
natural gas equivalent of OPEC. Russia and Qatar, countries with the largest and the third largest natural gas reserves in the world, have finally supported such move.
President Trump visits the Cameron LNG Export Terminal in Louisiana, May 2019.
Until 2003, LNG prices have closely followed oil prices. Since then,
LNG prices in Europe and Japan have been lower than oil prices, although
the link between LNG and oil is still strong. In contrast, prices in
the US and the UK have recently skyrocketed, then fallen as a result of
changes in supply and storage.
In the late 1990s and early 2000s, the market shifted for buyers, but
since 2003 and 2004, it has been a strong seller's market, with net-back
as the best estimation for prices.
Research from Global Energy Monitor in 2019 warned that up to
US$1.3 trillion in new LNG export and import infrastructure currently
under development is at significant risk of becoming stranded, as global
gas risks becoming oversupplied, particularly if the United States and
Canada play a larger role.
The current surge in unconventional oil
and gas in the U.S. has resulted in lower gas prices in the U.S. This
has led to discussions in Asia' oil linked gas markets to import gas
based on Henry Hub index. Recent high level conference in Vancouver, the Pacific Energy Summit 2013 Pacific Energy Summit 2013 convened policy makers and experts from Asia and the U.S. to discuss LNG trade relations between these regions.
Receiving terminals exist in about 40
countries, including Belgium, Chile, China, the Dominican Republic,
France, Greece, India, Italy, Japan, Korea, Poland, Spain, Taiwan, the
UK, the US, among others. Plans exist for Bahrain, Germany, Ghana,
Morocco, Philippines, Vietnam and others to also construct new receiving (regasification) terminals.
LNG Project Screening
Base load (large-scale, >1 MTPA) LNG projects require natural gas reserves, buyers and financing. Using proven technology and a proven contractor is extremely important for both investors and buyers. Gas reserves required: 1 tcf of gas required per Mtpa of LNG over
20 years.
LNG is most cost efficiently produced in relatively large facilities due to economies of scale,
at sites with marine access allowing regular large bulk shipments
direct to market. This requires a secure gas supply of sufficient
capacity. Ideally, facilities are located close to the gas source, to
minimize the cost of intermediate transport infrastructure and gas
shrinkage (fuel loss in transport). The high cost of building large LNG
facilities makes the progressive development of gas sources to maximize
facility utilization essential, and the life extension of existing,
financially depreciated LNG facilities cost effective. Particularly when
combined with lower sale prices due to large installed capacity and
rising construction costs, this makes the economic screening/
justification to develop new, and especially greenfield, LNG facilities
challenging, even if these could be more environmentally friendly than
existing facilities with all stakeholder concerns satisfied. Due to high
financial risk, it is usual to contractually secure gas supply/
concessions and gas sales for extended periods before proceeding to an
investment decision.
Uses
The primary
use of LNG is to simplify transport of natural gas from the source to a
destination. On the large scale, this is done when the source and the
destination are across an ocean from each other. It can also be used
when adequate pipeline capacity is not available. For large-scale
transport uses, the LNG is typically regassified at the receiving end
and pushed into the local natural gas pipeline infrastructure.
LNG can also be used to meet peak demand when the normal pipeline
infrastructure can meet most demand needs, but not the peak demand
needs. These plants are typically called LNG Peak Shaving Plants as the
purpose is to shave off part of the peak demand from what is required
out of the supply pipeline.
LNG can be used to fuel internal combustion engines. LNG is in
the early stages of becoming a mainstream fuel for transportation needs.
It is being evaluated and tested for over-the-road trucking, off-road, marine, and train applications. There are known problems with the fuel tanks and delivery of gas to the engine, but despite these concerns the move to LNG as a transportation fuel has begun. LNG competes directly with compressed natural gas as a fuel for natural gas vehicles
since the engine is identical. There may be applications where LNG
trucks, buses, trains and boats could be cost-effective in order to
regularly distribute LNG energy together with general freight and/or
passengers to smaller, isolated communities without a local gas source
or access to pipelines.
Use of LNG to fuel large over-the-road trucks
LNG side tank on an LNG-converted Scania R410
China has been a leader in the use of LNG vehicles with over 100,000 LNG-powered vehicles on the road as of Sept 2014.
In the United States the beginnings of a public LNG fueling
capability are being put in place. An alternative fuelling centre
tracking site shows 84 public truck LNG fuel centres as of Dec 2016.
It is possible for large trucks to make cross country trips such as Los
Angeles to Boston and refuel at public refuelling stations every 500
miles. The 2013 National Trucker's Directory lists approximately 7,000
truckstops, thus approximately 1% of US truckstops have LNG available.
While as of December 2014 LNG fuel and NGV's were not taken to
very quickly within Europe and it was questionable whether LNG will ever
become the fuel of choice among fleet operators recent trends from 2018 onwards show different prospect.
During the year 2015, Netherlands introduced LNG-powered trucks in transport sector.
Australian government is planning to develop an LNG highway to utilise
the locally produced LNG and replace the imported diesel fuel used by
interstate haulage vehicles.
In the year 2015, India also made small beginning by transporting LNG by LNG-powered road tankers in Kerala state. In 2017, Petronet LNG
is setting up 20 LNG stations on highways along the Indian west coast
that connect Delhi with Thiruvananthapuram covering a total distance of
4,500 km via Mumbai and Bengaluru. In 2020, India planned to install 24 LNG fuelling stations along the 6,000 km Golden Quadrilateral highways connecting the four metros due to LNG prices decreasing in price.
Japan, the world's largest importer of LNG, is set to begin use of LNG as a road transport fuel.
However, if a smaller engine uses an air–fuel mixture with higher
energy density (such as via a turbocharger), then it can produce more
power than a larger one burning a less energy-dense air–fuel mixture.
For high-power, high-torque engines, a fuel that creates a more
energy-dense air–fuel mixture is preferred, because a smaller and
simpler engine can produce the same power.
With conventional gasoline and diesel engines the energy density
of the air–fuel mixture is limited because the liquid fuels do not mix
well in the cylinder. Further, gasoline and diesel fuel have autoignition temperatures
and pressures relevant to engine design. An important part of engine
design is the interactions of cylinders, compression ratios, and fuel
injectors such that pre-ignition
is prevented but at the same time as much fuel as possible can be
injected, become well mixed, and still have time to complete the
combustion process during the power stroke.
Natural gas does not auto-ignite at pressures and temperatures
relevant to conventional gasoline and diesel engine design, so it allows
more flexibility in design. Methane, the main component of natural gas,
has an autoignition temperature of 580 °C (1,076 °F), whereas gasoline and diesel autoignite at approximately 250 °C (482 °F) and 210 °C (410 °F) respectively.
With a compressed natural gas
(CNG) engine, the mixing of the fuel and the air is more effective
since gases typically mix well in a short period of time, but at typical
CNG pressures the fuel itself is less energy-dense than gasoline or
diesel, so the result is a less energy-dense air–fuel mixture. For an
engine of a given cylinder displacement, a normally-aspirated
CNG-powered engine is typically less powerful than a gasoline or diesel
engine of similar displacement. For that reason turbochargers are
popular in European CNG cars. Despite that limitation, the 12-litre Cummins Westport ISX12G engine
is an example of a CNG-capable engine designed to pull tractor–trailer
loads up to 80,000 pounds (36,000 kg) showing CNG can be used in many
on-road truck applications. The original ISX G engine incorporated a
turbocharger to enhance the air–fuel energy density.
LNG offers a unique advantage over CNG for more demanding
high-power applications by eliminating the need for a turbocharger.
Because LNG boils at approximately −160 °C (−256 °F), by using a simple
heat exchanger a small amount of LNG can be converted to its gaseous
form at extremely high pressure with the use of little or no mechanical
energy. A properly designed high-power engine can leverage this
extremely-high-pressure, energy-dense gaseous fuel source to create a
higher-energy-density air–fuel mixture than can be efficiently created
with a CNG-powered engine. The result when compared to CNG engines is
more overall efficiency in high-power engine applications when
high-pressure direct-injection technology is used. The Westport HDMI2
fuel system is an example of a high-pressure direct-injection system
that does not require a turbocharger if paired with an appropriate LNG
heat exchanger. The Volvo Trucks 13-litre LNG engine is another example of an LNG engine leveraging advanced high-pressure technology.
Westport recommends CNG for engines 7 litres or smaller and LNG
with direct-injection for engines between 20 and 150 litres. For engines
between 7 and 20 litres either option is recommended. See slide 13 from
their NGV Bruxelles – Industry Innovation Session presentation.
High-power engines in the oil drilling, mining, locomotive, and marine fields have been or are being developed. Paul Blomerus has written a paper
concluding as much as 40 million tonnes per annum of LNG (approximately
26.1 billion gallons/year or 71 million gallons/day) could be required
just to meet the global needs of such high-power engines by 2025 to
2030.
As of the end of first quarter of 2015, Prometheus Energy Group
Inc claimed to have delivered over 100 million gallons of LNG to the
industrial market within the previous four years and is continuing to add new customers.
Use of LNG in maritime applications
The LNG-powered Crude Oil Tanker Njord DF, moored at the BP Oil Refinery, Jetty, Western Australia
LNG bunkering has been established in some ports via truck-to-ship
fueling. This type of LNG fueling is straightforward to implement,
assuming a supply of LNG is available.
Feeder and short-sea shipping company Unifeeder has been
operating the world's first LNG powered container vessel, the Wes
Amelie, since late 2017, transiting between the port of Rotterdam and
the Baltics on a weekly schedule.
Container shipping company Maersk Group has decided to introduce LNG-powered container ships. The DEME Group has contracted Wärtsilä to power its new generation 'Antigoon' class dredger with dual fuel (DF) engines. Crowley Maritime of Jacksonville, Florida, launched two LNG-powered ConRo ships, the Coquí and Taino, in 2018 and 2019, respectively.
In 2014, Shell ordered a dedicated LNG bunker vessel. It is planned to go into service in Rotterdam in the summer of 2017
The International Convention for the Prevention of Pollution from Ships (MARPOL), adopted by the IMO,
has mandated that marine vessels shall not consume fuel (bunker fuel,
diesel, etc.) with a sulphur content greater than 0.5% from the year
2020 within international waters and the coastal areas of countries
adopting the same regulation. Replacement of high sulphur bunker fuel
with sulphur-free LNG is required on a major scale in the marine
transport sector, as low sulphur liquid fuels are costlier than LNG. Japan's is planning to use LNG as bunker fuel by 2020.
BHP,
one of the largest mining companies in the world, is aiming to
commission minerals transport ships powered with LNG by late 2021.
In January 2021, 175 sea-going LNG-powered ships were in service, with another 200 ships ordered.
The global
trade in LNG is growing rapidly from negligible in 1970 to what is
expected to be a globally substantial amount by 2020. As a reference, the 2014 global production of crude oil was 14.6 million cubic metres (92 million barrels) per day or 54,600 terawatt-hours (186.4 quadrillion British thermal units) per year.
In 1970, global LNG trade was of 3 billion cubic metres (bcm) (0.11 quads). In 2011, it was 331 bcm (11.92 quads).
The U.S. started exporting LNG in February 2016. The Black & Veatch
Oct 2014 forecast is that by 2020, the U.S. alone will export between
10 and 14 billion cu ft/d (280 and 400 million m3/d) or by heating value 3.75 to 5.25 quad (1,100 to 1,540 TWh). E&Y projects global LNG demand could hit 400 mtpa (19.7 quads) by 2020.
If that occurs, the LNG market will be roughly 10% the size of the
global crude oil market, and that does not count the vast majority of
natural gas which is delivered via pipeline directly from the well to
the consumer.
In 2004, LNG accounted for 7 percent of the world's natural gas demand.
The global trade in LNG, which has increased at a rate of 7.4 percent
per year over the decade from 1995 to 2005, is expected to continue to
grow substantially. LNG trade is expected to increase at 6.7 percent per year from 2005 to 2020.
Until the mid-1990s, LNG demand was heavily concentrated in Northeast Asia: Japan, South Korea and Taiwan. At the same time, Pacific Basin supplies dominated world LNG trade.
The worldwide interest in using natural gas-fired combined cycle
generating units for electric power generation, coupled with the
inability of North American and North Sea natural gas supplies to meet
the growing demand, substantially broadened the regional
markets for LNG. It also brought new Atlantic Basin and Middle East
suppliers into the trade.
Russian and Western politicians visit the Sakhalin-II project on 18 February 2009.
By the end of 2017, there were 19 LNG exporting countries and 40 LNG
importing countries. The three biggest LNG exporters in 2017 were Qatar
(77.5 MT), Australia (55.6 MT) and Malaysia (26.9 MT). The three
biggest LNG importers in 2017 were Japan (83.5 MT), China (39 MT) and
South Korea (37.8 MT).
LNG trade volumes increased from 142 MT in 2005 to 159 MT in 2006, 165
MT in 2007, 171 MT in 2008, 220 MT in 2010, 237 MT in 2013, 264 MT in
2016 and 290 MT in 2017. Global LNG production was 246 MT in 2014, most of which was used in trade between countries. During the next several years there would be significant increase in volume of LNG Trade. For example, about 59 MTPA of new LNG supply from six new plants came to market just in 2009, including:
In 2006, Qatar became the world's biggest exporter of LNG. As of 2012, Qatar is the source of 25 percent of the world's LNG exports. As of 2017, Qatar was estimated to supply 26.7% of the world's LNG.
Investments in U.S. export facilities were increasing by 2013, these investments were spurred by increasing shale gas
production in the United States and a large price differential between
natural gas prices in the U.S. and those in Europe and Asia. Cheniere
Energy became the first company in the United States to receive
permission and export LNG in 2016. After a US-EU agreement in 2018, exports from USA to EU increased. In November 2021, U.S. producer Venture Global LNG signed a twenty-year contract with China's state-owned Sinopec to supply liquefied natural gas. China's imports of U.S. natural gas will more than double. U.S. exports of liquefied natural gas to China and other Asian countries surged in 2021, with Asian buyers willing to pay higher prices than European importers. This reversed in 2022, when most of US LNG went to Europe. US LNG export contracts are mainly made for 15–20 years. Exports from the U.S. are likely to reach 13.3 Bcf/d in 2024 due to projects coming online on the Gulf of Mexico.
Imports
In 1964, the UK and France made the first LNG trade, buying gas from Algeria, witnessing a new era of energy.
In 2014, 19 countries exported LNG.
Compared with the crude oil market, in 2013 the natural gas
market was about 72 percent of the crude oil market (measured on a heat
equivalent basis),
of which LNG forms a small but rapidly growing part. Much of this
growth is driven by the need for clean fuel and some substitution effect
due to the high price of oil (primarily in the heating and electricity generation sectors).
Japan, South Korea, Spain, France, Italy and Taiwan
import large volumes of LNG due to their shortage of energy. In 2005,
Japan imported 58.6 million tons of LNG, representing some 30 percent of
the LNG trade around the world that year. Also in 2005, South Korea
imported 22.1 million tons, and in 2004 Taiwan imported 6.8 million
tons. These three major buyers purchase approximately two-thirds of the
world's LNG demand. In addition, Spain imported some 8.2 MTPA in 2006,
making it the third largest importer. France also imported similar
quantities as Spain. Following the Fukushima Daiichi nuclear disaster in March 2011 Japan became a major importer accounting for one third of the total.
European LNG imports fell by 30 percent in 2012, and fell further by 24
percent in 2013, as South American and Asian importers paid more. European LNG imports increased to new heights in 2019, remained high in 2020 and 2021, and increased even more in 2022. Main contributors were Qatar, USA, and Russia.
In 2017, global LNG imports reached 289.8 million tonnes of LNG. In 2017, 72.9% of global LNG demand was located in Asia.
Cargo diversion
Based
on the LNG SPAs, LNG is destined for pre-agreed destinations, and
diversion of that LNG is not allowed. However, if Seller and Buyer make
a mutual agreement, then the diversion of the cargo is permitted —
subject to sharing the additional profit created by such a diversion, by
paying a penalty fee. In the European Union and some other jurisdictions, it is not permitted to apply the profit-sharing clause in LNG SPAs.
Cost of LNG plants
For an extended period of time, design improvements in liquefaction plants and tankers had the effect of reducing costs.
In the 1980s, the cost of building an LNG liquefaction plant cost
$350/tpa (tonne per annum). In the 2000s, it was $200/tpa. In 2012, the
costs can go as high as $1,000/tpa, partly due to the increase in the
price of steel.
As recently as 2003, it was common to assume that this was a
"learning curve" effect and would continue into the future. But this
perception of steadily falling costs for LNG has been dashed in the last
several years.
The construction cost of greenfield LNG projects started to
skyrocket from 2004 afterward and has increased from about $400 per ton
per year of capacity to $1,000 per ton per year of capacity in 2008.
The main reasons for skyrocketed costs in LNG industry can be described as follows:
Low availability of EPC contractors as result of extraordinary high level of ongoing petroleum projects worldwide.
High raw material prices as result of surge in demand for raw materials.
Lack of skilled and experienced workforce in LNG industry.
Devaluation of US dollar.
Very complex nature of projects built in remote locations and where
construction costs are regarded as some of the highest in the world.
Excluding high cost projects the increase of 120% over the period
2002-2012 is more in line with escalation in the upstream oil & gas
industry as reported by the UCCI index.
The 2007–2008 global financial crisis
(GFC) caused a general decline in raw material and equipment prices,
which somewhat lessened the construction cost of LNG plants. However, by 2012 this was more than offset by increasing demand for materials and labor for the LNG market.
Small-scale liquefaction plants
Small-scale
liquefaction plants are suitable for peakshaving on natural gas
pipelines, transportation fuel, or for deliveries of natural gas to
remote areas not connected to pipelines.
They typically have a compact size, are fed from a natural gas
pipeline, and are located close to the location where the LNG will be
used. This proximity decreases transportation and LNG product costs for
consumers. It also avoids the additional greenhouse gas emissions generated during long transportation.
The small-scale LNG plant also allows localized peakshaving to
occur—balancing the availability of natural gas during high and low
periods of demand. It also makes it possible for communities without
access to natural gas pipelines to install local distribution systems
and have them supplied with stored LNG.
LNG pricing
There are three major pricing systems in the current LNG contracts:
Oil indexed contract, used primarily in Japan, Korea, Taiwan and China;
Oil, oil products and other energy carriers indexed contracts, used primarily in Continental Europe; and
Market indexed contracts, used in the US and the UK.
The formula for an indexed price is as follows:
CP = BP + β X
BP: constant part or base price
β: gradient
X: indexation
The formula has been widely used in Asian LNG SPAs, where base price
represents various non-oil factors, but usually a constant determined by
negotiation at a level which can prevent LNG prices from falling below a
certain level. It thus varies regardless of oil price fluctuation.
Henry Hub Plus
Some LNG buyers have already signed contracts for future US-based cargos at prices linked to Henry Hub prices.
Cheniere Energy's LNG export contract pricing consists of a fixed fee
(liquefaction tolling fee) plus 115% of Henry Hub per million British thermal units of LNG.
Tolling fees in the Cheniere contracts vary: US$2.25 per million
British thermal units ($7.7/MWh) with BG Group signed in 2011; $2.49 per
million British thermal units ($8.5/MWh) with Spain's GNF signed in
2012; and $3.00 per million British thermal units ($10.2/MWh) with South
Korea's Kogas and Centrica signed in 2013.
Oil parity
Oil parity is the LNG price that would be equal to that of crude oil on a barrel of oil equivalent
(BOE) basis. If the LNG price exceeds the price of crude oil in BOE
terms, then the situation is called broken oil parity. A coefficient of
0.1724 results in full oil parity. In most cases the price of LNG is
less than the price of crude oil in BOE terms. In 2009, in several spot
cargo deals especially in East Asia, oil parity approached the full oil
parity or even exceeded oil parity.
In January 2016, the spot LNG price of $5.461 per million British
thermal units ($18.63/MWh) has broken oil parity when the Brent crude
price (≤32 US$/bbl) has fallen steeply.
By the end of June 2016, LNG price has fallen by nearly 50% below its
oil parity price, making it more economical than more-polluting
diesel/gas oil in the transport sector.
S-curve
Most of the LNG trade is governed by long-term contracts. Many formulae include an S-curve,
where the price formula is different above and below a certain oil
price, to dampen the impact of high oil prices on the buyer, and low oil
prices on the seller. When the spot LNG price is cheaper than long
term oil price indexed contracts, the most profitable LNG end use is to
power mobile engines for replacing costly gasoline and diesel
consumption.
In most of the East Asian LNG contracts, price formula is indexed to a basket of crude imported to Japan called the Japan Crude Cocktail (JCC). In Indonesian LNG contracts, price formula is linked to Indonesian Crude Price (ICP).
In continental Europe, the price formula indexation does not follow the same format, and it varies from contract to contract. Brent crude price (B), heavy fuel oil price (HFO), light fuel oil price (LFO), gas oil price (GO), coal price, electricity price and in some cases, consumer and producer price indexes are the indexation elements of price formulas.
Price review
Usually
there exists a clause allowing parties to trigger the price revision or
price reopening in LNG SPAs. In some contracts there are two options
for triggering a price revision. regular and special. Regular ones are
the dates that will be agreed and defined in the LNG SPAs for the
purpose of price review.
Quality of LNG
LNG
quality is one of the most important issues in the LNG business. Any
gas which does not conform to the agreed specifications in the sale and
purchase agreement is regarded as "off-specification" (off-spec) or
"off-quality" gas or LNG. Quality regulations serve three purposes:
1 – to ensure that the gas distributed is non-corrosive and non-toxic, below the upper limits for H2S, total sulphur, CO2 and Hg content;
2 – to guard against the formation of liquids or hydrates in the networks, through maximum water and hydrocarbon dewpoints;
3 – to allow interchangeability of the gases distributed, via
limits on the variation range for parameters affecting combustion:
content of inert gases, calorific value, Wobbe index, Soot Index, Incomplete Combustion Factor, Yellow Tip Index, etc.
In the case of off-spec gas or LNG the buyer can refuse to accept the
gas or LNG and the seller has to pay liquidated damages for the
respective off-spec gas volumes.
The quality of gas or LNG is measured at delivery point by using an instrument such as a gas chromatograph.
The most important gas quality concerns involve the sulphur and
mercury content and the calorific value. Due to the sensitivity of
liquefaction facilities to sulfur and mercury elements, the gas being
sent to the liquefaction process shall be accurately refined and tested
in order to assure the minimum possible concentration of these two
elements before entering the liquefaction plant, hence there is not much
concern about them.
However, the main concern is the heating value of gas. Usually
natural gas markets can be divided in three markets in terms of heating
value:
Asia (Japan, Korea, Taiwan), where gas distributed is rich, with a gross calorific value (GCV) higher than 43 MJ/m3(n), i.e. 1,090 Btu/scf,
the UK and the US, where distributed gas is lean, with a GCV usually lower than 42 MJ/m3(n), i.e. 1,065 Btu/scf,
Continental Europe, where the acceptable GCV range is quite wide: approx. 39 to 46 MJ/m3(n), i.e. 990 to 1,160 Btu/scf.
There are some methods to modify the heating value of produced LNG to
the desired level. For the purpose of increasing the heating value,
injecting propane and butane is a solution. For the purpose of
decreasing heating value, nitrogen injecting and extracting butane and
propane are proven solutions. Blending with gas or LNG can be a
solution; however all of these solutions while theoretically viable can
be costly and logistically difficult to manage in large scale. Lean LNG
price in terms of energy value is lower than the rich LNG price.
Liquefaction technology
There are several liquefaction processes available for large, baseload LNG plants (in order of prevalence):
As of January 2016, global nominal LNG liquefaction capacity was
301.5 MTPA (million tonnes per annum), with a further 142 MTPA under
construction.
The majority of these trains use either APCI AP-C3MR or Cascade
technology for the liquefaction process. The other processes, used in a
small minority of some liquefaction plants, include Shell's DMR
(double-mixed refrigerant) technology and the Linde technology.
APCI technology is the most-used liquefaction process in LNG
plants: out of 100 liquefaction trains onstream or under-construction,
86 trains with a total capacity of 243 MTPA have been designed based on
the APCI process. Phillips' Cascade process is the second most-used,
used in 10 trains with a total capacity of 36.16 MTPA. The Shell DMR
process has been used in three trains with total capacity of 13.9 MTPA;
and, finally, the Linde/Statoil process is used in the Snohvit 4.2 MTPA
single train.
Floating liquefied natural gas (FLNG) facilities float above an offshore gas field, and produce, liquefy, store and transfer LNG (and potentially LPG and condensate) at sea before carriers ship it directly to markets. The first FLNG facility is now in development by Shell, due for completion in 2018.
Modern LNG storage tanks are typically of the full containment type, which has a prestressed concrete
outer wall and a high-nickel steel inner tank, with extremely efficient
insulation between the walls. Large tanks are low aspect ratio (height
to width) and cylindrical in design with a domed steel or concrete roof.
Storage pressure in these tanks is very low, less than 10 kilopascals (1.5 psi).
Sometimes more expensive underground tanks are used for storage.
Smaller quantities (say 700 cubic metres (180,000 US gal) and less) may
be stored in horizontal or vertical, vacuum-jacketed, pressure vessels.
These tanks may be at pressures anywhere from less than 50 to over
1,700 kPa (7.3–246.6 psi).
LNG must be kept cold to remain a liquid, independent of
pressure. Despite efficient insulation, there will inevitably be some
heat leakage into the LNG, resulting in vaporisation of the LNG. This
boil-off gas acts to keep the LNG cold (see "Refrigeration" below). The boil-off gas is typically compressed and exported as natural gas, or it is reliquefied and returned to storage.
Model of tanker LNG Rivers, with an LNG capacity of 135,000 cubic metresInterior of an LNG cargo tank
LNG is transported in specially designed ships with double hulls
protecting the cargo systems from damage or leaks. There are several
special leak test methods available to test the integrity of an LNG
vessel's membrane cargo tanks.
The tankers cost around US$200 million each.
Transportation and supply is an important aspect of the gas
business, since natural gas reserves are normally quite distant from
consumer markets. Natural gas has far more volume than oil to transport,
and most gas is transported by pipelines. There is a natural gas
pipeline network in the former Soviet Union,
Europe and North America. Natural gas is less dense, even at higher
pressures. Natural gas will travel much faster than oil through a
high-pressure pipeline, but can transmit only about a fifth of the
amount of energy per day due to the lower density. Natural gas is
usually liquefied to LNG at the end of the pipeline, before shipping.
Short LNG pipelines for use in moving product from LNG vessels to
onshore storage are available. Longer pipelines, which allow vessels to
offload LNG at a greater distance from port facilities, are under
development. This requires pipe-in-pipe technology due to requirements
for keeping the LNG cold.
LNG is transported using tanker trucks, railway tanker cars, and purpose built ships known as LNG carriers. LNG is sometimes taken to cryogenic temperatures to increase the tanker capacity. The first commercial ship-to-ship transfer (STS) transfers were undertaken in February 2007 at the Flotta facility in Scapa Flow with 132,000 m3 of LNG being passed between the vessels Excalibur and Excelsior. Transfers have also been carried out by Exmar Shipmanagement, the Belgian gas tanker owner in the Gulf of Mexico,
which involved the transfer of LNG from a conventional LNG carrier to
an LNG regasification vessel (LNGRV). Before this commercial exercise,
LNG had only ever been transferred between ships on a handful of
occasions as a necessity following an incident. The Society of International Gas Tanker and Terminal Operators (SIGTTO)
is the responsible body for LNG operators around the world and seeks to
disseminate knowledge regarding the safe transport of LNG at sea.
Besides LNG vessels, LNG is also used in some aircraft.
Liquefied natural gas is used to transport natural gas over long
distances, often by sea. In most cases, LNG terminals are purpose-built
ports used exclusively to export or import LNG.
The United Kingdom has LNG import facilities for up to 50 billion cubic meters per year.
Refrigeration
The insulation, as efficient as it is, will not keep LNG cold enough
by itself. Inevitably, heat leakage will warm and vapourise the LNG.
Industry practice is to store LNG as a boiling cryogen. That is, the liquid is stored at its boiling point for the pressure at which it is stored (atmospheric pressure). As the vapour boils off, heat for the phase change
cools the remaining liquid. Because the insulation is very efficient,
only a relatively small amount of boil-off is necessary to maintain
temperature. This phenomenon is also called auto-refrigeration.
Natural gas could be considered the least environmentally harmful fossil fuel because it has the lowest CO2 emissions per unit of energy and is suitable for use in high efficiency combined cycle power stations. For an equivalent amount of heat, burning natural gas produces about 30 percent less carbon dioxide than burning petroleum and about 45 per cent less than burning coal. Biomethane is considered roughly CO2-neutral and avoids most of the CO2-emissions issue. If liquified (as LBM), it serves the same functions as LNG.
On a per kilometre transported basis, emissions from LNG are
lower than piped natural gas, which is a particular issue in Europe,
where significant amounts of gas are piped several thousand kilometres
from Russia. However, emissions from natural gas transported as LNG are
higher than those of natural gas produced locally to the point of
combustion, as emissions associated with transport are lower for the
latter.
However, on the West Coast of the United States, where up to three new
LNG importation terminals were proposed before the U.S. fracking boom,
environmental groups, such as Pacific Environment, Ratepayers for Affordable Clean Energy (RACE), and Rising Tide had moved to oppose them.
They claimed that, while natural gas power plants emit approximately
half the carbon dioxide of an equivalent coal power plant, the natural
gas combustion required to produce and transport LNG to the plants adds
20 to 40 percent more carbon dioxide than burning natural gas alone. A 2015 peer-reviewed study evaluated the full end-to-end life cycle of LNG produced in the U.S. and consumed in Europe or Asia. It concluded that global CO2 production would be reduced due to the resulting reduction in other fossil fuels burned.
Green-bordered white diamond symbol used on LNG-powered vehicles in China
Some scientists and local residents have raised concerns about the potential effect of Poland's underground LNG storage infrastructure on marine life in the Baltic Sea. Similar concerns were raised in Croatia.
Safety and accidents
Natural gas is a fuel and a combustible
substance. To ensure safe and reliable operation, particular measures
are taken in the design, construction and operation of LNG facilities.
In maritime transport, the regulations for the use of LNG as a marine
fuel are set out in the IGF Code.
In its liquid state, LNG is not explosive and can not ignite. For
LNG to burn, it must first vaporize, then mix with air in the proper
proportions (the flammable range
is 5 percent to 15 percent), and then be ignited. In the case of a
leak, LNG vaporizes rapidly, turning into a gas (methane plus trace
gases), and mixing with air. If this mixture is within the flammable range, there is risk of ignition, which would create fire and thermal radiation hazards.
Gas venting from vehicles powered by LNG may create a
flammability hazard if parked indoors for longer than a week.
Additionally, due to its low temperature, refueling an LNG-powered
vehicle requires training to avoid the risk of frostbite.
LNG tankers have sailed over 100 million miles without a shipboard death or even a major accident.
Several on-site accidents involving or related to LNG are listed below:
October 20, 1944, Cleveland, Ohio, U.S. The East Ohio Natural Gas Co. experienced a failure of an LNG tank. 128 people perished in the explosion and fire.
The tank did not have a dike retaining wall, and it was made during
World War II, when metal rationing was very strict. The steel of the
tank was made with an extremely low amount of nickel,
which meant the tank was brittle when exposed to the cryogenic nature
of LNG. The tank ruptured, spilling LNG into the city sewer system. The
LNG vaporized and turned into gas, which exploded and burned.
February 10, 1973, Staten Island, New York, U.S. During a cleaning operation, 42 workers were inside one of the TETCo
LNG tanks, which had supposedly been completely drained ten months
earlier. However, ignition occurred, causing a plume of combusting gas
to rise within the tank. Two workers near the top felt the heat and
rushed to the safety of scaffolding outside, while the other 40 workers died as the concrete cap on the tank rose 20–30 feet in the air and then came crashing back down, crushing them to death.
October 6, 1979, Lusby, Maryland, US. A pump seal failed at the Cove Point LNG import facility, releasing natural gas vapors (not LNG), which entered an electrical conduit.
A worker switched off a circuit breaker, which ignited the gas vapors.
The resulting explosion killed a worker, severely injured another and
caused heavy damage to the building. A safety analysis was not required
at the time, and none was performed during the planning, design or
construction of the facility. National fire codes were changed as a result of the accident.
January 19, 2004, Skikda, Algeria. Explosion at Sonatrach LNG liquefaction facility.
27 killed, 56 injured, three LNG trains destroyed, a marine berth
damaged. 2004 production was reduced by 76 percent. Total loss was
US$900 million. A steam boiler that was part of an LNG liquefaction
train exploded, triggering a massive hydrocarbon gas explosion. The
explosion occurred where propane and ethane refrigeration storage were
located. Site distribution of the units caused a domino effect of explosions.
It remains unclear if LNG or LNG vapour, or other hydrocarbon gases
forming part of the liquefaction process initiated the explosions. One
report, of the US Government Team Site Inspection of the Sonatrach
Skikda LNG Plant in Skikda, Algeria, March 12–16, 2004, has cited it was
a leak of hydrocarbons from the refrigerant (liquefaction) process
system.
On 8 May 2018, the United States withdrew from the Joint Comprehensive Plan of Action with Iran, reinstating Iran sanctions against their nuclear program. In response, Iran threatened to close off the Strait of Hormuz to international shipping. The Strait of Hormuz is a strategic route through which a third of the world's LNG passes from Middle East producers.
In January 2024, Qatar halted tankers of liquefied natural gas through the strait of Bab-el-Mandeb after US-led airstrikes on Houthi targets in Yemen increased risks in the strait. The LNG tankers were forced to sail around Africa via the Cape of Good Hope to avoid the war zone.


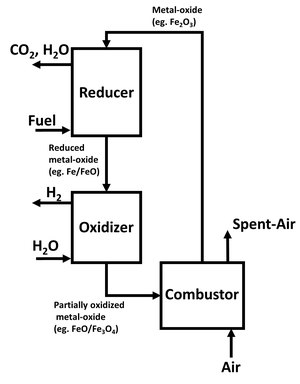


.jpg)
.jpg)


