Search This Blog

Monday, August 8, 2022

Color vision

From Wikipedia, the free encyclopedia
 
Colorless, green, and red photographic filters as imaged by camera

Color vision, a feature of visual perception, is an ability to perceive differences between light composed of different wavelengths (i.e., different spectral power distributions) independently of light intensity. Color perception is a part of the larger visual system and is mediated by a complex process between neurons that begins with differential stimulation of different types of photoreceptors by light entering the eye. Those photoreceptors then emit outputs that are propagated through many layers of neurons and then ultimately to the brain. Color vision is found in many animals and is mediated by similar underlying mechanisms with common types of biological molecules and a complex history of evolution in different animal taxa. In primates, color vision may have evolved under selective pressure for a variety of visual tasks including the foraging for nutritious young leaves, ripe fruit, and flowers, as well as detecting predator camouflage and emotional states in other primates.

Wavelength

sRGB rendering of the spectrum of visible light
Color Wavelength
(nm)
Frequency
(THz)
Photon energy
(eV)
  violet
380–450 670–790 2.75–3.26
  blue
450–485 620–670 2.56–2.75
  cyan
485–500 600–620 2.48–2.56
  green
500–565 530–600 2.19–2.48
  yellow
565–590 510–530 2.10–2.19
  orange
590–625 480–510 1.98–2.10
  red
625–750 400–480 1.65–1.98

Isaac Newton discovered that white light after being split into its component colors when passed through a dispersive prism could be recombined to make white light by passing them through a different prism.

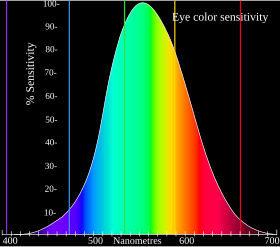
Photopic relative brightness sensitivity of the human visual system as a function of wavelength (luminosity function)

The visible light spectrum ranges from about 380 to 740 nanometers. Spectral colors (colors that are produced by a narrow band of wavelengths) such as red, orange, yellow, green, cyan, blue, and violet can be found in this range. These spectral colors do not refer to a single wavelength, but rather to a set of wavelengths: red, 625–740 nm; orange, 590–625 nm; yellow, 565–590 nm; green, 500–565 nm; cyan, 485–500 nm; blue, 450–485 nm; violet, 380–450 nm.

Wavelengths longer or shorter than this range are called infrared or ultraviolet, respectively. Humans cannot generally see these wavelengths, but other animals may.

Hue detection

Sufficient differences in wavelength cause a difference in the perceived hue; the just-noticeable difference in wavelength varies from about 1 nm in the blue-green and yellow wavelengths to 10 nm and more in the longer red and shorter blue wavelengths. Although the human eye can distinguish up to a few hundred hues, when those pure spectral colors are mixed together or diluted with white light, the number of distinguishable chromaticities can be quite high.

In very low light levels, vision is scotopic: light is detected by rod cells of the retina. Rods are maximally sensitive to wavelengths near 500 nm and play little, if any, role in color vision. In brighter light, such as daylight, vision is photopic: light is detected by cone cells which are responsible for color vision. Cones are sensitive to a range of wavelengths, but are most sensitive to wavelengths near 555 nm. Between these regions, mesopic vision comes into play and both rods and cones provide signals to the retinal ganglion cells. The shift in color perception from dim light to daylight gives rise to differences known as the Purkinje effect.

The perception of "white" is formed by the entire spectrum of visible light, or by mixing colors of just a few wavelengths in animals with few types of color receptors. In humans, white light can be perceived by combining wavelengths such as red, green, and blue, or just a pair of complementary colors such as blue and yellow.

Non-spectral colors

There are a variety of colors in addition to spectral colors and their hues. These include grayscale colors, shades of colors obtained by mixing grayscale colors with spectral colors, violet-red colors, impossible colors, and metallic colors.

Grayscale colors include white, gray, and black. Rods contain rhodopsin, which reacts to light intensity, providing grayscale coloring.

Shades include colors such as pink or brown. Pink is obtained from mixing red and white. Brown may be obtain from mixing orange with gray or black. Navy is obtained from mixing blue and black.

Violet-red colors include hues and shades of magenta. The light spectrum is a line on which violet is one end and the other is red, and yet we see hues of purple that connect those two colors.

Impossible colors are a combination of cone responses that cannot be naturally produced. For example, medium cones cannot be activated completely on their own; if they were, we would see a 'hyper-green' color.

Physiology of color perception

Normalized response spectra of human cones, to monochromatic spectral stimuli, with wavelength given in nanometers.
 
The same figures as above represented here as a single curve in three (normalized cone response) dimensions

Perception of color begins with specialized retinal cells known as cone cells. Cone cells contain different forms of opsin – a pigment protein – that have different spectral sensitivities. Humans contain three types, resulting in trichromatic color vision.

Each individual cone contains pigments composed of opsin apoprotein covalently linked to a light-absorbing prosthetic group: either 11-cis-hydroretinal or, more rarely, 11-cis-dehydroretinal.

The cones are conventionally labeled according to the ordering of the wavelengths of the peaks of their spectral sensitivities: short (S), medium (M), and long (L) cone types. These three types do not correspond well to particular colors as we know them. Rather, the perception of color is achieved by a complex process that starts with the differential output of these cells in the retina and which is finalized in the visual cortex and associative areas of the brain.

For example, while the L cones have been referred to simply as red receptors, microspectrophotometry has shown that their peak sensitivity is in the greenish-yellow region of the spectrum. Similarly, the S cones and M cones do not directly correspond to blue and green, although they are often described as such. The RGB color model, therefore, is a convenient means for representing color but is not directly based on the types of cones in the human eye.

The peak response of human cone cells varies, even among individuals with so-called normal color vision; in some non-human species this polymorphic variation is even greater, and it may well be adaptive.

Theories

Opponent process theory.

Two complementary theories of color vision are the trichromatic theory and the opponent process theory. The trichromatic theory, or Young–Helmholtz theory, proposed in the 19th century by Thomas Young and Hermann von Helmholtz, posits three types of cones preferentially sensitive to blue, green, and red, respectively. Ewald Hering proposed the opponent process theory in 1872. It states that the visual system interprets color in an antagonistic way: red vs. green, blue vs. yellow, black vs. white. Both theories are generally accepted as valid, describing different stages in visual physiology, visualized in the adjacent diagram.

Green–magenta and blue—yellow are scales with mutually exclusive boundaries. In the same way that there cannot exist a "slightly negative" positive number, a single eye cannot perceive a bluish-yellow or a reddish-green. Although these two theories are both currently widely accepted theories, past and more recent work has led to criticism of the opponent process theory, stemming from a number of what are presented as discrepancies in the standard opponent process theory. For example, the phenomenon of an after-image of complementary color can be induced by fatiguing the cells responsible for color perception, by staring at a vibrant color for a length of time, and then looking at a white surface. This phenomenon of complementary colors demonstrates cyan, rather than green, to be the complement of red and magenta, rather than red, to be the complement of green, as well as demonstrating, as a consequence, that the reddish-green color proposed to be impossible by opponent process theory is, in fact, the color yellow. Although this phenomenon is more readily explained by the trichromatic theory, explanations for the discrepancy may include alterations to the opponent process theory, such as redefining the opponent colors as red vs. cyan, to reflect this effect. Despite such criticisms, both theories remain in use.

A recent demonstration, using the Color Mondrian, has shown that, just as the color of a surface that is part of a complex 'natural' scene is independent of the wavelength-energy composition of the light reflected from it alone but depends upon the composition of the light reflected from its surrounds as well, so the after image produced by looking at a given part of a complex scene is also independent of the wavelength energy-composition of the light reflected from it alone. Thus, while the color of the after-image produced by looking at a green surface that is reflecting more "green" (middle-wave) than "red" (long-wave) light is magenta, so is the after image of the same surface when it reflects more "red" than "green" light (when it is still perceived as green). This would seem to rule out an explanation of color opponency based on retinal cone adaptation.

Cone cells in the human eye

Cones are present at a low density throughout most of the retina, with a sharp peak in the center of the fovea. Conversely, rods are present at high density throughout most of the retina, with a sharp decline in the fovea.

A range of wavelengths of light stimulates each of these receptor types to varying degrees. The brain combines the information from each type of receptor to give rise to different perceptions of different wavelengths of light.

Cone type Name Range Peak wavelength
S β 400–500 nm 420–440 nm
M γ 450–630 nm 534–555 nm
L ρ 500–700 nm 564–580 nm

Cones and rods are not evenly distributed in the human eye. Cones have a high density at the fovea and a low density in the rest of the retina. Thus color information is mostly taken in at the fovea. Humans have poor color perception in their peripheral vision, and much of the color we see in our periphery may be filled in by what our brains expect to be there on the basis of context and memories. However, our accuracy of color perception in the periphery increases with the size of stimulus.

The opsins (photopigments) present in the L and M cones are encoded on the X chromosome; defective encoding of these leads to the two most common forms of color blindness. The OPN1LW gene, which encodes the opsin present in the L cones, is highly polymorphic; one study found 85 variants in a sample of 236 men. A small percentage of women may have an extra type of color receptor because they have different alleles for the gene for the L opsin on each X chromosome. X chromosome inactivation means that while only one opsin is expressed in each cone cell, both types may occur overall, and some women may therefore show a degree of tetrachromatic color vision. Variations in OPN1MW, which encodes the opsin expressed in M cones, appear to be rare, and the observed variants have no effect on spectral sensitivity.

Color in the human brain

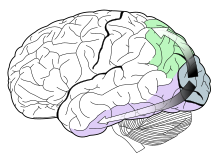
Visual pathways in the human brain. The ventral stream (purple) is important in color recognition. The dorsal stream (green) is also shown. They originate from a common source in the visual cortex.

Color processing begins at a very early level in the visual system (even within the retina) through initial color opponent mechanisms. Both Helmholtz's trichromatic theory and Hering's opponent-process theory are therefore correct, but trichromacy arises at the level of the receptors, and opponent processes arise at the level of retinal ganglion cells and beyond. In Hering's theory, opponent mechanisms refer to the opposing color effect of red-green, blue-yellow, and light-dark. However, in the visual system, it is the activity of the different receptor types that are opposed. Some midget retinal ganglion cells oppose L and M cone activity, which corresponds loosely to red–green opponency, but actually runs along an axis from blue-green to magenta. Small bistratified retinal ganglion cells oppose input from the S cones to input from the L and M cones. This is often thought to correspond to blue–yellow opponency but actually runs along a color axis from yellow-green to violet.

Visual information is then sent to the brain from retinal ganglion cells via the optic nerve to the optic chiasma: a point where the two optic nerves meet and information from the temporal (contralateral) visual field crosses to the other side of the brain. After the optic chiasma, the visual tracts are referred to as the optic tracts, which enter the thalamus to synapse at the lateral geniculate nucleus (LGN).

The lateral geniculate nucleus is divided into laminae (zones), of which there are three types: the M-laminae, consisting primarily of M-cells, the P-laminae, consisting primarily of P-cells, and the koniocellular laminae. M- and P-cells receive relatively balanced input from both L- and M-cones throughout most of the retina, although this seems to not be the case at the fovea, with midget cells synapsing in the P-laminae. The koniocellular laminae receives axons from the small bistratified ganglion cells.

After synapsing at the LGN, the visual tract continues on back to the primary visual cortex (V1) located at the back of the brain within the occipital lobe. Within V1 there is a distinct band (striation). This is also referred to as "striate cortex", with other cortical visual regions referred to collectively as "extrastriate cortex". It is at this stage that color processing becomes much more complicated.

In V1 the simple three-color segregation begins to break down. Many cells in V1 respond to some parts of the spectrum better than others, but this "color tuning" is often different depending on the adaptation state of the visual system. A given cell that might respond best to long-wavelength light if the light is relatively bright might then become responsive to all wavelengths if the stimulus is relatively dim. Because the color tuning of these cells is not stable, some believe that a different, relatively small, population of neurons in V1 is responsible for color vision. These specialized "color cells" often have receptive fields that can compute local cone ratios. Such "double-opponent" cells were initially described in the goldfish retina by Nigel Daw; their existence in primates was suggested by David H. Hubel and Torsten Wiesel, first demonstrated by C.R. Michael and subsequently proven by Bevil Conway. As Margaret Livingstone and David Hubel showed, double opponent cells are clustered within localized regions of V1 called blobs, and are thought to come in two flavors, red–green and blue-yellow. Red-green cells compare the relative amounts of red-green in one part of a scene with the amount of red-green in an adjacent part of the scene, responding best to local color contrast (red next to green). Modeling studies have shown that double-opponent cells are ideal candidates for the neural machinery of color constancy explained by Edwin H. Land in his retinex theory.

When viewed in full size, this image contains about 16 million pixels, each corresponding to a different color in the full set of RGB colors. The human eye can distinguish about 10 million different colors.

From the V1 blobs, color information is sent to cells in the second visual area, V2. The cells in V2 that are most strongly color tuned are clustered in the "thin stripes" that, like the blobs in V1, stain for the enzyme cytochrome oxidase (separating the thin stripes are interstripes and thick stripes, which seem to be concerned with other visual information like motion and high-resolution form). Neurons in V2 then synapse onto cells in the extended V4. This area includes not only V4, but two other areas in the posterior inferior temporal cortex, anterior to area V3, the dorsal posterior inferior temporal cortex, and posterior TEO. Area V4 was initially suggested by Semir Zeki to be exclusively dedicated to color, and he later showed that V4 can be subdivided into subregions with very high concentrations of color cells separated from each other by zones with lower concentration of such cells though even the latter cells respond better to some wavelengths than to others, a finding confirmed by subsequent studies. The presence in V4 of orientation-selective cells led to the view that V4 is involved in processing both color and form associated with color but it is worth noting that the orientation selective cells within V4 are more broadly tuned than their counterparts in V1, V2 and V3. Color processing in the extended V4 occurs in millimeter-sized color modules called globs. This is the part of the brain in which color is first processed into the full range of hues found in color space.

Anatomical studies have shown that neurons in extended V4 provide input to the inferior temporal lobe. "IT" cortex is thought to integrate color information with shape and form, although it has been difficult to define the appropriate criteria for this claim. Despite this murkiness, it has been useful to characterize this pathway (V1 > V2 > V4 > IT) as the ventral stream or the "what pathway", distinguished from the dorsal stream ("where pathway") that is thought to analyze motion, among other features.

Subjectivity of color perception

Color is a feature of visual perception by an observer. There is a complex relationship between the wavelengths of light in the visual spectrum and human experiences of color. Although most people are assumed to have the same mapping, the philosopher John Locke recognized that alternatives are possible, and described one such hypothetical case with the "inverted spectrum" thought experiment. For example, someone with an inverted spectrum might experience green while seeing 'red' (700 nm) light, and experience red while seeing 'green' (530 nm) light. This inversion has never been demonstrated in experiment, though.

Synesthesia (or ideasthesia) provides some atypical but illuminating examples of subjective color experience triggered by input that is not even light, such as sounds or shapes. The possibility of a clean dissociation between color experience from properties of the world reveals that color is a subjective psychological phenomenon.

The Himba people have been found to categorize colors differently from most Westerners and are able to easily distinguish close shades of green, barely discernible for most people. The Himba have created a very different color scheme which divides the spectrum to dark shades (zuzu in Himba), very light (vapa), vivid blue and green (buru) and dry colors as an adaptation to their specific way of life.

The perception of color depends heavily on the context in which the perceived object is presented.

Psychophysical experiments have shown that color is perceived before the orientation of lines and directional motion by as much as 40ms and 80 ms respectively, thus leading to a perceptual asynchrony that is demonstrable with brief presentation times.

Chromatic adaptation

In color vision, chromatic adaptation refers to color constancy; the ability of the visual system to preserve the appearance of an object under a wide range of light sources. For example, a white page under blue, pink, or purple light will reflect mostly blue, pink, or purple light to the eye, respectively; the brain, however, compensates for the effect of lighting (based on the color shift of surrounding objects) and is more likely to interpret the page as white under all three conditions, a phenomenon known as color constancy.

In color science, chromatic adaptation is the estimation of the representation of an object under a different light source from the one in which it was recorded. A common application is to find a chromatic adaptation transform (CAT) that will make the recording of a neutral object appear neutral (color balance), while keeping other colors also looking realistic. For example, chromatic adaptation transforms are used when converting images between ICC profiles with different white points. Adobe Photoshop, for example, uses the Bradford CAT.

Color vision in nonhumans

Many species can see light with frequencies outside the human "visible spectrum". Bees and many other insects can detect ultraviolet light, which helps them to find nectar in flowers. Plant species that depend on insect pollination may owe reproductive success to ultraviolet "colors" and patterns rather than how colorful they appear to humans. Birds, too, can see into the ultraviolet (300–400 nm), and some have sex-dependent markings on their plumage that are visible only in the ultraviolet range. Many animals that can see into the ultraviolet range, however, cannot see red light or any other reddish wavelengths. For example, bees' visible spectrum ends at about 590 nm, just before the orange wavelengths start. Birds, however, can see some red wavelengths, although not as far into the light spectrum as humans. It is a myth that the common goldfish is the only animal that can see both infrared and ultraviolet light; their color vision extends into the ultraviolet but not the infrared.

The basis for this variation is the number of cone types that differ between species. Mammals, in general, have a color vision of a limited type, and usually have red-green color blindness, with only two types of cones. Humans, some primates, and some marsupials see an extended range of colors, but only by comparison with other mammals. Most non-mammalian vertebrate species distinguish different colors at least as well as humans, and many species of birds, fish, reptiles, and amphibians, and some invertebrates, have more than three cone types and probably superior color vision to humans.

In most Catarrhini (Old World monkeys and apes—primates closely related to humans), there are three types of color receptors (known as cone cells), resulting in trichromatic color vision. These primates, like humans, are known as trichromats. Many other primates (including New World monkeys) and other mammals are dichromats, which is the general color vision state for mammals that are active during the day (i.e., felines, canines, ungulates). Nocturnal mammals may have little or no color vision. Trichromat non-primate mammals are rare.

Many invertebrates have color vision. Honeybees and bumblebees have trichromatic color vision which is insensitive to red but sensitive to ultraviolet. Osmia rufa, for example, possess a trichromatic color system, which they use in foraging for pollen from flowers. In view of the importance of color vision to bees one might expect these receptor sensitivities to reflect their specific visual ecology; for example the types of flowers that they visit. However, the main groups of hymenopteran insects excluding ants (i.e., bees, wasps and sawflies) mostly have three types of photoreceptor, with spectral sensitivities similar to the honeybee's. Papilio butterflies possess six types of photoreceptors and may have pentachromatic vision. The most complex color vision system in the animal kingdom has been found in stomatopods (such as the mantis shrimp) having between 12 and 16 spectral receptor types thought to work as multiple dichromatic units.

Vertebrate animals such as tropical fish and birds sometimes have more complex color vision systems than humans; thus the many subtle colors they exhibit generally serve as direct signals for other fish or birds, and not to signal mammals. In bird vision, tetrachromacy is achieved through up to four cone types, depending on species. Each single cone contains one of the four main types of vertebrate cone photopigment (LWS/ MWS, RH2, SWS2 and SWS1) and has a colored oil droplet in its inner segment. Brightly colored oil droplets inside the cones shift or narrow the spectral sensitivity of the cell. Pigeons may be pentachromats.

Reptiles and amphibians also have four cone types (occasionally five), and probably see at least the same number of colors that humans do, or perhaps more. In addition, some nocturnal geckos and frogs have the capability of seeing color in dim light. At least some color-guided behaviors in amphibians have also been shown to be wholly innate, developing even in visually deprived animals.

In the evolution of mammals, segments of color vision were lost, then for a few species of primates, regained by gene duplication. Eutherian mammals other than primates (for example, dogs, mammalian farm animals) generally have less-effective two-receptor (dichromatic) color perception systems, which distinguish blue, green, and yellow—but cannot distinguish oranges and reds. There is some evidence that a few mammals, such as cats, have redeveloped the ability to distinguish longer wavelength colors, in at least a limited way, via one-amino-acid mutations in opsin genes. The adaptation to see reds is particularly important for primate mammals, since it leads to the identification of fruits, and also newly sprouting reddish leaves, which are particularly nutritious.

However, even among primates, full color vision differs between New World and Old World monkeys. Old World primates, including monkeys and all apes, have vision similar to humans. New World monkeys may or may not have color sensitivity at this level: in most species, males are dichromats, and about 60% of females are trichromats, but the owl monkeys are cone monochromats, and both sexes of howler monkeys are trichromats. Visual sensitivity differences between males and females in a single species is due to the gene for yellow-green sensitive opsin protein (which confers ability to differentiate red from green) residing on the X sex chromosome.

Several marsupials, such as the fat-tailed dunnart (Sminthopsis crassicaudata), have trichromatic color vision.

Marine mammals, adapted for low-light vision, have only a single cone type and are thus monochromats.

Evolution

Color perception mechanisms are highly dependent on evolutionary factors, of which the most prominent is thought to be satisfactory recognition of food sources. In herbivorous primates, color perception is essential for finding proper (immature) leaves. In hummingbirds, particular flower types are often recognized by color as well. On the other hand, nocturnal mammals have less-developed color vision since adequate light is needed for cones to function properly. There is evidence that ultraviolet light plays a part in color perception in many branches of the animal kingdom, especially insects. In general, the optical spectrum encompasses the most common electronic transitions in the matter and is therefore the most useful for collecting information about the environment.

The evolution of trichromatic color vision in primates occurred as the ancestors of modern monkeys, apes, and humans switched to diurnal (daytime) activity and began consuming fruits and leaves from flowering plants. Color vision, with UV discrimination, is also present in a number of arthropods—the only terrestrial animals besides the vertebrates to possess this trait.

Some animals can distinguish colors in the ultraviolet spectrum. The UV spectrum falls outside the human visible range, except for some cataract surgery patients. Birds, turtles, lizards, many fish and some rodents have UV receptors in their retinas. These animals can see the UV patterns found on flowers and other wildlife that are otherwise invisible to the human eye.

Ultraviolet vision is an especially important adaptation in birds. It allows birds to spot small prey from a distance, navigate, avoid predators, and forage while flying at high speeds. Birds also utilize their broad spectrum vision to recognize other birds, and in sexual selection.

Mathematics of color perception

A "physical color" is a combination of pure spectral colors (in the visible range). In principle there exist infinitely many distinct spectral colors, and so the set of all physical colors may be thought of as an infinite-dimensional vector space (a Hilbert space). This space is typically notated Hcolor. More technically, the space of physical colors may be considered to be the topological cone over the simplex whose vertices are the spectral colors, with white at the centroid of the simplex, black at the apex of the cone, and the monochromatic color associated with any given vertex somewhere along the line from that vertex to the apex depending on its brightness.

An element C of Hcolor is a function from the range of visible wavelengths—considered as an interval of real numbers [Wmin,Wmax]—to the real numbers, assigning to each wavelength w in [Wmin,Wmax] its intensity C(w).

A humanly perceived color may be modeled as three numbers: the extents to which each of the 3 types of cones is stimulated. Thus a humanly perceived color may be thought of as a point in 3-dimensional Euclidean space. We call this space R3color.

Since each wavelength w stimulates each of the 3 types of cone cells to a known extent, these extents may be represented by 3 functions s(w), m(w), l(w) corresponding to the response of the S, M, and L cone cells, respectively.

Finally, since a beam of light can be composed of many different wavelengths, to determine the extent to which a physical color C in Hcolor stimulates each cone cell, we must calculate the integral (with respect to w), over the interval [Wmin,Wmax], of C(ws(w), of C(wm(w), and of C(wl(w). The triple of resulting numbers associates with each physical color C (which is an element in Hcolor) a particular perceived color (which is a single point in R3color). This association is easily seen to be linear. It may also easily be seen that many different elements in the "physical" space Hcolor can all result in the same single perceived color in R3color, so a perceived color is not unique to one physical color.

Thus human color perception is determined by a specific, non-unique linear mapping from the infinite-dimensional Hilbert space Hcolor to the 3-dimensional Euclidean space R3color.

Technically, the image of the (mathematical) cone over the simplex whose vertices are the spectral colors, by this linear mapping, is also a (mathematical) cone in R3color. Moving directly away from the vertex of this cone represents maintaining the same chromaticity while increasing its intensity. Taking a cross-section of this cone yields a 2D chromaticity space. Both the 3D cone and its projection or cross-section are convex sets; that is, any mixture of spectral colors is also a color.

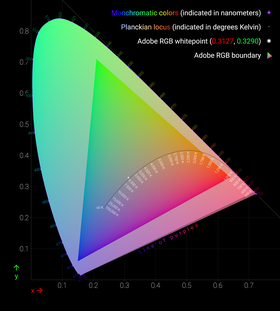
The CIE 1931 xy chromaticity diagram with a triangle showing the gamut of the Adobe RGB color space. The Planckian locus is shown with color temperatures labeled in kelvins. The outer curved boundary is the spectral (or monochromatic) locus, with wavelengths shown in nanometers. Note that the colors in this file are specified in Adobe RGB. Areas outside the triangle cannot be accurately rendered because they are out of the gamut of Adobe RGB, therefore they have been interpreted. Note that the colors depicted depend on the color space of the device you use to view the image (number of colors on your monitor, etc.), and may not be a strictly accurate representation of the color at a particular position.

In practice, it would be quite difficult to physiologically measure an individual's three cone responses to various physical color stimuli. Instead, a psychophysical approach is taken. Three specific benchmark test lights are typically used; let us call them S, M, and L. To calibrate human perceptual space, scientists allowed human subjects to try to match any physical color by turning dials to create specific combinations of intensities (IS, IM, IL) for the S, M, and L lights, resp., until a match was found. This needed only to be done for physical colors that are spectral, since a linear combination of spectral colors will be matched by the same linear combination of their (IS, IM, IL) matches. Note that in practice, often at least one of S, M, L would have to be added with some intensity to the physical test color, and that combination matched by a linear combination of the remaining 2 lights. Across different individuals (without color blindness), the matchings turned out to be nearly identical.

By considering all the resulting combinations of intensities (IS, IM, IL) as a subset of 3-space, a model for human perceptual color space is formed. (Note that when one of S, M, L had to be added to the test color, its intensity was counted as negative.) Again, this turns out to be a (mathematical) cone, not a quadric, but rather all rays through the origin in 3-space passing through a certain convex set. Again, this cone has the property that moving directly away from the origin corresponds to increasing the intensity of the S, M, L lights proportionately. Again, a cross-section of this cone is a planar shape that is (by definition) the space of "chromaticities" (informally: distinct colors); one particular such cross-section, corresponding to constant X+Y+Z of the CIE 1931 color space, gives the CIE chromaticity diagram.

This system implies that for any hue or non-spectral color not on the boundary of the chromaticity diagram, there are infinitely many distinct physical spectra that are all perceived as that hue or color. So, in general, there is no such thing as the combination of spectral colors that we perceive as (say) a specific version of tan; instead, there are infinitely many possibilities that produce that exact color. The boundary colors that are pure spectral colors can be perceived only in response to light that is purely at the associated wavelength, while the boundary colors on the "line of purples" can each only be generated by a specific ratio of the pure violet and the pure red at the ends of the visible spectral colors.

The CIE chromaticity diagram is horseshoe-shaped, with its curved edge corresponding to all spectral colors (the spectral locus), and the remaining straight edge corresponding to the most saturated purples, mixtures of red and violet.

Approximations of π

From Wikipedia, the free encyclopedia

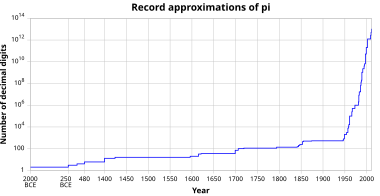
Graph showing the historical evolution of the record precision of numerical approximations to pi, measured in decimal places (depicted on a logarithmic scale; time before 1400 is not shown to scale).

Approximations for the mathematical constant pi (π) in the history of mathematics reached an accuracy within 0.04% of the true value before the beginning of the Common Era. In Chinese mathematics, this was improved to approximations correct to what corresponds to about seven decimal digits by the 5th century.

Further progress was not made until the 15th century (through the efforts of Jamshīd al-Kāshī). Early modern mathematicians reached an accuracy of 35 digits by the beginning of the 17th century (Ludolph van Ceulen), and 126 digits by the 19th century (Jurij Vega), surpassing the accuracy required for any conceivable application outside of pure mathematics.

The record of manual approximation of π is held by William Shanks, who calculated 527 digits correctly in 1853. Since the middle of the 20th century, the approximation of π has been the task of electronic digital computers (for a comprehensive account, see Chronology of computation of π). On June 8, 2022, the current record was established by Emma Haruka Iwao with Alexander Yee's y-cruncher with 100 trillion digits.

Early history

The best known approximations to π dating to before the Common Era were accurate to two decimal places; this was improved upon in Chinese mathematics in particular by the mid-first millennium, to an accuracy of seven decimal places. After this, no further progress was made until the late medieval period.

Some Egyptologists have claimed that the ancient Egyptians used an approximation of π as 227 = 3.142857 (about 0.04% too high) from as early as the Old Kingdom. This claim has been met with skepticism.

Babylonian mathematics usually approximated π to 3, sufficient for the architectural projects of the time (notably also reflected in the description of Solomon's Temple in the Hebrew Bible). The Babylonians were aware that this was an approximation, and one Old Babylonian mathematical tablet excavated near Susa in 1936 (dated to between the 19th and 17th centuries BCE) gives a better approximation of π as 258 = 3.125, about 0.528% below the exact value.

At about the same time, the Egyptian Rhind Mathematical Papyrus (dated to the Second Intermediate Period, c. 1600 BCE, although stated to be a copy of an older, Middle Kingdom text) implies an approximation of π as 25681 ≈ 3.16 (accurate to 0.6 percent) by calculating the area of a circle via approximation with the octagon.

Astronomical calculations in the Shatapatha Brahmana (c. 6th century BCE) use a fractional approximation of 339108 ≈ 3.139.

The Mahabharata (500 BCE - 300 CE) offers an approximation of 3, in the ratios offered in Bhishma Parva verses: 6.12.40-45.

...

The Moon is handed down by memory to be eleven thousand yojanas in diameter. Its peripheral circle happens to be thirty three thousand yojanas when calculated.
...
The Sun is eight thousand yojanas and another two thousand  yojanas in diameter. From that its peripheral circle comes to be equal to thirty thousand yojanas.

...

— "verses: 6.12.40-45, Bhishma Parva of the Mahabharata"

In the 3rd century BCE, Archimedes proved the sharp inequalities 22371 < π < 227, by means of regular 96-gons (accuracies of 2·10−4 and 4·10−4, respectively).

In the 2nd century CE, Ptolemy used the value 377120, the first known approximation accurate to three decimal places (accuracy 2·10−5). It is equal to which is accurate to two sexagesimal digits.

The Chinese mathematician Liu Hui in 263 CE computed π to between 3.141024 and 3.142708 by inscribing a 96-gon and 192-gon; the average of these two values is 3.141866 (accuracy 9·10−5). He also suggested that 3.14 was a good enough approximation for practical purposes. He has also frequently been credited with a later and more accurate result, π ≈ 39271250 = 3.1416 (accuracy 2·10−6), although some scholars instead believe that this is due to the later (5th-century) Chinese mathematician Zu Chongzhi. Zu Chongzhi is known to have computed π to be between 3.1415926 and 3.1415927, which was correct to seven decimal places. He also gave two other approximations of π: π ≈ 227 and π ≈ 355113, which are not as accurate as his decimal result. The latter fraction is the best possible rational approximation of π using fewer than five decimal digits in the numerator and denominator. Zu Chongzhi's results surpass the accuracy reached in Hellenistic mathematics, and would remain without improvement for close to a millennium.

In Gupta-era India (6th century), mathematician Aryabhata, in his astronomical treatise Āryabhaṭīya stated:

Add 4 to 100, multiply by 8 and add to 62,000. This is ‘approximately’ the circumference of a circle whose diameter is 20,000.

Approximating π to four decimal places: π ≈ 6283220000 = 3.1416, Aryabhata stated that his result "approximately" (āsanna "approaching") gave the circumference of a circle. His 15th-century commentator Nilakantha Somayaji (Kerala school of astronomy and mathematics) has argued that the word means not only that this is an approximation, but that the value is incommensurable (irrational).

Middle Ages

Further progress was not made for nearly a millennium, until the 14th century, when Indian mathematician and astronomer Madhava of Sangamagrama, founder of the Kerala school of astronomy and mathematics, found the Maclaurin series for arctangent, and then two infinite series for π. One of them is now known as the Madhava–Leibniz series, based on

The other was based on

Comparison of the convergence of two Madhava series (the one with 12 in dark blue) and several historical infinite series for π. Sn is the approximation after taking n terms. Each subsequent subplot magnifies the shaded area horizontally by 10 times.

He used the first 21 terms to compute an approximation of π correct to 11 decimal places as 3.14159265359.

He also improved the formula based on arctan(1) by including a correction:

It is not known how he came up with this correction. Using this he found an approximation of π to 13 decimal places of accuracy when n = 75.

Jamshīd al-Kāshī (Kāshānī), a Persian astronomer and mathematician, correctly computed the fractional part of 2π to 9 sexagesimal digits in 1424, and translated this into 16 decimal digits after the decimal point:

which gives 16 correct digits for π after the decimal point:

He achieved this level of accuracy by calculating the perimeter of a regular polygon with 3 × 228 sides.

16th to 19th centuries

In the second half of the 16th century, the French mathematician François Viète discovered an infinite product that converged on π known as Viète's formula.

The German-Dutch mathematician Ludolph van Ceulen (circa 1600) computed the first 35 decimal places of π with a 262-gon. He was so proud of this accomplishment that he had them inscribed on his tombstone.

In Cyclometricus (1621), Willebrord Snellius demonstrated that the perimeter of the inscribed polygon converges on the circumference twice as fast as does the perimeter of the corresponding circumscribed polygon. This was proved by Christiaan Huygens in 1654. Snellius was able to obtain seven digits of π from a 96-sided polygon.

In 1789, the Slovene mathematician Jurij Vega calculated the first 140 decimal places for π, of which the first 126 were correct, and held the world record for 52 years until 1841, when William Rutherford calculated 208 decimal places, of which the first 152 were correct. Vega improved John Machin's formula from 1706 and his method is still mentioned today.

The magnitude of such precision (152 decimal places) can be put into context by the fact that the circumference of the largest known object, the observable universe, can be calculated from its diameter (93 billion light-years) to a precision of less than one Planck length (at 1.6162×10⁻³⁵ meters, the shortest unit of length expected to be directly measurable) using π expressed to just 62 decimal places.

The English amateur mathematician William Shanks, a man of independent means, calculated π to 530 decimal places in January 1853, of which the first 527 were correct (the last few likely being incorrect due to round-off errors). He subsequently expanded his calculation to 607 decimal places in April 1853, but an error introduced right at the 530th decimal place rendered the rest of his calculation erroneous; due to the nature of Machin's formula, the error propagated back to the 528th decimal place, leaving only the first 527 digits correct once again. Twenty years later, Shanks expanded his calculation to 707 decimal places in April 1873. Due to this being an expansion of his previous calculation, all of the new digits were incorrect as well. Shanks was said to have calculated new digits all morning and would then spend all afternoon checking his morning's work. This was the longest expansion of π until the advent of the electronic digital computer three-quarters of a century later.

20th and 21st centuries

In 1910, the Indian mathematician Srinivasa Ramanujan found several rapidly converging infinite series of π, including

which computes a further eight decimal places of π with each term in the series. His series are now the basis for the fastest algorithms currently used to calculate π. Even using just the first term gives

See Ramanujan–Sato series.

From the mid-20th century onwards, all calculations of π have been done with the help of calculators or computers.

In 1944, D. F. Ferguson, with the aid of a mechanical desk calculator, found that William Shanks had made a mistake in the 528th decimal place, and that all succeeding digits were incorrect.

In the early years of the computer, an expansion of π to 100000 decimal places was computed by Maryland mathematician Daniel Shanks (no relation to the aforementioned William Shanks) and his team at the United States Naval Research Laboratory in Washington, D.C. In 1961, Shanks and his team used two different power series for calculating the digits of π. For one, it was known that any error would produce a value slightly high, and for the other, it was known that any error would produce a value slightly low. And hence, as long as the two series produced the same digits, there was a very high confidence that they were correct. The first 100,265 digits of π were published in 1962. The authors outlined what would be needed to calculate π to 1 million decimal places and concluded that the task was beyond that day's technology, but would be possible in five to seven years.

In 1989, the Chudnovsky brothers computed π to over 1 billion decimal places on the supercomputer IBM 3090 using the following variation of Ramanujan's infinite series of π:

Records since then have all been accomplished using the Chudnovsky algorithm. In 1999, Yasumasa Kanada and his team at the University of Tokyo computed π to over 200 billion decimal places on the supercomputer HITACHI SR8000/MPP (128 nodes) using another variation of Ramanujan's infinite series of π. In November 2002, Yasumasa Kanada and a team of 9 others used the Hitachi SR8000, a 64-node supercomputer with 1 terabyte of main memory, to calculate π to roughly 1.24 trillion digits in around 600 hours (25 days).

Recent Records

  1. In August 2009, a Japanese supercomputer called the T2K Open Supercomputer more than doubled the previous record by calculating π to roughly 2.6 trillion digits in approximately 73 hours and 36 minutes.
  2. In December 2009, Fabrice Bellard used a home computer to compute 2.7 trillion decimal digits of π. Calculations were performed in base 2 (binary), then the result was converted to base 10 (decimal). The calculation, conversion, and verification steps took a total of 131 days.
  3. In August 2010, Shigeru Kondo used Alexander Yee's y-cruncher to calculate 5 trillion digits of π. This was the world record for any type of calculation, but significantly it was performed on a home computer built by Kondo. The calculation was done between 4 May and 3 August, with the primary and secondary verifications taking 64 and 66 hours respectively.
  4. In October 2011, Shigeru Kondo broke his own record by computing ten trillion (1013) and fifty digits using the same method but with better hardware.
  5. In December 2013, Kondo broke his own record for a second time when he computed 12.1 trillion digits of π.
  6. In October 2014, Sandon Van Ness, going by the pseudonym "houkouonchi" used y-cruncher to calculate 13.3 trillion digits of π.
  7. In November 2016, Peter Trueb and his sponsors computed on y-cruncher and fully verified 22.4 trillion digits of π (22,459,157,718,361 (πe × 1012)). The computation took (with three interruptions) 105 days to complete, the limitation of further expansion being primarily storage space.
  8. In March 2019, Emma Haruka Iwao, an employee at Google, computed 31.4 (approximately 10π) trillion digits of pi using y-cruncher and Google Cloud machines. This took 121 days to complete.
  9. In January 2020, Timothy Mullican announced the computation of 50 trillion digits over 303 days.
  10. On August 14, 2021, a team (DAViS) at the University of Applied Sciences of the Grisons announced completion of the computation of π to 62.8 (approximately 20π) trillion digits.
  11. On June 8th 2022, Emma Haruka Iwao announced on the Google Cloud Blog the computation of 100 trillion (1014) digits of π over 158 days using Alexander Yee's y-cruncher.

Practical approximations

Depending on the purpose of a calculation, π can be approximated by using fractions for ease of calculation. The most notable such approximations are 227 (relative error of about 4·10−4) and 355113 (relative error of about 8·10−8).

Non-mathematical "definitions" of π

Of some notability are legal or historical texts purportedly "defining π" to have some rational value, such as the "Indiana Pi Bill" of 1897, which stated "the ratio of the diameter and circumference is as five-fourths to four" (which would imply "π = 3.2") and a passage in the Hebrew Bible that implies that π = 3.

Indiana bill

The so-called "Indiana Pi Bill" from 1897 has often been characterized as an attempt to "legislate the value of Pi". Rather, the bill dealt with a purported solution to the problem of geometrically "squaring the circle".

The bill was nearly passed by the Indiana General Assembly in the U.S., and has been claimed to imply a number of different values for π, although the closest it comes to explicitly asserting one is the wording "the ratio of the diameter and circumference is as five-fourths to four", which would make π = 165 = 3.2, a discrepancy of nearly 2 percent. A mathematics professor who happened to be present the day the bill was brought up for consideration in the Senate, after it had passed in the House, helped to stop the passage of the bill on its second reading, after which the assembly thoroughly ridiculed it before postponing it indefinitely.

Imputed biblical value

It is sometimes claimed that the Hebrew Bible implies that "π equals three", based on a passage in 1 Kings 7:23 and 2 Chronicles 4:2 giving measurements for the round basin located in front of the Temple in Jerusalem as having a diameter of 10 cubits and a circumference of 30 cubits.

The issue is discussed in the Talmud and in Rabbinic literature. Among the many explanations and comments are these:

  • Rabbi Nehemiah explained this in his Mishnat ha-Middot (the earliest known Hebrew text on geometry, ca. 150 CE) by saying that the diameter was measured from the outside rim while the circumference was measured along the inner rim. This interpretation implies a brim about 0.225 cubit (or, assuming an 18-inch "cubit", some 4 inches), or one and a third "handbreadths," thick (cf. NKJV and NKJV).
  • Maimonides states (ca. 1168 CE) that π can only be known approximately, so the value 3 was given as accurate enough for religious purposes. This is taken by some as the earliest assertion that π is irrational.

There is still some debate on this passage in biblical scholarship. Many reconstructions of the basin show a wider brim (or flared lip) extending outward from the bowl itself by several inches to match the description given in NKJV In the succeeding verses, the rim is described as "a handbreadth thick; and the brim thereof was wrought like the brim of a cup, like the flower of a lily: it received and held three thousand baths" NKJV, which suggests a shape that can be encompassed with a string shorter than the total length of the brim, e.g., a Lilium flower or a Teacup.

Development of efficient formulae

Polygon approximation to a circle

Archimedes, in his Measurement of a Circle, created the first algorithm for the calculation of π based on the idea that the perimeter of any (convex) polygon inscribed in a circle is less than the circumference of the circle, which, in turn, is less than the perimeter of any circumscribed polygon. He started with inscribed and circumscribed regular hexagons, whose perimeters are readily determined. He then shows how to calculate the perimeters of regular polygons of twice as many sides that are inscribed and circumscribed about the same circle. This is a recursive procedure which would be described today as follows: Let pk and Pk denote the perimeters of regular polygons of k sides that are inscribed and circumscribed about the same circle, respectively. Then,

Archimedes uses this to successively compute P12, p12, P24, p24, P48, p48, P96 and p96. Using these last values he obtains

It is not known why Archimedes stopped at a 96-sided polygon; it only takes patience to extend the computations. Heron reports in his Metrica (about 60 CE) that Archimedes continued the computation in a now lost book, but then attributes an incorrect value to him.

Archimedes uses no trigonometry in this computation and the difficulty in applying the method lies in obtaining good approximations for the square roots that are involved. Trigonometry, in the form of a table of chord lengths in a circle, was probably used by Claudius Ptolemy of Alexandria to obtain the value of π given in the Almagest (circa 150 CE).

Advances in the approximation of π (when the methods are known) were made by increasing the number of sides of the polygons used in the computation. A trigonometric improvement by Willebrord Snell (1621) obtains better bounds from a pair of bounds obtained from the polygon method. Thus, more accurate results were obtained from polygons with fewer sides. Viète's formula, published by François Viète in 1593, was derived by Viète using a closely related polygonal method, but with areas rather than perimeters of polygons whose numbers of sides are powers of two.

The last major attempt to compute π by this method was carried out by Grienberger in 1630 who calculated 39 decimal places of π using Snell's refinement.

Machin-like formula

For fast calculations, one may use formulae such as Machin's:

together with the Taylor series expansion of the function arctan(x). This formula is most easily verified using polar coordinates of complex numbers, producing:

({x,y} = {239, 132} is a solution to the Pell equation x2−2y2 = −1.)

Formulae of this kind are known as Machin-like formulae. Machin's particular formula was used well into the computer era for calculating record numbers of digits of π, but more recently other similar formulae have been used as well.

For instance, Shanks and his team used the following Machin-like formula in 1961 to compute the first 100,000 digits of π:

and they used another Machin-like formula,

as a check.

The record as of December 2002 by Yasumasa Kanada of Tokyo University stood at 1,241,100,000,000 digits. The following Machin-like formulae were used for this:

K. Takano (1982).

F. C. M. Størmer (1896).

Other classical formulae

Other formulae that have been used to compute estimates of π include:

Liu Hui (see also Viète's formula):

Madhava:

Euler:

Newton / Euler Convergence Transformation:

where (2k + 1)!! denotes the product of the odd integers up to 2k + 1.

Ramanujan:

David Chudnovsky and Gregory Chudnovsky:

Ramanujan's work is the basis for the Chudnovsky algorithm, the fastest algorithms used, as of the turn of the millennium, to calculate π.

Modern algorithms

Extremely long decimal expansions of π are typically computed with iterative formulae like the Gauss–Legendre algorithm and Borwein's algorithm. The latter, found in 1985 by Jonathan and Peter Borwein, converges extremely quickly:

For and

where , the sequence converges quartically to π, giving about 100 digits in three steps and over a trillion digits after 20 steps. The Gauss–Legendre algorithm (with time complexity , using Harvey–Hoeven multiplication algorithm) is asymptotically faster than the Chudnovsky algorithm (with time complexity ) – but which of these algorithms is faster in practice for "small enough" depends on technological factors such as memory sizes and access times. For breaking world records, the iterative algorithms are used less commonly than the Chudnovsky algorithm since they are memory-intensive.

The first one million digits of π and 1π are available from Project Gutenberg. A former calculation record (December 2002) by Yasumasa Kanada of Tokyo University stood at 1.24 trillion digits, which were computed in September 2002 on a 64-node Hitachi supercomputer with 1 terabyte of main memory, which carries out 2 trillion operations per second, nearly twice as many as the computer used for the previous record (206 billion digits). The following Machin-like formulae were used for this:

(Kikuo Takano (1982))
(F. C. M. Størmer (1896)).

These approximations have so many digits that they are no longer of any practical use, except for testing new supercomputers. Properties like the potential normality of π will always depend on the infinite string of digits on the end, not on any finite computation.

Miscellaneous approximations

Historically, base 60 was used for calculations. In this base, π can be approximated to eight (decimal) significant figures with the number 3;8,29,4460, which is

(The next sexagesimal digit is 0, causing truncation here to yield a relatively good approximation.)

In addition, the following expressions can be used to estimate π:

  • accurate to three digits:
  • accurate to three digits:
Karl Popper conjectured that Plato knew this expression, that he believed it to be exactly π, and that this is responsible for some of Plato's confidence in the omnicompetence of mathematical geometry—and Plato's repeated discussion of special right triangles that are either isosceles or halves of equilateral triangles.
  • accurate to four digits:
  • accurate to four digits (or five significant figures):
  • an approximation by Ramanujan, accurate to 4 digits (or five significant figures):
  • accurate to five digits:
  • accurate to six digits:
 
  • accurate to seven digits:
- inverse of first term of Ramanujan series.
  • accurate to eight digits:
  • accurate to nine digits:
This is from Ramanujan, who claimed the Goddess of Namagiri appeared to him in a dream and told him the true value of π.
  • accurate to ten digits:
  • accurate to ten digits:
  • accurate to ten digits (or eleven significant figures):
This curious approximation follows the observation that the 193rd power of 1/π yields the sequence 1122211125... Replacing 5 by 2 completes the symmetry without reducing the correct digits of π, while inserting a central decimal point remarkably fixes the accompanying magnitude at 10100.
  • accurate to eleven digits:
  • accurate to twelve digits:
  • accurate to 16 digits:
- inverse of sum of first two terms of Ramanujan series.
  • accurate to 18 digits:
This is based on the fundamental discriminant d = 3(89) = 267 which has class number h(-d) = 2 explaining the algebraic numbers of degree 2. The core radical is 53 more than the fundamental unit which gives the smallest solution { x, y} = {500, 53} to the Pell equation x2 − 89y2 = −1.
  • accurate to 24 digits:
- inverse of sum of first three terms of Ramanujan series.
  • accurate to 30 decimal places:
Derived from the closeness of Ramanujan constant to the integer 6403203+744. This does not admit obvious generalizations in the integers, because there are only finitely many Heegner numbers and negative discriminants d with class number h(−d) = 1, and d = 163 is the largest one in absolute value.
  • accurate to 52 decimal places:
Like the one above, a consequence of the j-invariant. Among negative discriminants with class number 2, this d the largest in absolute value.
  • accurate to 161 decimal places:
where u is a product of four simple quartic units,
and,
Based on one found by Daniel Shanks. Similar to the previous two, but this time is a quotient of a modular form, namely the Dedekind eta function, and where the argument involves . The discriminant d = 3502 has h(−d) = 16.
  • The continued fraction representation of π can be used to generate successive best rational approximations. These approximations are the best possible rational approximations of π relative to the size of their denominators. Here is a list of the first thirteen of these:
Of these, is the only fraction in this sequence that gives more exact digits of π (i.e. 7) than the number of digits needed to approximate it (i.e. 6). The accuracy can be improved by using other fractions with larger numerators and denominators, but, for most such fractions, more digits are required in the approximation than correct significant figures achieved in the result.

Summing a circle's area

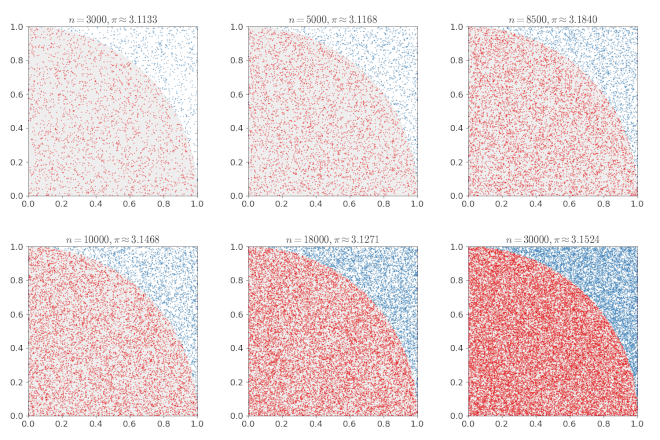
Numerical approximation of π: as points are randomly scattered inside the unit square, some fall within the unit circle. The fraction of points inside the circle approaches π/4 as points are added.

Pi can be obtained from a circle if its radius and area are known using the relationship:

If a circle with radius r is drawn with its center at the point (0, 0), any point whose distance from the origin is less than r will fall inside the circle. The Pythagorean theorem gives the distance from any point (xy) to the center:

Mathematical "graph paper" is formed by imagining a 1×1 square centered around each cell (xy), where x and y are integers between −r and r. Squares whose center resides inside or exactly on the border of the circle can then be counted by testing whether, for each cell (xy),

The total number of cells satisfying that condition thus approximates the area of the circle, which then can be used to calculate an approximation of π. Closer approximations can be produced by using larger values of r.

Mathematically, this formula can be written:

In other words, begin by choosing a value for r. Consider all cells (xy) in which both x and y are integers between −r and r. Starting at 0, add 1 for each cell whose distance to the origin (0,0) is less than or equal to r. When finished, divide the sum, representing the area of a circle of radius r, by r2 to find the approximation of π. For example, if r is 5, then the cells considered are:

(−5,5) (−4,5) (−3,5) (−2,5) (−1,5) (0,5) (1,5) (2,5) (3,5) (4,5) (5,5)
(−5,4) (−4,4) (−3,4) (−2,4) (−1,4) (0,4) (1,4) (2,4) (3,4) (4,4) (5,4)
(−5,3) (−4,3) (−3,3) (−2,3) (−1,3) (0,3) (1,3) (2,3) (3,3) (4,3) (5,3)
(−5,2) (−4,2) (−3,2) (−2,2) (−1,2) (0,2) (1,2) (2,2) (3,2) (4,2) (5,2)
(−5,1) (−4,1) (−3,1) (−2,1) (−1,1) (0,1) (1,1) (2,1) (3,1) (4,1) (5,1)
(−5,0) (−4,0) (−3,0) (−2,0) (−1,0) (0,0) (1,0) (2,0) (3,0) (4,0) (5,0)
(−5,−1) (−4,−1) (−3,−1) (−2,−1) (−1,−1) (0,−1) (1,−1) (2,−1) (3,−1) (4,−1) (5,−1)
(−5,−2) (−4,−2) (−3,−2) (−2,−2) (−1,−2) (0,−2) (1,−2) (2,−2) (3,−2) (4,−2) (5,−2)
(−5,−3) (−4,−3) (−3,−3) (−2,−3) (−1,−3) (0,−3) (1,−3) (2,−3) (3,−3) (4,−3) (5,−3)
(−5,−4) (−4,−4) (−3,−4) (−2,−4) (−1,−4) (0,−4) (1,−4) (2,−4) (3,−4) (4,−4) (5,−4)
(−5,−5) (−4,−5) (−3,−5) (−2,−5) (−1,−5) (0,−5) (1,−5) (2,−5) (3,−5) (4,−5) (5,−5)
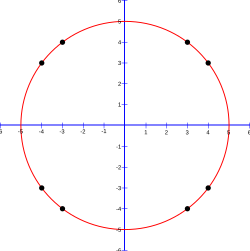
This circle as it would be drawn on a Cartesian coordinate graph. The cells (±3, ±4) and (±4, ±3) are labeled.

The 12 cells (0, ±5), (±5, 0), (±3, ±4), (±4, ±3) are exactly on the circle, and 69 cells are completely inside, so the approximate area is 81, and π is calculated to be approximately 3.24 because 8152 = 3.24. Results for some values of r are shown in the table below:

r area approximation of π
2 13 3.25
3 29 3.22222
4 49 3.0625
5 81 3.24
10 317 3.17
20 1257 3.1425
100 31417 3.1417
1000 3141549 3.141549

For related results see The circle problem: number of points (x,y) in square lattice with x^2 + y^2 <= n.

Similarly, the more complex approximations of π given below involve repeated calculations of some sort, yielding closer and closer approximations with increasing numbers of calculations.

Continued fractions

Besides its simple continued fraction representation [3; 7, 15, 1, 292, 1, 1, ...], which displays no discernible pattern, π has many generalized continued fraction representations generated by a simple rule, including these two.

The well-known values 227 and 355113 are respectively the second and fourth continued fraction approximations to π. (Other representations are available at The Wolfram Functions Site.)

Trigonometry

Gregory–Leibniz series

The Gregory–Leibniz series

is the power series for arctan(x) specialized to x = 1. It converges too slowly to be of practical interest. However, the power series converges much faster for smaller values of , which leads to formulae where arises as the sum of small angles with rational tangents, known as Machin-like formulae.

Arctangent

Knowing that 4 arctan 1 = π, the formula can be simplified to get:

with a convergence such that each additional 10 terms yields at least three more digits.

Another formula for involving arctangent function is given by

where such that . Approximations can be made by using, for example, the rapidly convergent Euler formula

Alternatively, the following simple expansion series of the arctangent function can be used

where

to approximate with even more rapid convergence. Convergence in this arctangent formula for improves as integer increases.

The constant can also be expressed by infinite sum of arctangent functions as

and

where is the n-th Fibonacci number. However, these two formulae for are much slower in convergence because of set of arctangent functions that are involved in computation.

Arcsine

Observing an equilateral triangle and noting that

yields

with a convergence such that each additional five terms yields at least three more digits.

Digit extraction methods

The Bailey–Borwein–Plouffe formula (BBP) for calculating π was discovered in 1995 by Simon Plouffe. Using base 16 math, the formula can compute any particular digit of π—returning the hexadecimal value of the digit—without having to compute the intervening digits (digit extraction).

In 1996, Simon Plouffe derived an algorithm to extract the nth decimal digit of π (using base 10 math to extract a base 10 digit), and which can do so with an improved speed of O(n3(log n)3) time. The algorithm requires virtually no memory for the storage of an array or matrix so the one-millionth digit of π can be computed using a pocket calculator. However, it would be quite tedious and impractical to do so.

The calculation speed of Plouffe's formula was improved to O(n2) by Fabrice Bellard, who derived an alternative formula (albeit only in base 2 math) for computing π.

Efficient methods

Many other expressions for π were developed and published by Indian mathematician Srinivasa Ramanujan. He worked with mathematician Godfrey Harold Hardy in England for a number of years.

Extremely long decimal expansions of π are typically computed with the Gauss–Legendre algorithm and Borwein's algorithm; the Salamin–Brent algorithm, which was invented in 1976, has also been used.

In 1997, David H. Bailey, Peter Borwein and Simon Plouffe published a paper (Bailey, 1997) on a new formula for π as an infinite series:

This formula permits one to fairly readily compute the kth binary or hexadecimal digit of π, without having to compute the preceding k − 1 digits. Bailey's website contains the derivation as well as implementations in various programming languages. The PiHex project computed 64 bits around the quadrillionth bit of π (which turns out to be 0).

Fabrice Bellard further improved on BBP with his formula:

Other formulae that have been used to compute estimates of π include:

Newton.
Srinivasa Ramanujan.

This converges extraordinarily rapidly. Ramanujan's work is the basis for the fastest algorithms used, as of the turn of the millennium, to calculate π.

In 1988, David Chudnovsky and Gregory Chudnovsky found an even faster-converging series (the Chudnovsky algorithm):

.

The speed of various algorithms for computing pi to n correct digits is shown below in descending order of asymptotic complexity. M(n) is the complexity of the multiplication algorithm employed.

Algorithm Year Time complexity or Speed
Gauss–Legendre algorithm 1975
Chudnovsky algorithm 1988
Binary splitting of the arctan series in Machin's formula
Leibniz formula for π 1300s Sublinear convergence. Five billion terms for 10 correct decimal places

Projects

Pi Hex

Pi Hex was a project to compute three specific binary digits of π using a distributed network of several hundred computers. In 2000, after two years, the project finished computing the five trillionth (5*1012), the forty trillionth, and the quadrillionth (1015) bits. All three of them turned out to be 0.

Software for calculating π

Over the years, several programs have been written for calculating π to many digits on personal computers.

General purpose

Most computer algebra systems can calculate π and other common mathematical constants to any desired precision.

Functions for calculating π are also included in many general libraries for arbitrary-precision arithmetic, for instance Class Library for Numbers, MPFR and SymPy.

Special purpose

Programs designed for calculating π may have better performance than general-purpose mathematical software. They typically implement checkpointing and efficient disk swapping to facilitate extremely long-running and memory-expensive computations.

  • TachusPi by Fabrice Bellard is the program used by himself to compute world record number of digits of pi in 2009.
  • y-cruncher by Alexander Yee is the program which every world record holder since Shigeru Kondo in 2010 has used to compute world record numbers of digits. y-cruncher can also be used to calculate other constants and holds world records for several of them.
  • PiFast by Xavier Gourdon was the fastest program for Microsoft Windows in 2003. According to its author, it can compute one million digits in 3.5 seconds on a 2.4 GHz Pentium 4. PiFast can also compute other irrational numbers like e and 2. It can also work at lesser efficiency with very little memory (down to a few tens of megabytes to compute well over a billion (109) digits). This tool is a popular benchmark in the overclocking community. PiFast 4.4 is available from Stu's Pi page. PiFast 4.3 is available from Gourdon's page.
  • QuickPi by Steve Pagliarulo for Windows is faster than PiFast for runs of under 400 million digits. Version 4.5 is available on Stu's Pi Page below. Like PiFast, QuickPi can also compute other irrational numbers like e, 2, and 3. The software may be obtained from the Pi-Hacks Yahoo! forum, or from Stu's Pi page.
  • Super PI by Kanada Laboratory in the University of Tokyo is the program for Microsoft Windows for runs from 16,000 to 33,550,000 digits. It can compute one million digits in 40 minutes, two million digits in 90 minutes and four million digits in 220 minutes on a Pentium 90 MHz. Super PI version 1.9 is available from Super PI 1.9 page.

Personality theories of addiction

From Wikipedia, the free encyclopedia https://en.wikipedia.org/wiki/Personality_theories_of_addiction ...