Search This Blog

Wednesday, November 6, 2019

Last Glacial Maximum

From Wikipedia, the free encyclopedia
 
A map of sea surface temperature changes and glacial extent during the last glacial maximum
 
The Last Glacial Maximum (LGM) was the most recent time during the Last Glacial Period that ice sheets were at their greatest extent. Vast ice sheets covered much of North America, Northern Europe, and Asia and profoundly affected Earth's climate by causing drought, desertification, and a large drop in sea levels. According to Clark et al, growth of ice sheets commenced 33,000 years ago and maximum coverage was between 26,500 years and 19-20,000 years ago, when deglaciation commenced in the Northern Hemisphere, causing an abrupt rise in sea level. Decline of the West Antarctica ice sheet occurred between 14,000 and 15,000 years ago, consistent with evidence for another abrupt rise in the sea level about 14,500 ka ago.

The LGM is referred to in Britain as the Dimlington Stadial, dated by Nick Ashton to between 31,000 and 16,000 years. In the archaeology of Paleolithic Europe, the LGM spans the Aurignacian, Gravettian, Solutrean, Magdalenian and Périgordian cultures. 

The LGM was followed by the Late Glacial Interstadial.

Glacial climate

Evolution of temperatures in the Post-Glacial period according to Greenland ice cores.
 
Temperature proxies for the last 40,000 years.
 
According to Blue Marble 3000 (a video by the Zurich University of Applied Sciences), the average global temperature around 19,000 BC (about 21,000 years ago) was 9.0 °C (48.2 °F). This is about 6.0 °C (10.8°F) colder than the 2013-2017 average. 

According to the United States Geological Survey (USGS), permanent summer ice covered about 8% of Earth's surface and 25% of the land area during the last glacial maximum. The USGS also states that sea level was about 125 meters (410 feet) lower than in present times (2012).

When comparing to the present, the average global temperature was 15.0 °C (58.9 °F) for the 2013-2017 period. Currently (as of 2012), about 3.1% of Earth's surface and 10.7% of the land area is covered in year-round ice.

The formation of an ice sheet or ice cap requires both prolonged cold and precipitation (snow). Hence, despite having temperatures similar to those of glaciated areas in North America and Europe, East Asia remained unglaciated except at higher elevations. This difference was because the ice sheets in Europe produced extensive anticyclones above them.

These anticyclones generated air masses that were so dry on reaching Siberia and Manchuria that precipitation sufficient for the formation of glaciers could never occur (except in Kamchatka where these westerly winds lifted moisture from the Sea of Japan). The relative warmth of the Pacific Ocean due to the shutting down of the Oyashio Current and the presence of large 'east-west' mountain ranges were secondary factors preventing continental glaciation in Asia.

All over the world, climates at the Last Glacial Maximum were cooler and almost everywhere drier. In extreme cases, such as South Australia and the Sahel, rainfall could be diminished by up to 90% from present, with florae diminished to almost the same degree as in glaciated areas of Europe and North America. Even in less affected regions, rainforest cover was greatly diminished, especially in West Africa where a few refugia were surrounded by tropical grasslands.

The Amazon rainforest was split into two large blocks by extensive savanna, and the tropical rainforests of Southeast Asia probably were similarly affected, with deciduous forests expanding in their place except on the east and west extremities of the Sundaland shelf. Only in Central America and the Chocó region of Colombia did tropical rainforests remain substantially intact – probably due to the extraordinarily heavy rainfall of these regions. 

A map of vegetation patterns during the last glacial maximum.
 
Most of the world's deserts expanded. Exceptions were in what is now the western United States, where changes in the jet stream brought heavy rain to areas that are now desert and large pluvial lakes formed, the best known being Lake Bonneville in Utah. This also occurred in Afghanistan and Iran, where a major lake formed in the Dasht-e Kavir

In Australia, shifting sand dunes covered half the continent, whilst the Chaco and Pampas in South America became similarly dry. Present-day subtropical regions also lost most of their forest cover, notably in eastern Australia, the Atlantic Forest of Brazil, and southern China, where open woodland became dominant due to drier conditions. In northern China – unglaciated despite its cold climate – a mixture of grassland and tundra prevailed, and even here, the northern limit of tree growth was at least 20° farther south than today.

In the period before the Last Glacial Maximum, many areas that became completely barren desert were wetter than they are today, notably in southern Australia, where Aboriginal occupation is believed to coincide with a wet period between 40,000 and 60,000 years Before Present (BP, a formal measurement of uncalibrated radiocarbon years, counted from 1950 CE).

World impact

During the Last Glacial Maximum, much of the world was cold, dry, and inhospitable, with frequent storms and a dust-laden atmosphere. The dustiness of the atmosphere is a prominent feature in ice cores; dust levels were as much as 20 to 25 times greater than now. This was probably due to a number of factors: reduced vegetation, stronger global winds, and less precipitation to clear dust from the atmosphere. The massive sheets of ice locked away water, lowering the sea level, exposing continental shelves, joining land masses together, and creating extensive coastal plains. During the last glacial maximum, 21,000 years ago, the sea level was about 125 meters (about 410 feet) lower than it is today.

Europe

Northern Europe was largely covered by ice, the southern boundary of the ice sheets passing through Germany and Poland. This ice extended northward to cover Svalbard and Franz Josef Land and northeastward to occupy the Barents Sea, the Kara Sea and Novaya Zemlya, ending at the Taymyr Peninsula.

In northwestern Russia the Fennoscandian Ice Sheet reached its LGM extent 17 ka BP, five thousand years later than in Denmark, Germany and Western Poland. Outside the Baltic Shield, and in Russia in particular, the LGM ice margin of the Fennoscandian Ice Sheet was highly lobate. The main LGM lobes of Russia followed the Dvina, Vologda and Rybinsk basins respectively. Lobes originated as result of ice following shallow topographic depressions filled with a soft sediment substrate.

Permafrost covered Europe south of the ice sheet down to present-day Szeged in Southern Hungary. Ice covered the whole of Iceland and almost all of the British Isles with the exception of southern England. Britain was no more than a peninsula of Europe, its north capped in ice, and its south a polar desert.

Asia

There were ice sheets in modern Tibet (although scientists continue to debate the extent to which the Tibetan Plateau was covered with ice) as well as in Baltistan and Ladakh. In Southeast Asia, many smaller mountain glaciers formed, and permafrost covered Asia as far south as Beijing. Because of lowered sea levels, many of today's islands were joined to the continents: the Indonesian islands as far east as Borneo and Bali were connected to the Asian continent in a landmass called Sundaland. Palawan was also part of Sundaland, while the rest of the Philippine Islands formed one large island separated from the continent only by the Sibutu Passage and the Mindoro Strait.

Africa and the Middle East

In Africa and the Middle East, many smaller mountain glaciers formed, and the Sahara and other sandy deserts were greatly expanded in extent.

The Persian Gulf averages about 35 metres in depth and the seabed between Abu Dhabi and Qatar is even shallower, being mostly less than 15 metres deep. For thousands of years the Ur-Shatt (a confluence of the Tigris-Euphrates Rivers) provided fresh water to the Gulf, as it flowed through the Strait of Hormuz into the Gulf of Oman.

Bathymetric data suggests there were two palaeo-basins in the Persian Gulf. The central basin may have approached an area of 20,000 km2, comparable at its fullest extent to lakes such as Lake Malawi in Africa. Between 12,000 and 9000 years ago much of the Gulf floor would have remained exposed, only being flooded by the sea after 8,000 years ago.

It is estimated that annual average temperatures in Southern Africa were 6 °C lower than at present during the Last Glacial Maximum. This alone would however not have been enough to create a widespread glaciation or permafrost in the Drakensberg Mountains or the Lesotho Highlands. Seasonal freezing of the ground in the Lesotho Highlands might have reached depths of 2 meter or more below the surface. A few small glaciers did however develop during the Last Glacial Maximum, in particular in south-facing slopes. In the Hex River Mountains, in the Western Cape, block streams and terraces found near the summit of Matroosberg evidences past periglacial activity which likely occurred during the Last Glacial Maximum.

Australasia

The Australian mainland, New Guinea, Tasmania and many smaller islands comprised a single land mass. This continent is now referred to sometimes as Sahul.

Between Sahul and Sundaland – a peninsula of South East Asia that comprised present-day Malaysia and western and northern Indonesia – there remained an archipelago of islands known as Wallacea. The water gaps between these islands, Sahul and Sundaland were considerably narrower and fewer in number.

The two main islands of New Zealand, along with associated smaller islands, were joined as one landmass. Virtually all of the Southern Alps were under permanent ice, with glaciers extending into much of the surrounding high country.

North America

In North America, the ice covered essentially all of Canada and extended roughly to the Missouri and Ohio Rivers, and eastward to Manhattan. In addition to the large Cordilleran Ice Sheet in Canada and Montana, alpine glaciers advanced and (in some locations) ice caps covered much of the Rocky Mountains further south. Latitudinal gradients were so sharp that permafrost did not reach far south of the ice sheets except at high elevations. Glaciers forced the early human populations who had originally migrated from northeast Siberia into refugia, reshaping their genetic variation by mutation and drift. This phenomenon established the older haplogroups found among Native Americans, and later migrations are responsible for northern North American haplogroups.

On the Island of Hawaii, geologists have long recognized deposits formed by glaciers on Mauna Kea during recent ice ages. The latest work indicates that deposits of three glacial episodes since 150,000 to 200,000 years ago are preserved on the volcano. Glacial moraines on the volcano formed about 70,000 years ago and from about 40,000 to 13,000 years ago. If glacial deposits were formed on Mauna Loa, they have long since been buried by younger lava flows.

South America

During the Last Glacial Maximum valley glaciers in the southern Andes (38–43° S) merged and descended from the Andes occupying lacustrine and marine basins where they spread out forming large piedmont glacier lobes. Glaciers extended about 7 km west of the modern Llanquihue Lake but not more than 2 to 3 km south of it. Nahuel Huapi Lake in Argentina was also glaciated by the same time. Over most Chiloé glacier advance peaked in 26,000 yrs BP forming a long north-south moraine system along the eastern coast of Chiloé Island (41.5–43° S). By that time the glaciation at the latitude of Chiloé was of ice sheet type contrasting to the valley glaciation found further north in Chile.

Despite glacier advances much of the area west of Llanquihue Lake was still ice-free during the Last Glacial Maximum. During the coldest period of the Last Glacial Maximum vegetation at this location was dominated by Alpine herbs in wide open surfaces. The global warming that followed caused a slow change in vegetation towards a sparsely distributed vegetation dominated by Nothofagus species. Within this parkland vegetation Magellanic moorland alternated with Nothofagus forest, and as warming progressed even warm-climate trees begun to grow in the area. It is estimated that the tree line was depressed about 1000 m relative to present day elevations during the coldest period, but it rose gradually until 19,300 yr BP. At that time a cold reversal caused a replacement of much of the arboreal vegetation with Magellanic moorland and Alpine species.

Little is known about the extent of glaciers during Last Glacial Maximum north of the Chilean Lake District. To the north, in the dry Andes of Central and the Last Glacial Maximum is associated with increased humidity and the verified advance of at least some mountain glaciers.

In the Southern Hemisphere, the Patagonian Ice Sheet covered the whole southern third of Chile and adjacent areas of Argentina. On the western side of the Andes the ice sheet reached sea level as far north as in the 41 degrees south at Chacao Channel. The western coast of Patagonia was largely glaciated, but some authors have pointed out the possible existence of ice-free refugia for some plant species. On the eastern side of the Andes, glacier lobes occupied the depressions of Seno Skyring, Seno Otway, Inútil Bay, and Beagle Channel. On the Straits of Magellan, ice reached as far as Segunda Angostura.

Climate change (general concept)

From Wikipedia, the free encyclopedia
 
Climate change occurs when changes in Earth's climate system result in new weather patterns that remain in place for an extended period of time. This length of time can be as short as a few decades to as long as millions of years. Scientists have identified many episodes of climate change during Earth's geological history; more recently since the industrial revolution the climate has increasingly been affected by human activities driving global warming, and the terms are commonly used interchangeably in that context.

The climate system receives nearly all of its energy from the sun. The climate system also gives off energy to outer space. The balance of incoming and outgoing energy, and the passage of the energy through the climate system, determines Earth's energy budget. When the incoming energy is greater than the outgoing energy, earth's energy budget is positive and the climate system is warming. If more energy goes out, the energy budget is negative and earth experiences cooling.

The energy moving through Earth's climate system finds expression in weather, varying on geographic scales and time. Long-term averages of weather in a region constitute the region's climate. Climate change is a long-term, sustained trend of change in climate. Such changes can be the result of "internal variability", when natural processes inherent to the various parts of the climate system alter the distribution of energy. Examples include variability in ocean basins such as the Pacific decadal oscillation and Atlantic multidecadal oscillation. Climate change can also result from external forcing, when events outside of the climate system's components nonetheless produce changes within the system. Examples include changes in solar output and volcanism.

Climate change has various consequences for sea level changes, plant life, mass extinctions and also affects human societies.

Terminology

The most general definition of climate change is a change in the statistical properties (principally its mean and spread) of meteorological variables when considered over long periods of time, regardless of cause. Accordingly, fluctuations over periods shorter than a few decades, such as El Niño, do not represent climate change.

The term "climate change" is often used to refer specifically to anthropogenic climate change (also known as global warming). Anthropogenic climate change is caused by human activity, as opposed to changes in climate that may have resulted as part of Earth's natural processes. In this sense, especially in the context of environmental policy, the term climate change has become synonymous with anthropogenic global warming. Within scientific journals, global warming refers to surface temperature increases while climate change includes global warming and everything else that increasing greenhouse gas levels affect.

A related term, "climatic change", was proposed by the World Meteorological Organization (WMO) in 1966 to encompass all forms of climatic variability on time-scales longer than 10 years, but regardless of cause. During the 1970s, the term climate change replaced climatic change to focus on anthropogenic causes, as it became clear that human activities had a potential to drastically alter the climate. Climate change was incorporated in the title of the Intergovernmental Panel on Climate Change (IPCC) and the UN Framework Convention on Climate Change (UNFCCC). Climate change is now used as both a technical description of the process, as well as a noun used to describe the problem.

Causes

On the broadest scale, the rate at which energy is received from the Sun and the rate at which it is lost to space determine the equilibrium temperature and climate of Earth. This energy is distributed around the globe by winds, ocean currents, and other mechanisms to affect the climates of different regions.

Factors that can shape climate are called climate forcings or "forcing mechanisms". These include processes such as variations in solar radiation, variations in the Earth's orbit, variations in the albedo or reflectivity of the continents, atmosphere, and oceans, mountain-building and continental drift and changes in greenhouse gas concentrations. There are a variety of climate change feedbacks that can either amplify or diminish the initial forcing. Some parts of the climate system, such as the oceans and ice caps, respond more slowly in reaction to climate forcings, while others respond more quickly. There are also key threshold factors which when exceeded can produce rapid change.

Climate change can either occur due to external forcing or due to internal processes. Internal unforced processes often involve changes in the distribution of energy in the ocean and atmosphere, for instance changes in the thermohaline circulation. External forcing mechanisms can be either anthropogenic (e.g. increased emissions of greenhouse gases and dust) or natural (e.g., changes in solar output, the earth's orbit, volcano eruptions).

The response of the climate system to a climate forcing might be fast (e.g., a sudden cooling due to airborne volcanic ash reflecting sunlight), slow (e.g. thermal expansion of warming ocean water), or a combination (e.g., sudden loss of albedo in the Arctic Ocean as sea ice melts, followed by more gradual thermal expansion of the water). Therefore, the climate system can respond abruptly, but the full response to forcing mechanisms might not be fully developed for centuries or even longer.

Internal variability

 
Scientists generally define the five components of earth's climate system to include atmosphere, hydrosphere, cryosphere, lithosphere (restricted to the surface soils, rocks, and sediments), and biosphere. Natural changes in the climate system result in internal "climate variability". Examples include the type and distribution of species, and changes in ocean-atmosphere circulations.

Climate change due to internal variability sometimes occurs in cycles or oscillations, for instance every 100 or 2000 years. For other types of natural climatic change, we cannot predict when it happens; the change is called random or stochastic. From a climate perspective, the weather can be considered as being random. If there are little clouds in a particular year, there is an energy imbalance and extra heat can be absorbed by the oceans. Due to climate inertia, this signal can be 'stored' in the ocean and be expressed as variability on longer time scales than the original weather disturbances. If the weather disturbances are completely random, occurring as white noise, the inertia of glaciers or oceans can transform this into climate changes where longer-duration oscillations are also larger oscillations, a phenomenon called red noise. Many climate changes have a random aspect and a cyclical aspect. This behavior is dubbed stochastic resonance.

Ocean-atmosphere variability

The ocean and atmosphere can work together to spontaneously generate internal climate variability that can persist for years to decades at a time. Examples of this type of variability include the El Niño–Southern Oscillation, the Pacific decadal oscillation, and the Atlantic Multidecadal Oscillation. These variations can affect global average surface temperature by redistributing heat between the deep ocean and the atmosphere and/or by altering the cloud/water vapor/sea ice distribution which can affect the total energy budget of the earth.

Ocean circulation

A schematic of modern thermohaline circulation. Tens of millions of years ago, continental-plate movement formed a land-free gap around Antarctica, allowing the formation of the ACC, which keeps warm waters away from Antarctica.
 
The oceanic aspects of climate variability can generate variability on centennial timescales due to the ocean having hundreds of times more mass than in the atmosphere, and thus very high thermal inertia. For example, alterations to ocean processes such as thermohaline circulation play a key role in redistributing heat in the world's oceans.

Ocean currents transport a lot of energy from the warm tropical regions to the colder polar regions. Changes occurring around the last ice age (in technical terms, the last glacial) show that the circulation is the North Atlantic can change suddenly and substantially, leading to global climate changes, even though the total amount of energy coming into the climate system didn't change much. These large changes may have come from so called Heinrich events where internal instability of ice sheets caused huge ice bergs to be released into the ocean. When the ice sheet melts, the resulting water is very low in salt and cold, driving changes in circulation. Another example of climate changes partially driven by internal variability are the regional changes driven by the Atlantic multidecadal oscillation.

Life

Life affects climate through its role in the carbon and water cycles and through such mechanisms as albedo, evapotranspiration, cloud formation, and weathering. Examples of how life may have affected past climate include:

External climate forcing

Greenhouse gases

Increase in atmospheric CO
2
levels

Whereas greenhouse gases released by the biosphere is often seen as a feedback or internal climate process, greenhouse gases emitted from volcanoes are typically classified as external by climatologists. Greenhouse gases, such as CO
2
, methane and nitrous oxide, heat the climate system by trapping infrared light. 

The scientific consensus on climate change is "that climate is changing and that these changes are in large part caused by human activities", and it "is largely irreversible". There has been multiple indications of how human activities affect global warming and continue to do so.
... there is a strong, credible body of evidence, based on multiple lines of research, documenting that climate is changing and that these changes are in large part caused by human activities. While much remains to be learned, the core phenomenon, scientific questions, and hypotheses have been examined thoroughly and have stood firm in the face of serious scientific debate and careful evaluation of alternative explanations.
— United States National Research Council, Advancing the Science of Climate Change
Human's main impact is by emitting CO2 from fossil fuel combustion, followed by aerosols (particulate matter in the atmosphere), and the CO2 released by cement manufacture. Other factors, including land use, ozone depletion, animal husbandry (ruminant animals such as cattle produce methane), and deforestation, are also play a role.

Volcanoes are also part of the extended carbon cycle. Over very long (geological) time periods, they release carbon dioxide from the Earth's crust and mantle, counteracting the uptake by sedimentary rocks and other geological carbon dioxide sinks. The US Geological Survey estimates are that volcanic emissions are at a much lower level than the effects of current human activities, which generate 100–300 times the amount of carbon dioxide emitted by volcanoes. The annual amount put out by human activities may be greater than the amount released by supereruptions, the most recent of which was the Toba eruption in Indonesia 74,000 years ago.

Orbital variations

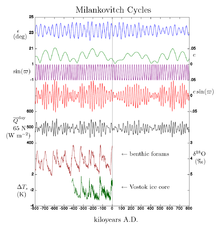
Milankovitch cycles from 800,000 years ago in the past to 800,000 years in the future.
 
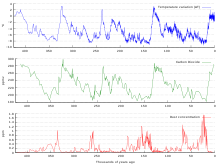
Variations in CO2, temperature and dust from the Vostok ice core over the last 450,000 years

Slight variations in Earth's motion lead to changes in the seasonal distribution of sunlight reaching the Earth's surface and how it is distributed across the globe. There is very little change to the area-averaged annually averaged sunshine; but there can be strong changes in the geographical and seasonal distribution. The three types of kinematic change are variations in Earth's eccentricity, changes in the tilt angle of Earth's axis of rotation, and precession of Earth's axis. Combined together, these produce Milankovitch cycles which affect climate and are notable for their correlation to glacial and interglacial periods, their correlation with the advance and retreat of the Sahara, and for their appearance in the stratigraphic record.

During the glacial cycles, there was a high correlation between CO
2
concentrations and temperatures. Early studies indicated that CO
2
concentrations lagged temperatures, but it has become clear that this isn't always the case. When seawater temperatures increase, the solubility of CO
2
decreases so that it is released from the ocean. The exchange of CO
2
between the air and the ocean can also be impacted by further aspects of climatic change. These and other self-reinforcing processes allow small changes in Earth's motion to have a possibly large effect on climate.

Solar output

Variations in solar activity during the last several centuries based on observations of sunspots and beryllium isotopes. The period of extraordinarily few sunspots in the late 17th century was the Maunder minimum.
 
The Sun is the predominant source of energy input to the Earth's climate system. Other sources include geothermal energy from the Earth's core, tidal energy from the Moon and heat from the decay of radioactive compounds. Both long term variations in solar intensity are known to affect global climate. Solar output varies on shorter time scales, including the 11-year solar cycle and longer-term modulations. Correlation between sunspots and climate and tenuous at best.

Three to four billion years ago, the Sun emitted only 75% as much power as it does today. If the atmospheric composition had been the same as today, liquid water should not have existed on the Earth's surface. However, there is evidence for the presence of water on the early Earth, in the Hadean and Archean eons, leading to what is known as the faint young Sun paradox. Hypothesized solutions to this paradox include a vastly different atmosphere, with much higher concentrations of greenhouse gases than currently exist. Over the following approximately 4 billion years, the energy output of the Sun increased. Over the next five billion years, the Sun's ultimate death as it becomes a red giant and then a white dwarf will have large effects on climate, with the red giant phase possibly ending any life on Earth that survives until that time.

Volcanism

In atmospheric temperature from 1979 to 2010, determined by MSU NASA satellites, effects appear from aerosols released by major volcanic eruptions (El Chichón and Pinatubo). El Niño is a separate event, from ocean variability.
 
The eruptions considered to be large enough to affect the Earth's climate on a scale of more than 1 year are the ones that inject over 100,000 tons of SO2 into the stratosphere. This is due to the optical properties of SO2 and sulfate aerosols, which strongly absorb or scatter solar radiation, creating a global layer of sulfuric acid haze. On average, such eruptions occur several times per century, and cause cooling (by partially blocking the transmission of solar radiation to the Earth's surface) for a period of several years. Although volcanoes are technically part of the lithosphere, which itself is part of the climate system, the IPCC explicitly defines volcanism as an external forcing agent.

Notable eruptions in the historical records are the eruption of Mount Pinatubo in 1991 which lowered global temperatures by about 0.5 °C (0.9 °F) for up to three years, and the Mount Tambora eruption in 1815 causing the Year Without a Summer.

At a larger scale – a few times every 50 million to 100 million years – the eruption of large igneous provinces brings large quantities of igneous rock from the mantle and lithosphere to the Earth's surface. Carbon dioxide in the rock is then released into the atmosphere. Small eruptions, with injections of less than 0.1 Mt of sulfur dioxide into the stratosphere, affect the atmosphere only subtly, as temperature changes are comparable with natural variability. However, because smaller eruptions occur at a much higher frequency, they too significantly affect Earth's atmosphere.

Plate tectonics

Over the course of millions of years, the motion of tectonic plates reconfigures global land and ocean areas and generates topography. This can affect both global and local patterns of climate and atmosphere-ocean circulation.

The position of the continents determines the geometry of the oceans and therefore influences patterns of ocean circulation. The locations of the seas are important in controlling the transfer of heat and moisture across the globe, and therefore, in determining global climate. A recent example of tectonic control on ocean circulation is the formation of the Isthmus of Panama about 5 million years ago, which shut off direct mixing between the Atlantic and Pacific Oceans. This strongly affected the ocean dynamics of what is now the Gulf Stream and may have led to Northern Hemisphere ice cover. During the Carboniferous period, about 300 to 360 million years ago, plate tectonics may have triggered large-scale storage of carbon and increased glaciation. Geologic evidence points to a "megamonsoonal" circulation pattern during the time of the supercontinent Pangaea, and climate modeling suggests that the existence of the supercontinent was conducive to the establishment of monsoons.

The size of continents is also important. Because of the stabilizing effect of the oceans on temperature, yearly temperature variations are generally lower in coastal areas than they are inland. A larger supercontinent will therefore have more area in which climate is strongly seasonal than will several smaller continents or islands.

Other mechanisms

It has been postulated that ionized particles known as cosmic rays could impact cloud cover and thereby the climate. As the sun shields the earth from these particles, changes in solar activity were hypothesized to influence climate indirectly as well. To test the hypothesis, CERN designed the CLOUD experiment, which showed the effect of cosmic rays is too weak to influence climate noticeably.

Evidence exists that the Chicxulub asteroid impact some 66 million years ago had severely affected the Earth's climate. Large quantities of sulfate aerosols were kicked up into the atmosphere, decreasing global temperatures by up to 26 °C and producing sub-freezing temperatures for a period of 3–16 years. The recovery time for this event took more than 30 years. The large-scale use of nuclear weapons has also been investigated for its impact on the climate. The hypothesis is that soot released by large-scale fires blocks a significant fraction of sunlight for as much as a year, leading to a sharp drop in temperatures for a few years. This possible event is described as nuclear winter.

Human's use of land impact how much sunlight the surface reflects and the concentration of dust. Cloud formation is not only influenced by how much water is in the air and the temperature, but also by the amount of aerosols in the air such as dust. Globally, more dust is available if there are many regions with dry soils, little vegetation and strong winds.

Evidence and measurement of climate changes

Evidence of past climate change and present climate change comes from a variety of sources. Paleoclimatology is the study of changes in climate taken on the scale of the entire history of Earth. It uses a variety of proxy methods from the Earth and life sciences to obtain data previously preserved within things such as rocks, sediments, ice sheets, tree rings, corals, shells, and microfossils. It then uses the records to determine the past states of the Earth's various climate regions and its atmospheric system. Direct measurements give a more complete overview of climate change.

Direct measurements

Climate changes that occurred after the widespread deployment of measuring devices, can be observed directly. Reasonably complete global records of surface temperature are available beginning from the mid-late 19th century. Further observations are done by satellite and derived indirectly from historical documents. Satellite cloud and precipitation data has been available since the 1970s. Historical climatology is the study of historical changes in climate and their effect on human history and development. The primary sources include written records such as sagas, chronicles, maps and local history literature as well as pictorial representations such as paintings, drawings and even rock art

Climate change in the recent past may be detected by corresponding changes in settlement and agricultural patterns. Archaeological evidence, oral history and historical documents can offer insights into past changes in the climate. Climate change effects have been linked to the rise and also the collapse of various civilizations.

Proxy measurements

Various archives of past climate are present in rocks, trees and fossils. From these archive, indirect measures of climate, so-called proxies, can be derived. Quantification of climatological variation of precipitation in prior centuries and epochs is less complete but approximated using proxies such as marine sediments, ice cores, cave stalagmites, and tree rings. Stress, too little precipitation or unsuitable temperatures, can alter the growth rate of trees, which allows scientists to infer climate trends by analyzing the growth rate of tree rings. This branch of science studying this called dendroclimatology. Glaciers leave behind moraines that contain a wealth of material—including organic matter, quartz, and potassium that may be dated—recording the periods in which a glacier advanced and retreated.

Analysis of ice in a core drilled from an ice sheet such as the Antarctic ice sheet, can be used to show a link between temperature and global sea level variations. The air trapped in bubbles in the ice can also reveal the CO2 variations of the atmosphere from the distant past, well before modern environmental influences. The study of these ice cores has been a significant indicator of the changes in CO2 over many millennia, and continues to provide valuable information about the differences between ancient and modern atmospheric conditions. The 18O/16O ratio in calcite and ice core samples used to deduce ocean temperature in the distant past is an example of a temperature proxy method, as are other climate metrics noted in subsequent categories.

The remnants of plants, and specifically pollen, are also used to study climatic change. Plant distributions varies under different climate conditions. Different groups of plants have pollen with distinctive shapes and surface textures, and since the outer surface of pollen is composed of a very resilient material, they resist decay. Changes in the type of pollen found in different layers of sediment indicate changes in plant communities. These changes are often a sign of a changing climate. As an example, pollen studies have been used to track changing vegetation patterns throughout the Quaternary glaciations and especially since the last glacial maximum. Remains of beetles are common in freshwater and land sediments. Different species of beetles tend to be found under different climatic conditions. Given the extensive lineage of beetles whose genetic makeup has not altered significantly over the millennia, knowledge of the present climatic range of the different species, and the age of the sediments in which remains are found, past climatic conditions may be inferred.

Consequences of climate change

All elements of the climate system portray changes as a consequence of climate change.

Changes in the cryosphere

Glaciers and ice sheets

Glaciers are considered among the most sensitive indicators of climate change. Their size is determined by a mass balance between snow input and melt output. As temperatures increase, glaciers retreat unless snow precipitation increases to make up for the additional melt. Glaciers grow and shrink due both to natural variability and external forcings. Variability in temperature, precipitation and hydrology can strongly determine the evolution of a glacier in a particular season. 

The most significant climate processes since the middle to late Pliocene (approximately 3 million years ago) are the glacial and interglacial cycles. The present interglacial period (the Holocene) has lasted about 11,700 years. Shaped by orbital variations, responses such as the rise and fall of continental ice sheets and significant sea-level changes helped create the climate. Other changes, including Heinrich events, Dansgaard–Oeschger events and the Younger Dryas, however, illustrate how glacial variations may also influence climate without the orbital forcing.

Sea level change

During the Last Glacial Maximum, some 25,000 years ago, sea levels were roughly 130 m lower than today. The deglaciation afterwards was characterized by rapid sea level change. The deglaciations at the end of The deglaciation that took place In the early Pliocene, global temperatures were 1–2˚C warmer than the present temperature, yet sea level was 15–25 meters higher than today.

Sea ice

Sea ice plays an important role in Earth's climate as it affects the total amount of sunlight that is reflected away from the Earth. In the past, the Earth's oceans have been almost entirely covered by sea ice on a number of occasions, when the Earth was in a so-called Snowball Earth state, and completely ice-free in periods of warm climate. When there is a lot of sea ice present globally, especially in the tropics and subtropics, the climate is more sensitive to forcings as the ice–albedo feedback is very strong.

Flora and fauna

Top: Arid ice age climateMiddle: Atlantic Period, warm and wetBottom: Potential vegetation in climate now if not for human effects like agriculture.

Vegetation

A change in the type, distribution and coverage of vegetation may occur given a change in the climate. Some changes in climate may result in increased precipitation and warmth, resulting in improved plant growth and the subsequent sequestration of airborne CO2. The effects are expected to affect the rate of many natural cycles like plant litter decomposition rates. A gradual increase in warmth in a region will lead to earlier flowering and fruiting times, driving a change in the timing of life cycles of dependent organisms. Conversely, cold will cause plant bio-cycles to lag.

Larger, faster or more radical changes, however, may result in vegetation stress, rapid plant loss and desertification in certain circumstances. An example of this occurred during the Carboniferous Rainforest Collapse (CRC), an extinction event 300 million years ago. At this time vast rainforests covered the equatorial region of Europe and America. Climate change devastated these tropical rainforests, abruptly fragmenting the habitat into isolated 'islands' and causing the extinction of many plant and animal species.

Fauna

One of the most important ways animals can deal with climatic change is migration to warmer or colder regions. On a longer timescale, evolution makes ecosystems including animals better adapted to a new climate. Rapid or large climate change can cause mass extinctions when creatures are stretched too far to be able to adapt.

Past and modern climate change

Examples of past change

Climatological temperatures substantially affect cloud cover and precipitation. At lower temperatures, air can hold less water vapour, which can lead to decreased precipitation. For instance, during the Last Glacial Maximum of 18,000 years ago, thermal-driven evaporation from the oceans onto continental landmasses was low, causing large areas of extreme desert, including polar deserts (cold but with low rates of cloud cover and precipitation). In contrast, the world's climate was cloudier and wetter than today near the start of the warm Atlantic Period of 8000 years ago. Notable climate events known to paleoclimatology are provided in this list of periods and events in climate history.

Paleo-Eocene Thermal maximum

The Paleocene–Eocene Thermal Maximum (PETM) was a time period with more than 5–8 °C global average temperature rise across the event. This climate event occurred at the time boundary of the Paleocene and Eocene geological epochs. During the event large amounts of methane was released, a potent greenhouse gas. The PETM represents a "case study" for modern climate change as in the greenhouse gases were released in a geologically relatively short amount of time. During the PETM, a mass extinction of organisms in the deep ocean took place.

Modern climate change and global warming

As a consequence of humans emitting greenhouse gases, global surface temperatures have started rising (global warming). Global warming is an aspect of modern climate change, a term that also includes the observed changes in precipitation, storm tracks and cloudiness. As a consequence, glaciers worldwide have been found to be shrinking significantly Data from NASA's Grace satellites show that the land ice sheets in both Antarctica (upper chart) and Greenland (lower) have been losing mass since 2002. Both ice sheets have seen an acceleration of ice mass loss since 2009. Global sea levels have been rising as a consequence of thermal expansion and ice melt. The decline in Arctic sea ice, both in extent and thickness, over the last several decades is further evidence for rapid climate change.

Climatology

From Wikipedia, the free encyclopedia
 
Climatology is the scientific study of the climate.
 
Climatology (from Greek κλίμα, klima, "place, zone"; and -λογία, -logia) or climate science is the scientific study of climate, scientifically defined as weather conditions averaged over a period of time. This modern field of study is regarded as a branch of the atmospheric sciences and a subfield of physical geography, which is one of the Earth sciences. Climatology now includes aspects of oceanography and biogeochemistry

The main methods employed by climatologists is the analysis of observations and modelling the physical laws that determine the climate. The main topics of research are the study of climate variability, mechanisms of climate changes and modern climate change. Basic knowledge of climate can be used within shorter term weather forecasting, for instance about climatic cycles such as the El Niño–Southern Oscillation (ENSO), the Madden–Julian oscillation (MJO), the North Atlantic oscillation (NAO), the Arctic oscillation (AO), the Pacific decadal oscillation (PDO), and the Interdecadal Pacific Oscillation (IPO). 

Climate models are used for a variety of purposes from study of the dynamics of the weather and climate system to projections of future climate. Weather is known as the condition of the atmosphere over a period of time, while climate has to do with the atmospheric condition over an extended to indefinite period of time.

History

The Greeks began the formal study of climate; in fact the word climate is derived from the Greek word klima, meaning "slope," referring to the slope or inclination of the Earth's axis. Arguably the most influential classic text on climate was On Airs, Water and Places written by Hippocrates around 400 BCE. This work commented on the effect of climate on human health and cultural differences between Asia and Europe. This idea that climate controls which countries excel depending on their climate, or climatic determinism, remained influential throughout history. Chinese scientist Shen Kuo (1031–1095) inferred that climates naturally shifted over an enormous span of time, after observing petrified bamboos found underground near Yanzhou (modern day Yan'an, Shaanxi province), a dry-climate area unsuitable for the growth of bamboo.

The invention of the thermometer and the barometer during the Scientific Revolution allowed for systematic recordkeeping, that began as early as 1640 in England. Early climate researchers include Edmund Halley, who published a map of the trade winds in 1686 after a voyage to the southern hemisphere. Benjamin Franklin (1706–1790) first mapped the course of the Gulf Stream for use in sending mail from the United States to Europe. Francis Galton (1822–1911) invented the term anticyclone. Helmut Landsberg (1906–1985) fostered the use of statistical analysis in climatology, which led to its evolution into a physical science.

In the early 20th century, climatology was mostly focused on the description of regional climates. This descriptive climatology was mainly an applied science, giving farmers and other interested people statistics about what the normal weather was and how big chances were of extreme events. To do this, climatologists had to define a climate normal, or an average of weather and weather extremes over a period of typically 30 years.

Around the middle of the 20th century, many assumptions in meteorology and climatology considered climate to be roughly constant. While scientists knew of past climate change such as the ice ages, the concept of climate as unchanging was useful in the development of a general theory of what determines climate. This started to change in the decades that followed, and while the history of climate change science started earlier, climate change only became one of the mean topics of study for climatologists in the seventies and onward.

Subfields

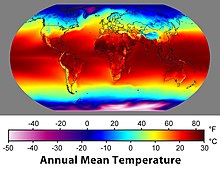
Map of the average temperature over 30 years. Data sets formed from the long-term average of historical weather parameters are sometimes called a "climatology".
 
Various subfields of climatology study different aspects of the climate. There are different categorizations of the fields in climatology. The American Meteorological Society for instance identifies descriptive climatology, scientific climatology and applied climatology as the three subcategories of climatology, a categorization based on the complexity and the purpose of the research. Applied climatologists apply their expertise to different industries such as manufacturing and agriculture.

Paleoclimatology seeks to reconstruct and understand past climates by examining records such as ice cores and tree rings (dendroclimatology). Paleotempestology uses these same records to help determine hurricane frequency over millennia. Historical climatology is the study of climate as related to human history and thus focuses only on the last few thousand years. 

Boundary-layer climatology is preoccupied with exchanges in water, energy and momentum near the surface. Further identified subfields are physical climatology, dynamic climatology, tornado climatology, regional climatology, bioclimatology, applied climatology, and synoptic climatology. The study of the hydrological cycle at long time scales (hydroclimatology) is further subdivided within the subfields of snow climatology and hail climatology.

Methods

The study of contemporary climates incorporates meteorological data accumulated over many years, such as records of rainfall, temperature and atmospheric composition. Knowledge of the atmosphere and its dynamics is also embodied in models, either statistical or mathematical, which help by integrating different observations and testing how they fit together. Modeling is used for understanding past, present and potential future climates.

Climate research is made difficult by the large scale, long time periods, and complex processes which govern climate. Climate is governed by physical laws which can be expressed as differential equations. These equations are coupled and nonlinear, so that approximate solutions are obtained by using numerical methods to create global climate models. Climate is sometimes modeled as a stochastic process but this is generally accepted as an approximation to processes that are otherwise too complicated to analyze.

Climate data

The collection of long record of climate variables is essential for the study of climate. Climatology deals with the aggregate data that meteorology has collected. As measuring technology changes over time, records of data cannot be compared directly. As cities are generally warmer than the surrounding areas, urbanization has made it necessary to constantly correct data for this urban heat island effect.

Models

Climate models use quantitative methods to simulate the interactions of the atmosphere, oceans, land surface, and ice. They are used for a variety of purposes from study of the dynamics of the weather and climate system to projections of future climate. All climate models balance, or very nearly balance, incoming energy as short wave (including visible) electromagnetic radiation to the earth with outgoing energy as long wave (infrared) electromagnetic radiation from the earth. Any unbalance results in a change in the average temperature of the earth. Most climate models include the radiative effects of greenhouse gases such as carbon dioxide. These models predict an upward trend in the surface temperatures, as well as a more rapid increase in temperature at higher latitudes.

Models can range from relatively simple to complex:
  • A simple radiant heat transfer model that treats the earth as a single point and averages outgoing energy
  • this can be expanded vertically (radiative-convective models), or horizontally
  • Coupled atmosphere–ocean–sea ice global climate models discretise and solve the full equations for mass and energy transfer and radiant exchange.
  • Earth system models further include the biosphere.

Topics of research

Topics that climatologists study fall roughly into three categories: climate variability, mechanisms of climate change and modern climate change.

Climatological processes

Various factors impact the average state of the atmosphere at a particular location. For instance, midlatitudes will have a pronounced seasonal cycle in temperature whereas tropical regions show little variation in temperature over the year. Another major control in climate is continentality: the distance to major water bodies such as oceans. Oceans act as a moderating factor, so that land close to it has typically has mild winters and moderate summers. The atmosphere interacts with other spheres of the climate system, with winds generating ocean currents that transport heat around the globe.

Climate classification

Classification is an important aspect of many sciences as a tool of simplifying complicated processes. Different climate classifications have been developed over the centuries, with the first ones in Ancient Greece. How climates are classified depends on what the application is. A wind energy producer will require different information (wind) in the classification than somebody interested in agriculture, for who precipitation and temperature are more important. The most widely used classification, the Köppen climate classification, was developed in the late nineteenth century and is based on vegatation. It uses monthly temperature and precipitation data.

Climate variability

El Niño impacts
 
There are different modes of variability: recurring patterns of temperature or other climate variables. They are quantified with different indices. Much in the way the Dow Jones Industrial Average, which is based on the stock prices of 30 companies, is used to represent the fluctuations in the stock market as a whole, climate indices are used to represent the essential elements of climate. Climate indices are generally devised with the twin objectives of simplicity and completeness, and each index typically represents the status and timing of the climate factor it represents. By their very nature, indices are simple, and combine many details into a generalized, overall description of the atmosphere or ocean which can be used to characterize the factors which impact the global climate system. 

El Niño–Southern Oscillation (ENSO) is a coupled ocean-atmosphere phenomenon in the Pacific Ocean responsible for most of the global variability in temperature, and has a cycle between two and seven years. The North Atlantic oscillation is a mode of variability that is mainly contained to the lower atmosphere, the troposphere. The layer of atmosphere above, the stratosphere is also capable of creating its own variability, most importantly in the Madden–Julian oscillation (MJO), which has a cycle of approximately 30-60 days. The interdecadal pacific oscillation can create changes in the pacific ocean and lower atmosphere on decadal time scales.

Climatic change

Climate change occurs when changes in Earth's climate system result in new weather patterns that remain in place for an extended period of time. This length of time can be as short as a few decades to as long as millions of years. The climate system receives nearly all of its energy from the sun. The climate system also gives off energy to outer space. The balance of incoming and outgoing energy, and the passage of the energy through the climate system, determines Earth's energy budget. When the incoming energy is greater than the outgoing energy, earth's energy budget is positive and the climate system is warming. If more energy goes out, the energy budget is negative and earth experiences cooling. Climate change also influences the average sea level.

Modern climate change is driven by the human emissions of greenhouse gas from the burning of fossil fuel driving up global mean surface temperatures. Rising temperatures are only one aspect of modern climate change though, with includes observed changes in precipitation, storm tracks and cloudiness. Warmer temperatures are driving further changes in the climate system, such as the widespread melt of glaciers, sea level rise and shifts in flora and fauna.

Differences with meteorology

In contrast to meteorology, which focuses on short term weather systems lasting up to a few weeks, climatology studies the frequency and trends of those systems. It studies the periodicity of weather events over years to millennia, as well as changes in long-term average weather patterns, in relation to atmospheric conditions. Climatologists study both the nature of climates – local, regional or global – and the natural or human-induced factors that cause climates to change. Climatology considers the past and can help predict future climate change.

Phenomena of climatological interest include the atmospheric boundary layer, circulation patterns, heat transfer (radiative, convective and latent), interactions between the atmosphere and the oceans and land surface (particularly vegetation, land use and topography), and the chemical and physical composition of the atmosphere.

Use in weather forecasting

A more complicated way of making a forecast, the analog technique requires remembering a previous weather event which is expected to be mimicked by an upcoming event. What makes it a difficult technique to use is that there is rarely a perfect analog for an event in the future. Some call this type of forecasting pattern recognition, which remains a useful method of observing rainfall over data voids such as oceans with knowledge of how satellite imagery relates to precipitation rates over land, as well as the forecasting of precipitation amounts and distribution in the future. A variation on this theme is used in Medium Range forecasting, which is known as teleconnections, when you use systems in other locations to help pin down the location of another system within the surrounding regime. One method of using teleconnections are by using climate indices such as ENSO-related phenomena.

Personality theories of addiction

From Wikipedia, the free encyclopedia https://en.wikipedia.org/wiki/Personality_theories_of_addiction ...