Search This Blog

Tuesday, May 1, 2018

Electricity generation

From Wikipedia, the free encyclopedia
 
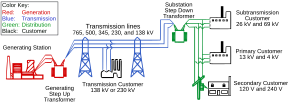
Diagram of an electric power system, generation system in red

Electricity generation is the process of generating electric power from sources of primary energy. For electric utilities in the electric power industry, it is the first stage in the delivery of electricity to end users, the other stages being transmission, distribution, energy storage and recovery, using pumped-storage methods.

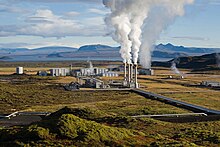
A characteristic of electricity is that it is not a primary energy freely present in nature in remarkable amounts and it must be produced. Production is carried out in power plants. Electricity is most often generated at a power station by electromechanical generators, primarily driven by heat engines fueled by combustion or nuclear fission but also by other means such as the kinetic energy of flowing water and wind. Other energy sources include solar photovoltaics and geothermal power.

History

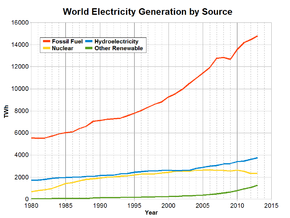
Electricity production in the World, 1980-2013

The fundamental principles of electricity generation were discovered in the 1820s and early 1830s by British scientist Michael Faraday. His method, still used today, is for electricity to be generated by the movement of a loop of wire, or disc of copper between the poles of a magnet. Central power stations became economically practical with the development of alternating current (AC) power transmission, using power transformers to transmit power at high voltage and with low loss.

In 1870, commercial electricity production started with the coupling of the dynamo to the hydraulic turbine. In 1870, the mechanical production of electric power began the Second Industrial Revolution and created inventions using the energy, whose major contributors were Thomas Alva Edison and Nikola Tesla. Previously the only way to produce electricity was by chemical reactions or using battery cells, and the only practical use of electricity was for the telegraph.

Electricity generation at central power stations started in 1882, when a steam engine driving a dynamo at Pearl Street Station produced a DC current that powered public lighting on Pearl Street, New York. The new technology was quickly adopted by many cities around the world, which adopted their gas fueled street lights to electric power, and soon after electric lights would be used in public buildings, in businesses, and to power public transport, such as trams and trains.

The first power plants used water power or coal;[1] and today a variety of energy sources are used, such as coal, nuclear, natural gas, hydroelectric, wind generators, and oil, as well as solar energy, tidal power, and geothermal sources. The use of power-lines and power-poles have been significantly important in the distribution of electricity.

Methods of generating electricity

U.S. 2014 Electricity Generation By Type.[2]
Sources of electricity in France in 2006;[3] nuclear power was the main source.

Several fundamental methods exist to convert other forms of energy into electrical energy. The triboelectric effect, piezoelectric effect, and even direct capture of the energy of nuclear decay Betavoltaics are used in niche applications, as is direct conversion of heat to electric power in the thermoelectric effect. Utility-scale generation is done by rotating electric generators, or by photovoltaic systems. A very small proportion of electric power distributed by utilities is provided by batteries.

Generators

Electric generators transform kinetic energy into electricity. This is the most used form for generating electricity and is based on Faraday's law. It can be seen experimentally by rotating a magnet within closed loops of a conducting material (e.g. copper wire). Almost all commercial electrical generation is done using electromagnetic induction, in which mechanical energy forces a generator to rotate.

Electrochemistry

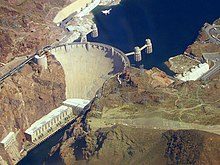
Large dams such as Hoover Dam can provide large amounts of hydroelectric power; it has 2.07 GW capability.

Electrochemistry is the direct transformation of chemical energy into electricity, as in a battery. Electrochemical electricity generation is important in portable and mobile applications. Currently, most electrochemical power comes from batteries.[4] Primary cells, such as the common zinc–carbon batteries, act as power sources directly, but secondary cells (i.e. rechargeable batteries) are used for storage systems rather than primary generation systems. Open electrochemical systems, known as fuel cells, can be used to extract power either from natural fuels or from synthesized fuels. Osmotic power is a possibility at places where salt and fresh water merges.

Photovoltaic effect

The photovoltaic effect is the transformation of light into electrical energy, as in solar cells. Photovoltaic panels convert sunlight directly to electricity. Although sunlight is free and abundant, solar power electricity is still usually more expensive to produce than large-scale mechanically generated power due to the cost of the panels. Low-efficiency silicon solar cells have been decreasing in cost and multijunction cells with close to 30% conversion efficiency are now commercially available. Over 40% efficiency has been demonstrated in experimental systems.[5] Until recently, photovoltaics were most commonly used in remote sites where there is no access to a commercial power grid, or as a supplemental electricity source for individual homes and businesses. Recent advances in manufacturing efficiency and photovoltaic technology, combined with subsidies driven by environmental concerns, have dramatically accelerated the deployment of solar panels. Installed capacity is growing by 40% per year led by increases in Germany, Japan, and the United States.

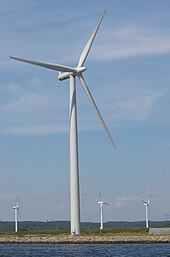
Wind turbines usually provide electrical generation in conjunction with other methods of producing power.

Economics of generation and production of electricity

The selection of electricity production modes and their economic viability varies in accordance with demand and region. The economics vary considerably around the world, resulting in widespread selling prices, e.g. the price in Venezuela is 3 cents per kWh while in Denmark it is 40 cents per kWh. Hydroelectric plants, nuclear power plants, thermal power plants and renewable sources have their own pros and cons, and selection is based upon the local power requirement and the fluctuations in demand. All power grids have varying loads on them but the daily minimum is the base load, supplied by plants which run continuously. Nuclear, coal, oil and gas plants can supply base load.
Thermal energy is economical in areas of high industrial density, as the high demand cannot be met by renewable sources. The effect of localized pollution is also minimized as industries are usually located away from residential areas. These plants can also withstand variation in load and consumption by adding more units or temporarily decreasing the production of some units. Nuclear power plants can produce a huge amount of power from a single unit. However, recent disasters in Japan have raised concerns over the safety of nuclear power, and the capital cost of nuclear plants is very high. Hydroelectric power plants are located in areas where the potential energy from falling water can be harnessed for moving turbines and the generation of power. It is not an economically viable source of production where the load varies too much during the annual production cycle and the ability to store the flow of water is limited.

Due to advancements in technology, and with mass production, renewable sources other than hydroelectricity (solar power, wind energy, tidal power, etc.) experienced decreases in cost of production, and the energy is now in many cases cost-comparative with fossil fuels. Many governments around the world provide subsidies to offset the higher cost of any new power production, and to make the installation of renewable energy systems economically feasible. However, their use is frequently limited by their intermittent nature. If natural gas prices are below $3 per million British thermal units, generating electricity from natural gas is cheaper than generating power by burning coal.[6]

Generating equipment

Turbines

Almost all commercial electrical power on Earth is generated with a turbine, driven by wind, water, steam or burning gas. The turbine drives a generator, thus transforming its mechanical energy into electrical energy by electromagnetic induction. There are many different methods of developing mechanical energy, including heat engines, hydro, wind and tidal power. Most electric generation is driven by heat engines. The combustion of fossil fuels supplies most of the energy to these engines, with a significant fraction from nuclear fission and some from renewable sources. The modern steam turbine (invented by Sir Charles Parsons in 1884) currently generates about 80% of the electric power in the world using a variety of heat sources. Turbine types include:
  • Steam
Although turbines are most common in commercial power generation, smaller generators can be powered by gasoline or diesel engines. These may used for back up generation or isolated villages.

Generators

A large generator with the rotor removed

Electric generators were known in simple forms from the discovery of the magnetic induction of electric current in the 1830s. In general, some form of prime mover such as an engine or the turbines described above, drives a rotating magnetic field past stationary coils of wire thereby turning mechanical energy into electricity. A very large 2000 MW(2,682,000 horsepower) unit designed by Siemens was built for unit 3 at the Olkiluoto Nuclear Power Plant.[8] The only commercial scale electricity production that does not employ a generator is solar PV.

Production

The production of electricity in 2013 was 23,322TWh. Sources of electricity were coal and peat 41%, natural gas 22%, hydroelectric 16%, nuclear power 11%, oil 4%, biomass and waste 2% and other sources 4%. Other sources include wind, geothermal, solar photovoltaic, and solar thermal.[9]

Source of Electricity (World total year 2008)
- Coal Oil Natural
Gas
Nuclear Renewables other Total
Average electric power (TWh/year) 8,263 1,111 4,301 2,731 3,288 568 20,261
Average electric power (GW) 942.6 126.7 490.7 311.6 375.1 64.8 2311.4
Proportion 41% 5% 21% 13% 16% 3% 100%
data source IEA/OECD
Energy Flow of Power Plant

Total energy consumed at all power plants for the generation of electricity was 4,398,768 ktoe (kilo ton of oil equivalent) which was 36% of the total for primary energy sources (TPES) of 2008.
Electricity output (gross) was 1,735,579 ktoe (20,185 TWh), efficiency was 39%, and the balance of 61% was generated heat. A small part (145,141 ktoe, which was 3% of the input total) of the heat was utilized at co-generation heat and power plants. The in-house consumption of electricity and power transmission losses were 289,681 ktoe. The amount supplied to the final consumer was 1,445,285 ktoe (16,430 TWh) which was 33% of the total energy consumed at power plants and heat and power co-generation (CHP) plants.[10]

Historical results of production of electricity

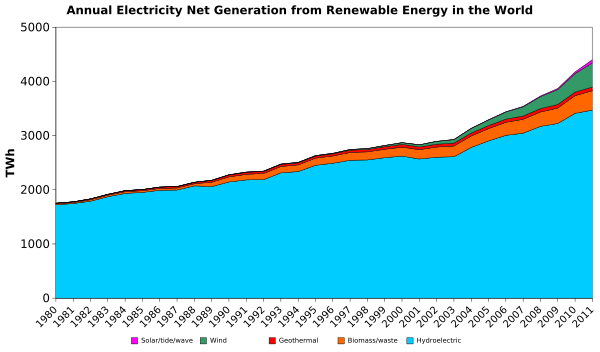
Annual electricity net generation in the world.svg Annual electricity net generation from renewable energy in the world.svg

Production by country

The United States has long been the largest producer and consumer of electricity, with a global share in 2005 of at least 25%, followed by China, Japan, Russia, and India. As of Jan-2010, total electricity generation for the 2 largest generators was as follows: USA: 3992 billion kWh (3992 TWh) and China: 3715 billion kWh (3715 TWh).

List of countries with source of electricity 2008

Data source of values (electric power generated) is IEA/OECD.[11] Listed countries are top 20 by population or top 20 by GDP (PPP) and Saudi Arabia based on CIA World Factbook 2009.[12]

Composition of Electricity by Resource (TWh per year 2008)
Country's electricity sector Fossil Fuel Nuclear rank Renewable Bio
other*
total rank
Coal Oil Gas sub
total
rank Hydro Geo
Thermal
Solar
PV*
Solar
Thermal
Wind Tide sub
total
rank
World total 8,263 1,111 4,301 13,675 - 2,731 - 3,288 65 12 0.9 219 0.5 3,584 - 271 20,261 -
Proportion 41% 5.5% 21% 67% - 13% - 16% 0.3% 0.06% 0.004% 1.1% 0.003% 18% - 1.3% 100% -
China China 2,733 23 31 2,788 2 68 8 585 - 0.2 - 13 - 598 1 2.4 3,457 2
India India 569 34 82 685 5 15 12 114 - 0.02 - 14 - 128.02 6 2.0 830 5
United States USA 2,133 58 1011 3,101 1 838 1 282 17 1.6 0.88 56 - 357 4 73 4,369 1
Indonesia Indonesia 61 43 25 130 19 - - 12 8.3 - - - - 20 17 - 149 20
Brazil Brazil 13 18 29 59 23 14 13 370 - - - 0.6 - 370 3 20 463 9
Pakistan Pakistan 0.1 32 30 62 22 1.6 16 28 - - - - - 28 14 - 92 24
Bangladesh Bangladesh 0.6 1.7 31 33 27 - - 1.5 - - - - - 1.5 29 - 35 27
Nigeria Nigeria - 3.1 12 15 28 - - 5.7 - - - - - 5.7 25 - 21 28
Russia Russia 197 16 495 708 4 163 4 167 0.5 - - 0.01 - 167 5 2.5 1,040 4
Japan Japan 288 139 283 711 3 258 3 83 2.8 2.3 - 2.6 - 91 7 22 1,082 3
Mexico Mexico 21 49 131 202 13 9.8 14 39 7.1 0.01 - 0.3 - 47 12 0.8 259 14
Philippines Philippines 16 4.9 20 40 26 - - 9.8 11 0.001 - 0.1 - 21 16 - 61 26
Vietnam Vietnam 15 1.6 30 47 25 - - 26 - - - - - 26 15 - 73 25
Ethiopia Ethiopia - 0.5 - 0.5 29 - - 3.3 0.01 - - - - 3.3 28 - 3.8 30
Egypt Egypt - 26 90 115 20 - - 15 - - - 0.9 - 16 20 - 131 22
Germany Germany 291 9.2 88 388 6 148 6 27 0.02 4.4 - 41 - 72 9 29 637 7
Turkey Turkey 58 7.5 99 164 16 - - 33 0.16 - - 0.85 - 34 13 0.22 198 19
Democratic Republic of the Congo DR Congo - 0.02 0.03 0.05 30 - - 7.5 - - - - - 7.5 22 - 7.5 29
Iran Iran 0.4 36 173 209 11 - - 5.0 - - - 0.20 - 5.2 26 - 215 17
Thailand Thailand 32 1.7 102 135 18 - - 7.1 0.002 0.003 - - - 7.1 23 4.8 147 21
France France 27 5.8 22 55 24 439 2 68 - 0.04 - 5.7 0.51 75 8 5.9 575 8
United Kingdom UK 127 6.1 177 310 7 52 10 9.3 - 0.02 - 7.1 - 16 18 11 389 11
Italy Italy 49 31 173 253 9 - - 47 5.5 0.2 - 4.9 - 58 11 8.6 319 12
South Korea South Korea 192 15 81 288 8 151 5 5.6 - 0.3 - 0.4 - 6.3 24 0.7 446 10
Spain Spain 50 18 122 190 14 59 9 26 - 2.6 0.02 32 - 61 10 4.3 314 13
Canada Canada 112 9.8 41 162 17 94 7 383 - 0.03 - 3.8 0.03 386 2 8.5 651 6
Saudi Arabia Saudi Arabia - 116 88 204 12 - - - - - - - - - - - 204 18
Taiwan Taiwan 125 14 46 186 15 41 11 7.8 - 0.004 - 0.6 - 8.4 21 3.5 238 16
Australia Australia 198 2.8 39 239 10 - - 12 - 0.2 0.004 3.9 - 16 19 2.2 257 15
Netherlands Netherlands 27 2.1 63 92 21 4.2 15 0.1 - 0.04 - 4.3 - 4.4 27 6.8 108 23
Country Coal Oil Gas sub
total
rank Nuclear rank Hydro Geo
Thermal
Solar
PV
Solar
Thermal
Wind Tide sub
total
rank Bio
other
Total rank
Solar PV* is Photovoltaics Bio other* = 198TWh (Biomass) + 69TWh (Waste) + 4TWh (other)

Environmental concerns

Variations between countries generating electrical power affect concerns about the environment. In France only 10% of electricity is generated from fossil fuels, the US is higher at 70% and China is at 80%.[11] The cleanliness of electricity depends on its source. Most scientists agree that emissions of pollutants and greenhouse gases from fossil fuel-based electricity generation account for a significant portion of world greenhouse gas emissions; in the United States, electricity generation accounts for nearly 40% of emissions, the largest of any source. Transportation emissions are close behind, contributing about one-third of U.S. production of carbon dioxide.[13] In the United States, fossil fuel combustion for electric power generation is responsible for 65% of all emissions of sulfur dioxide, the main component of acid rain.[14] Electricity generation is the fourth highest combined source of NOx, carbon monoxide, and particulate matter in the US.[15] In July 2011, the UK parliament tabled a motion that "levels of (carbon) emissions from nuclear power were approximately three times lower per kilowatt hour than those of solar, four times lower than clean coal and 36 times lower than conventional coal".[16]

Lifecycle greenhouse gas emissions by electricity source.[17]
Technology Description 50th percentile
(g CO2/kWhe)
Hydroelectric reservoir 4
Wind onshore 12
Nuclear various generation II reactor types 16
Biomass various 18
Solar thermal parabolic trough 22
Geothermal hot dry rock 45
Solar PV Polycrystalline silicon 46
Natural gas various combined cycle turbines without scrubbing 469
Coal various generator types without scrubbing 1001

Power station

From Wikipedia, the free encyclopedia

Hydroelectric power station at Gabčíkovo Dam, Slovakia
 
Hydroelectric power station at Glen Canyon Dam, Page, Arizona

A power station, also referred to as a power plant or powerhouse and sometimes generating station or generating plant, is an industrial facility for the generation of electric power. Most power stations contain one or more generators, a rotating machine that converts mechanical power into electrical power. The relative motion between a magnetic field and a conductor creates an electrical current. The energy source harnessed to turn the generator varies widely. Most power stations in the world burn fossil fuels such as coal, oil, and natural gas to generate electricity. Others use nuclear power, but there is an increasing use of cleaner renewable sources such as solar, wind, wave and hydroelectric.

History

In 1870 a hydroelectric power station was designed and built by Lord Armstrong at Cragside, England. It used water from lakes on his estate to power Siemens dynamos. The electricity supplied power to lights, heating, produced hot water, ran an elevator as well as labor-saving devices and farm buildings.[1]

In the early 1870s Belgian inventor Zénobe Gramme invented a generator powerful enough to produce power on a commercial scale for industry.[2]

In the autumn of 1882, a central station providing public power was built in Godalming, England. It was proposed after the town failed to reach an agreement on the rate charged by the gas company, so the town council decided to use electricity. It used hydroelectric power for street lighting and household lighting. The system was not a commercial success and the town reverted to gas.[3]

In 1882 the world's first coal-fired public power station, the Edison Electric Light Station, was built in London, a project of Thomas Edison organized by Edward Johnson. A Babcock & Wilcox boiler powered a 125-horsepower steam engine that drove a 27-ton generator. This supplied electricity to premises in the area that could be reached through the culverts of the viaduct without digging up the road, which was the monopoly of the gas companies. The customers included the City Temple and the Old Bailey. Another important customer was the Telegraph Office of the General Post Office, but this could not be reached though the culverts. Johnson arranged for the supply cable to be run overhead, via Holborn Tavern and Newgate.[4]

In September 1882 in New York, the Pearl Street Station was established by Edison to provide electric lighting in the lower Manhattan Island area. The station ran until destroyed by fire in 1890. The station used reciprocating steam engines to turn direct-current generators. Because of the DC distribution, the service area was small, limited by voltage drop in the feeders. The War of Currents eventually resolved in favor of AC distribution and utilization, although some DC systems persisted to the end of the 20th century. DC systems with a service radius of a mile (kilometer) or so were necessarily smaller, less efficient of fuel consumption, and more labor-intensive to operate than much larger central AC generating stations.

AC systems used a wide range of frequencies depending on the type of load; lighting load using higher frequencies, and traction systems and heavy motor load systems preferring lower frequencies. The economics of central station generation improved greatly when unified light and power systems, operating at a common frequency, were developed. The same generating plant that fed large industrial loads during the day, could feed commuter railway systems during rush hour and then serve lighting load in the evening, thus improving the system load factor and reducing the cost of electrical energy overall. Many exceptions existed, generating stations were dedicated to power or light by the choice of frequency, and rotating frequency changers and rotating converters were particularly common to feed electric railway systems from the general lighting and power network.

Throughout the first few decades of the 20th century central stations became larger, using higher steam pressures to provide greater efficiency, and relying on interconnections of multiple generating stations to improve reliability and cost. High-voltage AC transmission allowed hydroelectric power to be conveniently moved from distant waterfalls to city markets. The advent of the steam turbine in central station service, around 1906, allowed great expansion of generating capacity. Generators were no longer limited by the power transmission of belts or the relatively slow speed of reciprocating engines, and could grow to enormous sizes. For example, Sebastian Ziani de Ferranti planned what would have been the largest reciprocating steam engine ever built for a proposed new central station, but scrapped the plans when turbines became available in the necessary size. Building power systems out of central stations required combinations of engineering skill and financial acumen in equal measure. Pioneers of central station generation include George Westinghouse and Samuel Insull in the United States, Ferranti and Charles Hesterman Merz in UK, and many others.

Thermal power stations

Rotor of a modern steam turbine, used in a power station

In thermal power stations, mechanical power is produced by a heat engine that transforms thermal energy, often from combustion of a fuel, into rotational energy. Most thermal power stations produce steam, so they are sometimes called steam power stations. Not all thermal energy can be transformed into mechanical power, according to the second law of thermodynamics; therefore, there is always heat lost to the environment. If this loss is employed as useful heat, for industrial processes or district heating, the power plant is referred to as a cogeneration power plant or CHP (combined heat-and-power) plant. In countries where district heating is common, there are dedicated heat plants called heat-only boiler stations. An important class of power stations in the Middle East uses by-product heat for the desalination of water.

The efficiency of a thermal power cycle is limited by the maximum working fluid temperature produced. The efficiency is not directly a function of the fuel used. For the same steam conditions, coal-, nuclear- and gas power plants all have the same theoretical efficiency. Overall, if a system is on constantly (base load) it will be more efficient than one that is used intermittently (peak load). Steam turbines generally operate at higher efficiency when operated at full capacity.

Besides use of reject heat for process or district heating, one way to improve overall efficiency of a power plant is to combine two different thermodynamic cycles in a combined cycle plant. Most commonly, exhaust gases from a gas turbine are used to generate steam for a boiler and a steam turbine. The combination of a "top" cycle and a "bottom" cycle produces higher overall efficiency than either cycle can attain alone.

Classification

Modular block overview of a power station. Dashed lines show special additions like combined cycle and cogeneration or optional storage.
 
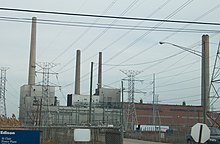
St. Clair Power Plant, a large coal-fired generating station in Michigan, United States
 

By heat source

By prime mover

  • Steam turbine plants use the dynamic pressure generated by expanding steam to turn the blades of a turbine. Almost all large non-hydro plants use this system. About 90 percent of all electric power produced in the world is through use of steam turbines.[6]
  • Gas turbine plants use the dynamic pressure from flowing gases (air and combustion products) to directly operate the turbine. Natural-gas fuelled (and oil fueled) combustion turbine plants can start rapidly and so are used to supply "peak" energy during periods of high demand, though at higher cost than base-loaded plants. These may be comparatively small units, and sometimes completely unmanned, being remotely operated. This type was pioneered by the UK, Princetown[7] being the world's first, commissioned in 1959.
  • Combined cycle plants have both a gas turbine fired by natural gas, and a steam boiler and steam turbine which use the hot exhaust gas from the gas turbine to produce electricity. This greatly increases the overall efficiency of the plant, and many new baseload power plants are combined cycle plants fired by natural gas.
  • Internal combustion reciprocating engines are used to provide power for isolated communities and are frequently used for small cogeneration plants. Hospitals, office buildings, industrial plants, and other critical facilities also use them to provide backup power in case of a power outage. These are usually fuelled by diesel oil, heavy oil, natural gas, and landfill gas.
  • Microturbines, Stirling engine and internal combustion reciprocating engines are low-cost solutions for using opportunity fuels, such as landfill gas, digester gas from water treatment plants and waste gas from oil production.

By duty

Power plants that can be dispatched (scheduled) to provide energy to a system include:
  • Base load power plants run nearly continually to provide that component of system load that doesn't vary during a day or week. Baseload plants can be highly optimized for low fuel cost, but may not start or stop quickly during changes in system load. Examples of base-load plants would include large modern coal-fired and nuclear generating stations, or hydro plants with a predictable supply of water.
  • Peaking power plants meet the daily peak load, which may only be for one or two hours each day. While their incremental operating cost is always higher than base load plants, they are required to ensure security of the system during load peaks. Peaking plants include simple cycle gas turbines and sometimes reciprocating internal combustion engines, which can be started up rapidly when system peaks are predicted. Hydroelectric plants may also be designed for peaking use.
  • Load following power plants can economically follow the variations in the daily and weekly load, at lower cost than peaking plants and with more flexibility than baseload plants.
Non-dispatchable plants include such sources as wind and solar energy; while their long-term contribution to system energy supply is predictable, on a short-term (daily or hourly) base their energy must be used as available since generation cannot be deferred. Contractual arrangements ("take or pay") with independent power producers or system interconnections to other networks may be effectively non-dispatchable.

Cooling towers

"Camouflaged" natural draft wet cooling tower
 
All thermal power plants produce waste heat energy as a byproduct of the useful electrical energy produced. The amount of waste heat energy equals or exceeds the amount of energy converted into useful electricity. Gas-fired power plants can achieve as much as 65 percent conversion efficiency, while coal and oil plants achieve around 30 to 49 percent. The waste heat produces a temperature rise in the atmosphere, which is small compared to that produced by greenhouse-gas emissions from the same power plant. Natural draft wet cooling towers at many nuclear power plants and large fossil fuel-fired power plants use large hyperboloid chimney-like structures (as seen in the image at the right) that release the waste heat to the ambient atmosphere by the evaporation of water.

However, the mechanical induced-draft or forced-draft wet cooling towers in many large thermal power plants, nuclear power plants, fossil-fired power plants, petroleum refineries, petrochemical plants, geothermal, biomass and waste-to-energy plants use fans to provide air movement upward through downcoming water, and are not hyperboloid chimney-like structures. The induced or forced-draft cooling towers are typically rectangular, box-like structures filled with a material that enhances the mixing of the upflowing air and the downflowing water.[8][9]

In areas with restricted water use, a dry cooling tower or directly air-cooled radiators may be necessary, since the cost or environmental consequences of obtaining make-up water for evaporative cooling would be prohibitive. These coolers have lower efficiency and higher energy consumption to drive fans, compared to a typical wet, evaporative cooling tower.

Once-through cooling systems

Electric companies often prefer to use cooling water from the ocean, a lake, or a river, or a cooling pond, instead of a cooling tower. This single pass or once-through cooling system can save the cost of a cooling tower and may have lower energy costs for pumping cooling water through the plant's heat exchangers. However, the waste heat can cause thermal pollution as the water is discharged. Power plants using natural bodies of water for cooling are designed with mechanisms such as fish screens, to limit intake of organisms into the cooling machinery. These screens are only partially effective and as a result billions of fish and other aquatic organisms are killed by power plants each year.[10][11] For example, the cooling system at the Indian Point Energy Center in New York kills over a billion fish eggs and larvae annually.[12]

A further environmental impact is that aquatic organisms which adapt to the warmer discharge water may be injured if the plant shuts down in cold weather.

Water consumption by power stations is a developing issue.[13]

In recent years, recycled wastewater, or grey water, has been used in cooling towers. The Calpine Riverside and the Calpine Fox power stations in Wisconsin as well as the Calpine Mankato power station in Minnesota are among these facilities.

Power from renewable energy

Power stations can also generate electrical energy from renewable energy sources.

Hydroelectric power station


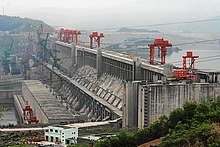
In a hydroelectric power station water flows through turbines using hydropower to generate hydroelectricity. Power is captured from the gravitational force of water falling through penstocks to water turbines connected to generators. The amount of power available is a combination of height and flow. A wide range of Dams may be built to raise the water level, and create a lake for storing water. Hydropower is produced in 150 countries, with the Asia-Pacific region generating 32 percent of global hydropower in 2010. China is the largest hydroelectricity producer, with 721 terawatt-hours of production in 2010, representing around 17 percent of domestic electricity use.

Solar

Nellis Solar Power Plant in Nevada, United States

Solar energy can be turned into electricity either directly in solar cells, or in a concentrating solar power plant by focusing the light to run a heat engine.

A solar photovoltaic power plant converts sunlight into direct current electricity using the photoelectric effect. Inverters change the direct current into alternating current for connection to the electrical grid. This type of plant does not use rotating machines for energy conversion.

Solar thermal power plants are another type of solar power plant. They use either parabolic troughs or heliostats to direct sunlight onto a pipe containing a heat transfer fluid, such as oil. The heated oil is then used to boil water into steam, which turns a turbine that drives an electrical generator. The central tower type of solar thermal power plant uses hundreds or thousands of mirrors, depending on size, to direct sunlight onto a receiver on top of a tower. Again, the heat is used to produce steam to turn turbines that drive electrical generators.

Wind

Wind turbines in Texas, United States

Wind turbines can be used to generate electricity in areas with strong, steady winds, sometimes offshore. Many different designs have been used in the past, but almost all modern turbines being produced today use a three-bladed, upwind design. Grid-connected wind turbines now being built are much larger than the units installed during the 1970s. They thus produce power more cheaply and reliably than earlier models. With larger turbines (on the order of one megawatt), the blades move more slowly than older, smaller, units, which makes them less visually distracting and safer for birds.

Marine

Marine energy or marine power (also sometimes referred to as ocean energy or ocean power) refers to the energy carried by ocean waves, tides, salinity, and ocean temperature differences. The movement of water in the world’s oceans creates a vast store of kinetic energy, or energy in motion. This energy can be harnessed to generate electricity to power homes, transport and industries.

The term marine energy encompasses both wave power — power from surface waves, and tidal power — obtained from the kinetic energy of large bodies of moving water. Offshore wind power is not a form of marine energy, as wind power is derived from the wind, even if the wind turbines are placed over water.

The oceans have a tremendous amount of energy and are close to many if not most concentrated populations. Ocean energy has the potential of providing a substantial amount of new renewable energy around the world.[14]

Osmosis

Osmotic Power Prototype at Tofte (Hurum), Norway

Salinity gradient energy is called pressure-retarded osmosis. In this method, seawater is pumped into a pressure chamber that is at a pressure lower than the difference between the pressures of saline water and fresh water. Freshwater is also pumped into the pressure chamber through a membrane, which increases both the volume and pressure of the chamber. As the pressure differences are compensated, a turbine is spun creating energy. This method is being specifically studied by the Norwegian utility Statkraft, which has calculated that up to 25 TWh/yr would be available from this process in Norway. Statkraft has built the world's first prototype osmotic power plant on the Oslo fiord which was opened on November 24, 2009.

Biomass

Metz biomass power station

Biomass energy can be produced from combustion of waste green material to heat water into steam and drive a steam turbine. Bioenergy can also be processed through a range of temperatures and pressures in gasification, pyrolysis or torrefaction reactions. Depending on the desired end product, these reactions create more energy-dense products (syngas, wood pellets, biocoal) that can then be fed into an accompanying engine to produce electricity at a much lower emission rate when compared with open burning.

Storage power stations

It is possible to store energy and produce the electricity at a later time like in Pumped-storage hydroelectricity, Thermal energy storage, Flywheel energy storage, Battery storage power station and so on.

Pumped storage

The worlds largest form of storage for excess electricity, pumped-storage is a reversible hydroelectric plant. They are a net consumer of energy but provide storage for any source of electricity, effectively smoothing peaks and troughs in electricity supply and demand. Pumped storage plants typically use "spare" electricity during off peak periods to pump water from a lower reservoir to an upper reservoir. Because the pumping takes place "off peak", electricity is less valuable than at peak times. This less valuable "spare" electricity comes from uncontrolled wind power and base load power plants such as coal, nuclear and geothermal, which still produce power at night even though demand is very low. During daytime peak demand, when electricity prices are high, the storage is used for peaking power, where water in the upper reservoir is allowed to flow back to a lower reservoir through a turbine and generator. Unlike coal power stations, which can take more than 12 hours to start up from cold, a hydroelectric generator can be brought into service in a few minutes, ideal to meet a peak load demand. Two substantial pumped storage schemes are in South Africa, Palmiet Pumped Storage Scheme and another in the Drakensberg, Ingula Pumped Storage Scheme.

Typical power output

The power generated by a power station is measured in multiples of the watt, typically megawatts (106 watts) or gigawatts (109 watts). Power stations vary greatly in capacity depending on the type of power plant and on historical, geographical and economic factors. The following examples offer a sense of the scale.

Many of the largest operational onshore wind farms are located in the USA. As of 2011, the Roscoe Wind Farm is the second largest onshore wind farm in the world, producing 781.5 MW of power, followed by the Horse Hollow Wind Energy Center (735.5 MW). As of July 2013, the London Array in United Kingdom is the largest offshore wind farm in the world at 630 MW, followed by Thanet Offshore Wind Project in United Kingdom at 300 MW.

As of 2015, the largest photovoltaic (PV) power plants in the world are led by Longyangxia Dam Solar Park in China, rated at 850 megawatts.

Solar thermal power stations in the U.S. have the following output:
The country's largest solar facility at Kramer Junction has an output of 354 MW
The Blythe Solar Power Project planned production is estimated at 485 MW

Large coal-fired, nuclear, and hydroelectric power stations can generate hundreds of megawatts to multiple gigawatts. Some examples:
The Koeberg Nuclear Power Station in South Africa has a rated capacity of 1860 megawatts.
The coal-fired Ratcliffe-on-Soar Power Station in the UK has a rated capacity of 2 gigawatts.
The Aswan Dam hydro-electric plant in Egypt has a capacity of 2.1 gigawatts.
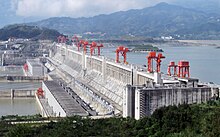
The Three Gorges Dam hydro-electric plant in China has a capacity of 22.5 gigawatts.
Gas turbine power plants can generate tens to hundreds of megawatts. Some examples:
The Indian Queens simple-cycle, or open cycle gas turbine (OCGT), peaking power station in Cornwall UK, with a single gas turbine is rated 140 megawatts.
The Medway Power Station, a combined-cycle gas turbine (CCGT) power station in Kent, UK with two gas turbines and one steam turbine, is rated 700 megawatts.[15]
The rated capacity of a power station is nearly the maximum electrical power that that power station can produce. Some power plants are run at almost exactly their rated capacity all the time, as a non-load-following base load power plant, except at times of scheduled or unscheduled maintenance.

However, many power plants usually produce much less power than their rated capacity.

In some cases a power plant produces much less power than its rated capacity because it uses an intermittent energy source. Operators try to pull maximum available power from such power plants, because their marginal cost is practically zero, but the available power varies widely—in particular, it may be zero during heavy storms at night.

In some cases operators deliberately produce less power for economic reasons. The cost of fuel to run a load following power plant may be relatively high, and the cost of fuel to run a peaking power plant is even higher—they have relatively high marginal costs. Operators keep power plants turned off ("operational reserve") or running at minimum fuel consumption[citation needed] ("spinning reserve") most of the time. Operators feed more fuel into load following power plants only when the demand rises above what lower-cost plants (i.e., intermittent and base load plants) can produce, and then feed more fuel into peaking power plants only when the demand rises faster than the load following power plants can follow.

Operations

Control room of a power plant

Operating staff at a power station have have several duties. Operators are responsible for the safety of the work crews that frequently do repairs on the mechanical and electrical equipment. They maintain the equipment with periodic inspections and log temperatures, pressures and other important information at regular intervals. Operators are responsible for starting and stopping the generators depending on need. They are able to synchronize and adjust the voltage output of the added generation with the running electrical system, without upsetting the system. They must know the electrical and mechanical systems to troubleshoot problems in the facility and add to the reliability of the facility. Operators must be able to respond to an emergency and know the procedures in place to deal with it.

Church of England

From Wikipedia, the free encyclopedia https://en.wikipedia.org/wiki/Church_of_England Church of England Abbreviation CofE Classification Pro...