Phenological development of
olive flowering, following
BBCH standard scale.
a-50, b-51, c-54, d-57, (<15 e-61="" flowers="" open="">50% open
flowers); f-65, (>15% open flowers); g-67, (<15 2013="" al.="" div="" et="" flowers="" h-68="" open="" teros="">
Phenology is the study of periodic plant and animal life cycle
events and how these are influenced by seasonal and interannual
variations in climate, as well as habitat factors (such as elevation).
Examples include the date of emergence of leaves and flowers, the first flight of butterflies, the first appearance of
migratory
birds, the date of leaf colouring and fall in deciduous trees, the
dates of egg-laying of birds and amphibia, or the timing of the
developmental cycles of
temperate-zone
honey bee colonies. In the scientific literature on
ecology,
the term is used more generally to indicate the time frame for any
seasonal biological phenomena, including the dates of last appearance
(e.g., the seasonal phenology of a species may be from April through
September).
Because many such phenomena are very sensitive to small variations in
climate, especially to temperature, phenological records can be a useful
proxy for temperature in
historical climatology, especially in the study of
climate change and
global warming.
For example, viticultural records of grape harvests in Europe have been
used to reconstruct a record of summer growing season temperatures
going back more than 500 years.
In addition to providing a longer historical baseline than instrumental measurements, phenological observations provide high
temporal resolution of ongoing changes related to
global warming.
Etymology
The word is derived from the
Greek φαίνω (
phainō), "to show, to bring to light, make to appear" + λόγος (
logos), amongst others "study, discourse, reasoning"
and indicates that phenology has been principally concerned with the
dates of first occurrence of biological events in their annual cycle.
Morren participated in 1842 and 1843 in Quetelets 'Observations
of Periodical Phenomena' (Observations des Phénomènes périodiques),
and at first suggested to mention the observations concerning botanical
phenomena 'anthochronological observations'. That term had already
been used in 1840 by
Carl Joseph Kreutzer.
It would take four more years before Morren first published “phenological memories”.
That the term was not really common in the decades to follow may be shown by an article in
The Zoologist
of 1899. The article describes an ornithological meeting in Sarajevo,
where 'questions of Phaenology' were discussed. A footnote by the
Editor,
William Lucas Distant,
says: “This word is seldom used, and we have been informed by a very
high authority that it may be defined as "Observational Biology," and as
applied to birds, as it is here, may be taken to mean the study or
science of observations on the appearance of birds.”
Records
Historical
Historical
day of year for first bloom index (FBI) for the Tallgrass Prairie
National Preserve, Kansas (dots) fitted with a local polynomial
regression model (loess in red) and a 2 standard error band (blue). Data
from William Monahan.
Observations of phenological events have provided indications of the
progress of the natural calendar since ancient agricultural times. Many
cultures have traditional phenological proverbs and sayings which
indicate a time for action: "When the sloe tree is white as a sheet, sow
your barley whether it be dry or wet" or attempt to forecast future
climate: "If oak's before ash, you're in for a splash. If ash before
oak, you're in for a soak". But the indications can be pretty
unreliable, as an alternative version of the rhyme shows: "If the oak is
out before the
ash,
'Twill be a summer of wet and splash; If the ash is out before the oak,
'Twill be a summer of fire and smoke." Theoretically, though, these are
not mutually exclusive, as one forecasts immediate conditions and one
forecasts future conditions.
The
North American Bird Phenology Program
at USGS Patuxent Wildlife Research Center (PWRC) is in possession of a
collection of millions of bird arrival and departure date records for
over 870 species across North America, dating between 1880 and 1970.
This program, originally started by
Wells W. Cooke,
involved over 3,000 observers including many notable naturalists of the
time. The program ran for 90 years and came to a close in 1970 when
other programs starting up at PWRC took precedence. The program was
again started in 2009 to digitize the collection of records and now with
the help of citizens worldwide, each record is being transcribed into a
database which will be publicly accessible for use.
In Japan and China the time of blossoming of cherry and peach
trees is associated with ancient festivals and some of these dates can
be traced back to the eighth century. Such historical records may, in
principle, be capable of providing estimates of climate at dates before
instrumental records became available. For example, records of the
harvest dates of the
pinot noir grape in
Burgundy have been used in an attempt to reconstruct spring–summer temperatures from 1370 to 2003; the reconstructed values during 1787–2000 have a correlation with Paris instrumental data of about 0.75.
Modern
Great Britain
Robert Marsham,
the founding father of modern phenological recording, was a wealthy
landowner who kept systematic records of "Indications of spring" on his
estate at
Stratton Strawless,
Norfolk,
from 1736. These took the form of dates of the first occurrence of
events such as flowering, bud burst, emergence or flight of an insect.
Generations of Marsham's family maintained consistent records of the
same events or "phenophases" over unprecedentedly long periods of time,
eventually ending with the death of Mary Marsham in 1958, so that trends
can be observed and related to long-term climate records. The data show
significant variation in dates which broadly correspond with warm and
cold years. Between 1850 and 1950 a long-term trend of gradual climate
warming is observable, and during this same period the Marsham record of
oak-leafing dates tended to become earlier.
After 1960 the rate of warming accelerated, and this is mirrored
by increasing earliness of oak leafing, recorded in the data collected
by Jean Combes in Surrey. Over the past 250 years, the first leafing
date of oak appears to have advanced by about 8 days, corresponding to
overall warming on the order of 1.5 °C in the same period.
Towards the end of the 19th century the recording of the
appearance and development of plants and animals became a national
pastime, and between 1891 and 1948 the
Royal Meteorological Society
(RMS) organised a programme of phenological recording across the
British Isles. Up to 600 observers submitted returns in some years, with
numbers averaging a few hundred. During this period 11 main plant
phenophases were consistently recorded over the 58 years from 1891–1948,
and a further 14 phenophases were recorded for the 20 years between
1929 and 1948. The returns were summarised each year in the Quarterly
Journal of the RMS as
The Phenological Reports. Jeffree (1960) summarised the 58 years of data,
which show that flowering dates could be as many as 21 days early and
as many as 34 days late, with extreme earliness greatest in
summer-flowering species, and extreme lateness in spring-flowering
species. In all 25 species, the timings of all phenological events are
significantly related to temperature, indicating that phenological events are likely to get earlier as climate warms.
The Phenological Reports ended suddenly in 1948 after 58
years, and Britain remained without a national recording scheme for
almost 50 years, just at a time when climate change was becoming
evident. During this period, individual dedicated observers made
important contributions. The naturalist and author
Richard Fitter
recorded the First Flowering Date (FFD) of 557 species of British
flowering plants in Oxfordshire between about 1954 and 1990. Writing in
Science in 2002, Richard Fitter and his son
Alistair Fitter
found that "the average FFD of 385 British plant species has advanced
by 4.5 days during the past decade compared with the previous four
decades."
They note that FFD is sensitive to temperature, as is generally agreed,
that "150 to 200 species may be flowering on average 15 days earlier in
Britain now than in the very recent past" and that these earlier FFDs
will have "profound ecosystem and evolutionary consequences". In
Scotland,
David Grisenthwaite
meticulously recorded the dates he mowed his lawn since 1984. His first
cut of the year was 13 days earlier in 2004 than in 1984, and his last
cut was 17 days later, providing evidence for an earlier onset of spring
and a warmer climate in general.
National recording was resumed by Tim Sparks in 1998 and, from 2000, has been led by
citizen science project Nature's Calendar, run by the
Woodland Trust and the
Centre for Ecology and Hydrology.
Latest research shows that oak bud burst has advanced more than 11 days
since the 19th century and that resident and migrant birds are unable
to keep up with this change.
Continental Europe
In Europe, phenological networks are operated in several
countries, e.g. Germany's national meteorological service operates a
very dense network with approx. 1200 observers, the majority of them on a
voluntary basis. The
Pan European Phenology
(PEP) project is a database that collects phenological data from
European countries. Currently 32 European meteorological services and
project partners from across Europe have joined and supplied data.
Other countries
There is a USA National Phenology Network in which both professional scientists and lay recorders participate.
Many other countries such as Canada (Alberta Plantwatch and Saskatchewan PlantWatch), China and Australia
also have phenological programs.
In eastern North America,
almanacs are traditionally used for information on action phenology (in agriculture), taking into account the astronomical positions at the time.
William Felker has studied phenology in
Ohio,
US, since 1973 and now publishes "Poor Will's Almanack", a phenological
almanac for farmers (not to be confused with a late 18th-century
almanac by the same name).
In the
Amazon rainforests of South America, the timing of leaf production and
abscission has been linked to rhythms in
gross primary production at several sites. Early in their lifespan, leaves reach a peak in their capacity for
photosynthesis,
and in tropical evergreen forests of some regions of the Amazon basin
(particularly regions with long dry seasons), many trees produce more
young leaves in the dry season, seasonally increasing the photosynthetic capacity of the forest.
Airborne sensors
NDVI
temporal profile for a typical patch of coniferous forest over a period
of six years. This temporal profile depicts the growing season every
year as well as changes in this profile from year to year due to
climatic and other constraints. Data and graph are based on the
MODIS sensor standard public vegetation index product. Data archived at the
ORNL DAAC , courtesy of Dr. Robert Cook.
Recent technological advances in studying the earth from space have
resulted in a new field of phenological research that is concerned with
observing the phenology of whole
ecosystems and stands of
vegetation
on a global scale using proxy approaches. These methods complement the
traditional phenological methods which recorded the first occurrences of
individual species and phenophases.
The most successful of these approaches is based on tracking the temporal change of a Vegetation Index (like
Normalized Difference Vegetation Index(NDVI)).
NDVI makes use of the vegetation's typical low reflection in the red
(red energy is mostly absorbed by growing plants for Photosynthesis) and
strong reflection in the Near
Infrared
(Infrared energy is mostly reflected by plants due to their cellular
structure). Due to its robustness and simplicity, NDVI has become one of
the most popular remote sensing based products. Typically, a vegetation
index is constructed in such a way that the attenuated reflected
sunlight energy (1% to 30% of incident sunlight) is amplified by
ratio-ing red and NIR following this equation:

The evolution of the vegetation index through time, depicted by the graph above, exhibits a strong
correlation
with the typical green vegetation growth stages (emergence,
vigor/growth, maturity, and harvest/senescence). These temporal curves
are analyzed to extract useful parameters about the vegetation growing
season (start of season, end of season, length of
growing season, etc.). Other growing season
parameters
could potentially be extracted, and global maps of any of these growing
season parameters could then be constructed and used in all sorts of
climatic change studies.
A noteworthy example of the use of
remote sensing based phenology is the work of Ranga Myneni from
Boston University. This work
showed an apparent increase in vegetation productivity that most likely
resulted from the increase in temperature and lengthening of the
growing season in the
boreal forest. Another example based on the
MODIS enhanced vegetation index (EVI) reported by Alfredo Huete at
the University of Arizona and colleagues showed that the
Amazon Rainforest,
as opposed to the long-held view of a monotonous growing season or
growth only during the wet rainy season, does in fact exhibit growth
spurts during the dry season.
However, these phenological parameters are only an approximation
of the true biological growth stages. This is mainly due to the
limitation of current space-based remote sensing, especially the spatial
resolution, and the nature of vegetation index. A pixel in an image
does not contain a pure target (like a tree, a shrub, etc.) but contains
a mixture of whatever intersected the sensor's field of view.
Phenological mismatch
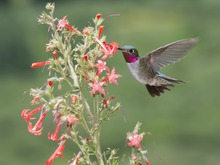
A
picture depicting a hummingbird visiting and pollinating a flower. If
the flower blooms too early in the season, or if the humming bird has a
delay in migration, this interaction will be lost.
Most species, including both plants and animals, interact with one another within ecosystems and habitats, known as
biological interactions.
These interactions (whether it be plant-plant, animal-animal,
predator-prey or plant-animal interactions) can be vital to the success
and survival of populations and therefore species.
Many species experience changes in life cycle development,
migration or in some other process/behavior at different times in the
season than previous patterns depict due to warming temperatures.
Phenological mismatches, where interacting species change the timing of
regularly repeated phases in their life cycles at different rates,
creates a mismatch in interaction timing and therefore negatively
harming the interaction. Mismatches can occur in many different biological interactions, including between species in one
trophic level (
intratrophic interactions) (ie. plant-plant), between different trophic levels (
intertrophic interactions) (ie. plant-animal) or through creating competition (
intraguild interactions).
For example, if a plant species blooms its flowers earlier than
previous years, but the pollinators that feed on and pollinate this
flower does not arrive or grow earlier as well, then a phenological
mismatch has occurred. This results in the plant population declining as
there are no pollinators to aid in their reproductive success.
Another example includes the interaction between plant species, where
the presence of one specie aids in the pollination of another through
attraction of pollinators. However, if these plant species develop at
mismatched times, this interaction will be negatively affected and
therefore the plant species that relies on the other will be harmed.
Phenological mismatches means the loss of many biological interactions and therefore
ecosystem functions
are also at risk of being negatively effects or lost all together.
Phenological mismatches his will effect species and ecosystems
food webs,
reproduction
success, resource availability, population and community dynamics in
future generations, and therefore evolutionary process and overall
biodiversity.


_in_Hyderabad_W_IMG_8660.jpg)