| https://en.wikipedia.org/wiki/Affluence_in_the_United_States |
In absolute terms affluence is a relatively widespread phenomenon in the United States, with over 30% of households having an income exceeding $100,000 per year and over 30% of households having a net worth exceeding $250,000, as of 2019. However, when looked at in relative terms, wealth is highly concentrated: the bottom 50% of Americans only share 2% of total household wealth while the top 1% hold 35% of that wealth.
In the United States, as of 2019, the median household income is $60,030 per year and the median household net worth is $97,300, while the mean household income is $89,930 per year and the mean household net worth is $692,100.
Income vs. wealth


While income is often seen as a type of wealth in colloquial language use, wealth and income are two substantially different measures of economic prosperity. Wealth is the total value of net possessions of an individual or household, while income is the total inflow of monetary assets over a given time period. Hence the change in wealth over that time period is equal to the income minus the expenditures in that period. Income is a so-called "flow" variable, while wealth is a so-called "stock" variable.
Income as a metric


Affluence in the United States has been attributed in many cases to inherited wealth amounting to "a substantial head start": in September 2012, the Institute for Policy Studies found that over 60 percent of the Forbes richest 400 Americans had grown up with substantial privilege.
Income is commonly used to measure affluence, although this is a relative indicator: a middle class person with a personal income of $77,500 annually and a billionaire may both be referred to as affluent, depending on reference groups. An average American with a median income of $32,000 ($39,000 for those employed full-time between the ages of 25 and 64) when used as a reference group would justify the personal income in the tenth percentile of $77,500 being described as affluent, but if this earner were compared to an executive of a Fortune 500 company, then the description would not apply. Accordingly, marketing firms and investment houses classify those with household incomes exceeding $250,000 as mass affluent, while the threshold upper class is most commonly defined as the top 1% with household incomes commonly exceeding $525,000 annually.
According to the U.S. Census Bureau, 42% of U.S. households have two income earners, thus making households' income levels higher than personal income levels; the percent of married-couple families with children where both parents work is 59.1%.
In 2005, the economic survey revealed the following income distribution for households and individuals:
- The top 5% of individuals had six-figure incomes (exceeding $100,000); the top 10% of individuals had incomes exceeding $75,000;
- The top 5% of households, three quarters of whom had two income earners, had incomes of $166,200 (about 10 times the 2009 US minimum wage, for one income earner, and about 5 times the 2009 US minimum wage for two income earners) or higher, with the top 10% having incomes well in excess of $100,000.
- The top 0.12% of households had incomes exceeding $1,600,000 annually.
Households may also be differentiated among each other, depending on whether or not they have one or multiple income earners (the high female participation in the economy means that many households have two working members). For example, in 2005 the median household income for a two income earner households was $67,000 while the median income for an individual employed full-time with a graduate degree was in excess of $60,000, demonstrating that nearly half of individuals with a graduate degree have earnings comparable with most dual income households.
By another measure – the number of square feet per person in the home – the average home in the United States has more than 700 square feet per person, 50% – 100% more than in other high-income countries (though this indicator may be regarded as an accident of geography, climate and social preference, both within the US and beyond it) but this metric indicates even those in the lowest income percentiles enjoy more living space than the middle classes in most European nations. Similarly ownership levels of 'gadgets' and access to amenities are exceptionally high compared to many other countries.
Overall, the term affluent may be applied to a variety of individuals, households, or other entities, depending on context. Data from the U.S. Census Bureau serves as the main guideline for defining affluence. U.S. government data not only reveal the nation's income distribution but also the demographic characteristics of those to whom the term "affluent", may be applied.
Wealth
Wealth in the United States is commonly measured in terms of net worth, which is the sum of all assets, including the market value of real estate, like a home, minus all liabilities. The United States is the wealthiest country in the world.

For example, a household in possession of an $800,000 house, $5,000 in mutual funds, $30,000 in cars, $20,000 worth of stock in their own company, and a $45,000 IRA would have assets totaling $900,000. Assuming that this household would have a $250,000 mortgage, $40,000 in car loans, and $10,000 in credit card debt, its debts would total $300,000. Subtracting the debts from the worth of this household's assets (900,000 − $300,000 = $600,000), this household would have a net worth of $600,000. Net worth can vary with fluctuations in value of the underlying assets.
As one would expect, households with greater income often have the highest net worths, though high income cannot be taken as an always accurate indicator of net worth. Overall the number of wealthier households is on the rise, with baby boomers hitting the highs of their careers. In addition, wealth is unevenly distributed, with the wealthiest 25% of US households owning 87% of the wealth in the United States, which was $54.2 trillion in 2009.
U.S. household and non-profit organization net worth rose from $44.2 trillion in Q1 2000 to a pre-recession peak of $67.7 trillion in Q3 2007. It then fell $13.1 trillion to $54.6 trillion in Q1 2009 due to the subprime mortgage crisis. It then recovered, rising consistently to $86.8 trillion by Q4 2015. This is nearly double the 2000 level.
Mechanisms to gain wealth
Assets are known as the raw materials of wealth, and they consist primarily of stocks and other financial and non-financial property, particularly homeownership. While tangible assets are unequally distributed, financial assets are much more unequal. In 2004, the top 1% controlled 50.3% of the financial assets while the bottom 90% held only 14.4% of the total US financial assets.
These discrepancies exist because the many wealth building tools established by the Federal Government work better for high earners. These include 401k plans, 403b plans, and IRAs. Traditional IRAs, 401k and 403b plans are tax shelters created for working individuals. These plans allow for tax sheltered (or pre-tax) contributions of earned income directly to tax sheltered savings accounts. Annual contributions are capped to ensure that high earners cannot enjoy the tax benefit disproportionately. The Roth IRA is another tool that can help create wealth in the working and middle classes.
Assets in Roth IRAs grow tax free; interests, dividends, and capital gains are all exempt from income taxes. Contributions to Roth IRAs are limited to those with annual incomes less than the threshold established yearly by the IRS. The benefits of these plans, however, are only available to workers and families whose incomes and expenses allow them excess funds to commit for a long period, typically until the investor reaches age 59½. The effect of these tools are further limited by the contribution limits placed on them.
Including human capital such as skills, the United Nations International Human Dimensions Programme estimated the total wealth of the United States in 2008 to be $118 trillion.
Top percentiles of income
Affluence and economic standing within society are often expressed in terms of percentile ranking. The economic ranking is conducted either in terms of giving lower thresholds for a designated group (e.g. the top 5%, 10%, 15%, etc.) or in terms of the percentage of households/individuals with incomes above a certain threshold (e.g. above $75,000, $100,000, $150,000, etc.). The table below presents 2006 income data in terms of the lower thresholds for the given percentages (e.g. the top 25.6% of households had incomes exceeding $80,000, compared to $47,000 for the top quarter of individuals).
| Data | Top third | Top quarter | Top quintile | Top 15% | Top 10% | Top 5% | Top 3% | Top 1.5% | Top 0.1% | |
|---|---|---|---|---|---|---|---|---|---|---|
| Household income | ||||||||||
| Lower threshold (annual gross income) | $65,000 | $80,000 | $91,202 | $100,000 | $118,200 | $166,200 | $200,000 | $250,000 | $1,600,000 | |
| Exact percentage of households | 34.72% | 25.60% | 20.00% | 17.80% | 10.00% | 5.00% | 2.67% | 1.50% | 0.12% | |
| Personal income (age 25+) | ||||||||||
| Lower threshold (annual gross income) | $37,500 | $47,500 | $52,500 | $62,500 | $75,000 | $100,000 | N/A | |||
| Exact percentage of individuals | 33.55% | 24.03% | 19.74% | 14.47% | 10.29% | 5.63% | N/A | |||
Source: U.S. Census Bureau, 2006
Household income over time
Household income changes over time, with income gains being substantially larger for the upper percentiles than for the lower percentiles. All areas of the income strata have seen their incomes rise since the late 1960s, especially during the late 1990s. The overall increase in household income is not the result of an increase in the percentage of households with more than one income earner. In fact, the lowest 50% population have become very poor sharing just 2% of wealth in spite of modern social practice of more than one working person, mostly women in the household. But the myth is highly prevalent and promoted by media. The standard of living of a 1960s single working parent can only be afforded today when both parents work due to disproportionate distribution of wealth today:
In about 2003, Elizabeth Warren said that "the typical middle-class household in the United States is no longer a one-earner family, with one parent in the workforce and one at home full-time. Instead, the majority of families with small children now have both parents rising at dawn to commute to jobs so they can both pull in paychecks... Today the median income for a fully employed male is ...nearly $800 less than his counterpart of a generation ago. The only real increase in wages for a family has come from the second paycheck earned by a working mother."
Two income-earner households are more common among the top quintile of households than the general population: 2006 U.S. Census Bureau data indicates that over three quarters, 76%, of households in the top quintile, with annual incomes exceeding $91,200, had two or more income earners compared to just 42% among the general population and a small minority in the bottom three quintiles. As a result, much of the rising income inequity between the upper and lower percentiles can be explained through the increasing percentage of households with two or more incomes.
| Data | 2003 | 2000 | 1997 | 1994 | 1991 | 1988 | 1985 | 1982 | 1979 | 1976 | 1973 | 1970 | 1967 |
|---|---|---|---|---|---|---|---|---|---|---|---|---|---|
| 20th percentile | $17,984 | $19,142 | $17,601 | $16,484 | $16,580 | $17,006 | $16,306 | $15,548 | $16,457 | $15,615 | $15,844 | $15,126 | $14,002 |
| Median (50th) | $43,318 | $44,853 | $42,294 | $39,613 | $39,679 | $40,678 | $38,510 | $36,811 | $38,649 | $36,155 | $37,700 | $35,832 | $33,338 |
| 80th percentile | $86,867 | $87,341 | $81,719 | $77,154 | $74,759 | $75,593 | $71,433 | $66,920 | $68,318 | $63,247 | $64,500 | $60,148 | $55,265 |
| 95th percentile | $154,120 | $155,121 | $144,636 | $134,835 | $126,969 | $127,958 | $119,459 | $111,516 | $111,445 | $100,839 | $102,243 | $95,090 | $88,678 |
Source: U.S. Census Bureau (2004): "Income, Poverty, and Health Insurance Coverage in the United States: 2003", p. 36 et seq. All figures are inflation-adjusted and given in 2003 dollars.
Income distribution over time


According to the Congressional Budget Office, between 1979 and 2007 incomes of the top 1% of Americans grew by an average of 275%. During the same time period, the 60% of Americans in the middle of the income scale saw their income rise by 40%. From 1992 to 2007 the top 400 income earners in the U.S. saw their income increase 392% and their average tax rate reduced by 37%. In 2009, the average income of the top 1% was $960,000 with a minimum income of $343,927.
During the economic expansion between 2002 and 2007, the income of the top 1% grew 10 times faster than the income of the bottom 90%. In this period 66% of total income gains went to the 1%, who in 2007 had a larger share of total income than at any time since 1928. According to PolitiFact and others, the top 400 wealthiest Americans "have more wealth than half of all Americans combined." Inherited wealth may help explain why many Americans who have become rich may have had a "substantial head start". In September 2012, according to the Institute for Policy Studies, "over 60 percent" of the Forbes richest 400 Americans "grew up in substantial privilege".
If a family has a positive net worth then it has more wealth than the combined net worth of over 30.6 million American families. This is because the bottom 25% of American families have a negative combined net worth.
Complications in interpreting income statistics
Interpreting these income statistics is complicated by several factors: membership in the top 1% changes from year to year, the IRS made large changes in the definition of adjusted gross income in 1987, and numbers for particular income ranges may be distorted by outliers (in the top segment) and failure to include transfer payments (in the lower segments).
Regarding Income Mobility, the IRS occasionally studies income data from actual households over time, usually over one decade. Their results underestimate income mobility by excluding those under age 25, the most mobile population, from their studies.
Many people look only at annual reported income data split into income quintiles. It is erroneous to assume that individual households remain in the same quintile over time, just as it usually is when using aggregate data. A majority of households in the top income quintile in one year, for example, will have moved to a lower quintile within a decade. Three out of four households in the top 0.01% of income will no longer be in that small group ten years later. In summary, half of all of U.S. households move from one income quintile to a different income quintile every decade. And actual households who started a decade in the lowest quintile of income, when tracked over the next ten years, will have proportionally more income growth than actual households who started the decade in the highest quintile of income. Thus, when comparing income/wealth quintile distributions from different time periods, generalizations can only be made with regards to the households in aggregate for each quintile, and can not be made to any individual households over the same time period (i.e. assuming the wealth value has been appropriately adjusted for differences in time, one cannot infer that a decrease in total wealth percentage for one quintile over time means that the households from that quintile have lost wealth as individuals, but only that total wealth percentage has decreased for those in that quintile at the time of measurement).
Top 20% income vs. the bottom 20% income households:
- The average number of people with jobs in a top income quintile household is two, while a majority of bottom-income-quintile households have no-one employed.
- If there are two adult income earners in a household who are married, their incomes are combined on tax forms. This is very common among top-quintile-income households. The lowest-quintile households, however, include a lot more single-person households, or two unmarried working adults living together and sharing expenses, but reporting their incomes to the IRS as if they were two separate households.
- 75%...80% of actual income for bottom-quintile-households consists of specific transfer payments from social or relief programs (aka "welfare" and other benefits), which payments are not included in IRS data as income. The top income quintile gets a very small percentage of their actual income from transfer payments.
- The IRS warns against comparisons of pre-1987 and post-1987 income data due to significant changes in the definition of adjusted gross income (AGI) that made top-quintile households appear to have large reported income gains, when in fact there was no change to their income at all. In addition to AGI changes, large marginal tax rate reductions during the Reagan Administration caused another large change in tax reporting. A lot of corporate income formerly reported on corporate tax returns was switched to lower-tax-rate individual tax returns (as Subchapter S corporations). This reporting change appeared to boost top-quintile income, when in fact their incomes had not changed. As a result, the top income quintile for households today includes a lot of corporate income previously reported in corporate tax returns, while Subchapter S corporations that lose money, are likely to be included in the bottom-income-quintile households. Income comparisons that compare pre-1987 to post-1987 income, are very common, but they are also biased, according to the IRS, and should be ignored.
Impact of age and experience: people that are older and have more experience, tend to have considerably larger incomes than younger and inexperienced workers. Normalizing for age and experience is rarely an effective statistical compensation, as each elderly citizen began as inexperienced.
Median income levels
Wealth distribution


According to an analysis that excludes pensions and social security, the richest 1% of the American population in 2007 owned 34.6% of the country's total wealth, and the next 19% owned 50.5%. Thus, the top 20% of Americans owned 85% of the country's wealth and the bottom 80% of the population owned 15%. Financial inequality was greater than inequality in total wealth, with the top 1% of the population owning 42.7%, the next 19% of Americans owning 50.3%, and the bottom 80% owning 7%. However, according to the federal reserve, "For most households, pensions and Social Security are the most important sources of income during retirement, and the promised benefit stream constitutes a sizable fraction of household wealth" and "including pensions and Social Security in net worth makes the distribution more even". When including household wealth from pensions and social security, the richest 1% of the American population in 1992 owned 16% of the country's total wealth, as opposed to 32% when excluding pensions and social security.
After the Great Recession which started in 2007, the share of total wealth owned by the top 1% of the population grew from 34.6% to 37.1%, and that owned by the top 20% of Americans grew from 85% to 87.7%. The Great Recession also caused a drop of 36.1% in median household wealth but a drop of only 11.1% for the top 1%.
Income inequality
Economists and related experts have described America's growing income inequality as "deeply worrying", unjust, a danger to democracy/social stability, and a sign of national decline. Yale professor Robert Shiller, who was among three Americans who won the Nobel prize for economics in 2013, said after receiving the award, "The most important problem that we are facing now today, I think, is rising inequality in the United States and elsewhere in the world."
Changes in wealth
1989–2001
When observing the changes in the wealth among American households, one can note an increase in wealthier individuals and a decrease in the number of poor households, while net worth increased most substantially in semi-wealthy and wealthy households. Overall the percentage of households with a negative net worth (more debt than assets) declined from 9.5% in 1989 to 4.1% in 2001.
The percentage of net worths ranging from $500,000 to one million doubled while the percentage of millionaires tripled. From 1995 to 2004, there was tremendous growth among household wealth, as it nearly doubled from $21.9 trillion to $43.6 trillion, but the wealthiest quartile of the economic distribution made up 89% of this growth. During this time frame, wealth became increasingly unequal, and the wealthiest 25% became even wealthier.
According to U.S. Census Bureau statistics, this 'upward shift' is most likely the result of a booming housing market which caused homeowners to experience tremendous increases in home equity. Life-cycles have also attributed to the rising wealth among Americans. With more and more baby-boomers reaching the climax of their careers and the middle-aged population making up a larger segment of the population now than ever before, more and more households have achieved comfortable levels of wealth. Zhu Xiao Di (2004) notes, that household wealth usually peaks around families headed by people in their 50s, and as a result, the baby boomer generation reached this age range at the time of the analysis.
After 2007
Household net worth fell from 2007 to 2009 by a total of $17.5 trillion or 25.5%. This was the equivalent loss of one year of GDP. By the fourth quarter of 2010, the household net worth had recovered by a growth of 1.3 percent to a total of $56.8 trillion. An additional growth of 15.7 percent is needed just to bring the value to where it was before the recession started in December 2007. In 2014 a record breaking net worth of $80.7 trillion was achieved.
Professions
According to the University of Chicago, the top 1% is primarily made up of owner-managers of small to medium-sized businesses of which the most profitable are physician's and dentist's offices, professional and technical services, specialty trade contracting, legal services. The typical business has $7 million in sales and 57 employees. With a 10% profit margin, this will place two business partners in the top 1%.
The remainder of the top 1% tends to be the classic professions: medicine, dentistry, law, engineering, finance, and corporate executive management.
A correlation has been shown between increases in income and increases in worker satisfaction. Increasing worker satisfaction, however, is not solely a result of the increase in income: workers in more complex and higher level occupations tend to have attained higher levels of education and thus are more likely to have a greater degree of autonomy in the workplace. Additionally, higher level workers with advanced degrees are hired to share their personal knowledge, to conceptualize, and to consult. Higher-level workers typically suffer less job alienation and reap not only external benefits in terms of income from their jobs, but also enjoy high levels of intrinsic motivation and satisfaction.
In the United States, the highest earning occupational group is referred to as white collar professionals. Individuals in this occupational classification tend to report the highest job satisfaction and highest incomes. Defining income based on title of a profession can be misleading, given that a professional title may indicate the type of education received, but does not always correlate with the actual day to day income-generating endeavors that are pursued.
Some sources cite the profession of physician in the United States as the highest paying, Physician (MD and DO) and Dentist (DMD and DDS) compensation ranks as the highest median annual earnings of all professions. Median annual earnings ranged from $149,310 for general dentists and $156,010 for family physicians to $321,686 for anesthesiologists. Surgeons post a median annual income of $282,504. However, the annual salary for Chief Executive Officer (C.E.O.) is projected quite differently based on source: Salary.com reports a median salary of $634,941, while the U.S. Department of Labor in May 2004 reported the median as $140,350. This is primarily due to a methodological difference in terms of which companies were surveyed. Overall annual earnings among the nation's top 25 professions ranged from the $70,000s to the $300,000s.
In addition to physicians, lawyers, physicists, and nuclear engineers were all among the nation's 20 highest paid occupations with incomes in excess of $78,410. Some of the other occupations in the high five-figure range were economists with a median of $72,780, mathematicians with $81,240, financial managers with $81,880, and software publishers with median annual earnings of $73,060. The median annual earnings of wage-and-salary pharmacists in May 2006 were $94,520. The median annual earnings of wage-and-salary engineers in November 2011 were $90,000. The middle 50 percent earned between $83,180 and $108,140 a year (as in the Occupational Outlook Handbook, 2008–09 Edition by the U.S. Bureau of Labor Statistics).
Education


Educational attainment plays a major factor in determining an individual's economic disposition. Personal income varied greatly according to an individual's education, as did household income.
Incomes for those employed, full-time, year-round and over the age of twenty-five ranged from $20,826 ($17,422 if including those who worked part-time) for those with less than a ninth grade education to $100,000 for those with professional degrees ($82,473 if including those who work part-time). The median income for individuals with doctorates was $79,401 ($70,853 if including those who work part-time).
These statistics reveal that the majority of those employed full-time with professional or doctoral degrees are among the overall top 10% (15% if including those who work part-time) of income earners. Of those with a master's degree, nearly 50% were among the top quarter of income earners (top third if including those who work part-time).
Religion
Individuals of a broad variety of religious backgrounds have become wealthy in America. However, the majority of these individuals follow Mainline Protestant denominations; Episcopalians and Presbyterians are most prevalent. According to a 2016 study by the Pew Research Center, Jewish again ranked as the most financially successful religious group in the United States, with 44% of Jews living in households with incomes of at least $100,000, followed by Hindu (36%), Episcopalians (35%), and Presbyterians (32%). Owing to their numbers, more Catholics (13.3 million) reside in households with a yearly income of $100,000 or more than any other religious group.
According to the same study there is a correlation between education and income, about 77% of American Hindus have an undergraduate degree and according to a study in 2020, they are earning the highest with median income $137,000, followed by Jews (59%), Episcopalians (56%), and Presbyterians (47%).
Race

Recent U.S. Census Bureau publications indicate a strong correlation between race and affluence. In the top household income quintile (households with incomes exceeding $91,200), Asian Americans and Whites were over represented, whereas Hispanics and African Americans were underrepresented.
In 2006, the household income for Asian Americans was, at $61,094, by far the highest, exceeding that of Whites ($48,554) by 26%. Over a quarter, 27.5%, of Asian American households had incomes exceeding $100,000, and another 40% had incomes of over $75,000.
Among White households, who remained near the national median, 18.3% had six figure incomes, while 28.9% had incomes exceeding $75,000. The percentages of households with incomes exceeding $100,000 and $75,000 were far below the national medians for Hispanic and African American households. Among Hispanic households, for example, only 9% had six figure incomes, and 17% had incomes exceeding $75,000. The race gap remained when considering personal income. In 2005, roughly 11% of Asian Americans and 7% of White individuals had six figure incomes, compared to 2.6% among Hispanics and 2.3% among African Americans.
The racial breakdowns of income brackets further illustrate the racial disparities associated with affluence. in 2005, 81.8% of all 114 million households were White (including White Hispanics), 12.2% were African American, 10.9% were Hispanic and 3.7% were Asian American.
While White households are always near the national median due to Whites being by far the most prevalent racial demographic, the percentages of minority households with incomes exceeding $100,000 strayed considerably from their percentage of the overall population: Asian Americans, who represent the smallest surveyed racial demographic in the overall population, were found to be the prevalent minority among six figure income households.
Among the nearly twenty million households with six figure incomes, 86.9% were White, 5.9% were Asian American, 5.6% were Hispanic and 5.5% were African American. Among the general individual population with earnings, 82.1% were White, 12.7% were Hispanic, 11.0% were African American and 4.6% were Asian American.
Of the top 10% of income earners, those nearly 15 million individuals with incomes exceeding $77,500, Whites and Asians were once again over-represented with the percentages of African Americans and Hispanics trailing behind considerably. Of the top 10% of earners, 86.7% were White. Asian Americans were the prevalent minority, constituting 6.8% of top 10% income earners, nearly twice the percentage of Asian Americans among the general population.
Hispanics, who were the prevalent minority in the general population of income earners, constituted only 5.2% of those in the top 10%, with African Americans being the least represented with 5.1%.
| Race | Overall median | High school | Some college | College graduate | Bachelor's degree | Master's degree | Doctoral degree | |
|---|---|---|---|---|---|---|---|---|
| Total population | All, age 25+ | 32,140 | 26,505 | 31,054 | 49,303 | 43,143 | 52,390 | 70,853 |
| Full-time workers, age 25–64 | 39,509 | 31,610 | 37,150 | 56,027 | 50,959 | 61,324 | 79,292 | |
| White alone | All, age 25+ | 33,030 | 27,311 | 31,564 | 49,972 | 43,833 | 52,318 | 71,268 |
| Full-time workers, age 25–64 | 40,422 | 32,427 | 38,481 | 56,903 | 51,543 | 61,441 | 77,906 | |
| Asian alone | All, age 25+ | 36,152 | 25,285 | 29,982 | 51,481 | 42,466 | 61,452 | 69,653 |
| Full-time workers, age 25–64 | 42,109 | 27,041 | 33,120 | 60,532 | 51,040 | 71,316 | 91,430 | |
| African American | All, age 25+ | 27,101 | 22,379 | 27,648 | 44,534 | 41,572 | 48,266 | 61,894 |
| Full-time workers, age 25–64 | 32,021 | 26,230 | 32,392 | 47,758 | 45,505 | 52,858 | N/A | |
| Hispanic or Latino | All, age 25+ | 23,613 | 22,941 | 28,698 | 41,596 | 37,819 | 50,901 | 67,274 |
| Full-time workers, age 25–64 | 27,266 | 26,461 | 33,120 | 46,594 | 41,831 | 53,880 | N/A | |
Source: U.S. Census Bureau, 2006
Status and stratification
Economic well-being is often associated with high societal status, yet income and economic compensation are a function of scarcity and act as only one of a number of indicators of social class. It is in the interest of all of society that open positions are adequately filled with a competent occupant enticed to do his or her best. As a result, an occupation that requires a scarce skill, the attainment of which is often documented through an educational degree, and entrusts its occupant with a high degree of influence will generally offer high economic compensation.
To put it another way, the high income is intended to ensure that the desired individuals obtain the necessary skills (e.g. medical or graduate school) and complete their tasks with the necessary vigor but differences in income may, however, be found among occupations of similar sociological nature: the median annual earnings of a physician were in excess of $150,000 in May 2004, compared to $95,000 for an attorney. Both occupations require finely tuned and scarce skill sets and both are essential to the well-being of society, yet physicians out-earned attorneys and other upper middle class professionals by a wide margin as their skill-sets are deemed especially scarce.
Overall, high status positions tend to be those requiring a scarce skill and are therefore commonly far better compensated than those in the middle of the occupational strata.
...It is essential that the duties of the positions be performed with the diligence that their importance requires. Inevitably, then, a society must have, first, some kind of rewards that it can use as inducements, and, second, some way of distributing these rewards differently according to positions. The rewards and their distribution become part of the social order... If the rights and perquisites of different positions in a society must be unequal, then society must be stratified... Hence every society... must differentiate persons... and must therefore possess a certain amount of institutionalized inequality.
— Kingsley Davis & Wilbert E. Moore, "Some Principles of Stratification", republished in Social Class and Stratification
It is important to note that the above is an ideal type, a simplified model of reality using optimal circumstances. In reality other factors such as discrimination based on race, ethnicity and gender as well as aggressive political lobbying by certain professional organizations also influence personal income. An individual's personal career decisions, as well as his or her personal connections within the nation's economic institutions, are also likely to have an effect on income, status and whether or not an individual may be referred to as affluent.
In contemporary America it is a combination of all these factors, with scarcity remaining by far the most prominent one, which determine a person's economic compensation. Due to higher status professions requiring advanced and thus less commonly found skill sets (including the ability to supervise and work with a considerable autonomy), these professions are better compensated through the means of income, making high status individuals affluent, depending on reference group.
While the two paragraphs above only describe the relationship between status and personal income, household income is also often used to infer status. As a result, the dual income phenomenon presents yet another problem in equating affluence with high societal status. As mentioned earlier in the article, 42% of households have two or more income earners, and 76% of households with six figure incomes have two or more income earners. Furthermore, people are most likely to marry their professional and societal equals.
It therefore becomes apparent that the majority of households with incomes exceeding the six figure mark are the result of an economic as well as personal union between two economic equals. Today, two nurses, each making $55,000 a year, can easily out-earn a single attorney who makes the median of $95,000 annually. Despite household income rising drastically through the union of two economic equals, neither individual has advanced his or her function and position within society. Yet the household (not the individual) may have become more affluent, assuming an increase in household members does not offset the dual-income derived gains.
| Dennis Gilbert, 2002 | William Thompson & Joseph Hickey, 2005 | Leonard Beeghley, 2004 | |||
|---|---|---|---|---|---|
| Class | Typical characteristics | Class | Typical characteristics | Class | Typical characteristics |
| Capitalist class (1%) | Top-level executives, high-rung politicians, heirs. Ivy League education common. | Upper class (1%) | Top-level executives, celebrities, heirs; income of $500,000+ common. Ivy league education common. | The super-rich (0.9%) | Multi-millionaires whose incomes commonly exceed $3.5 million or more; includes celebrities and powerful executives/politicians. Ivy League education common. |
| Upper middle class (15%) | Highly-educated (often with graduate degrees), most commonly salaried, professionals and middle management with large work autonomy. | Upper middle class (15%) | Highly-educated (often with graduate degrees) professionals & managers with household incomes varying from the high 5-figure range to commonly above $100,000. | The rich (5%) | Households with net worth of $1 million or more; largely in the form of home equity. Generally have college degrees. |
| Middle class (plurality/ majority?; ca. 46%) |
College-educated workers with considerably higher-than-average incomes and compensation; a man making $57,000 and a woman making $40,000 may be typical. | ||||
| Lower middle class (30%) | Semi-professionals and craftsmen with a roughly average standard of living. Most have some college education and are white-collar. | Lower middle class (32%) | Semi-professionals and craftsmen with some work autonomy; household incomes commonly range from $35,000 to $75,000. Typically, some college education. | ||
| Working class (30%) | Clerical and most blue-collar workers whose work is highly routinized. Standard of living varies depending on number of income earners, but is commonly just adequate. High school education. | ||||
| Working class (32%) | Clerical, pink- and blue-collar workers with often low job security; common household incomes range from $16,000 to $30,000. High school education. | Working class (ca. 40–45%) |
Blue-collar workers and those whose jobs are highly routinized with low economic security; a man making $40,000 and a woman making $26,000 may be typical. High school education. | ||
| Working poor (13%) | Service, low-rung clerical and some blue-collar workers. High economic insecurity and risk of poverty. Some high school education. | ||||
| Lower class (ca. 14–20%) | Those who occupy poorly-paid positions or rely on government transfers. Some high school education. | ||||
| Underclass (12%) | Those with limited or no participation in the labor force. Reliant on government transfers. Some high school education. | The poor (ca. 12%) | Those living below the poverty line with limited to no participation in the labor force; a household income of $18,000 may be typical. Some high school education. | ||
| |||||
Extreme affluence

As of 2002, there were approximately 146,000 (0.1%) households with incomes exceeding $1,500,000, while the top 0.01% or 11,000 households had incomes exceeding $5,500,000. The 400 highest tax payers in the nation had gross annual household incomes exceeding $87,000,000. Household incomes for this group have risen more dramatically than for any other. As a result, the gap between those who make less than one and half million dollars annually (99.9% of households) and those who make more (0.1%) has been steadily increasing, prompting The New York Times to proclaim that the "Richest Are Leaving Even the Rich Far Behind."
The income disparities within the top 1.5% are quite drastic. While households in the top 1.5% of households had incomes exceeding $250,000, 443% above the national median, their incomes were still 2200% lower than those of the top 0.1% of households.
Wealth statistics
- Family net worth
-
 U.S. mean family net worth by percentile of net worth (1989–2007)
 -
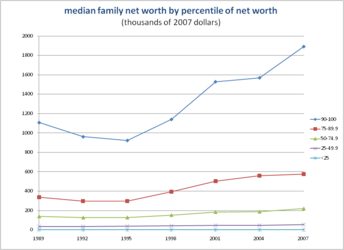 U.S. median family net worth by percentile of net worth (1989–2007)


The total value of all U.S. household wealth in 2000 was approximately $44 trillion. Prior to the Late-2000s recession which began in December 2007 its value was at $65.9 trillion. After, it plunged to $48.5 trillion during the first quarter of 2009. The total household net worth rose 1.3% by the fourth quarter of 2009 to $54.2 trillion, indicating the American economy is recovering.
.svg)


,_Credit_Suisse.png)


,_2018.jpg)


