Search This Blog

Wednesday, September 18, 2019

Atlantic multidecadal oscillation

From Wikipedia, the free encyclopedia

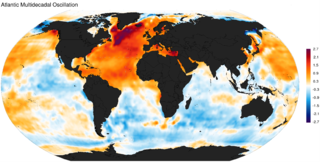
Atlantic multidecadal oscillation spatial pattern obtained as the regression of monthly HadISST sea surface temperature anomalies (1870-2013).
 
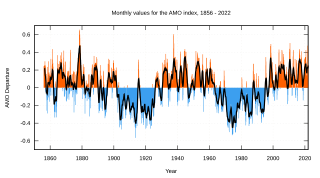
Atlantic Multidecadal Oscillation Index according to the methodology proposed by van Oldenborgh et al. 1880-2018.
Atlantic Multidecadal Oscillation index computed as the linearly detrended North Atlantic sea surface temperature anomalies 1856-2013.
 
The Atlantic Multidecadal Oscillation (AMO) is a climate cycle that affects the sea surface temperature (SST) of the North Atlantic Ocean based on different modes on multidecadal timescales. While there is some support for this mode in models and in historical observations, controversy exists with regard to its amplitude, and in particular, the attribution of sea surface temperature change to natural or anthropogenic causes, especially in tropical Atlantic areas important for hurricane development. The Atlantic multidecadal oscillation is also connected with shifts in hurricane activity, rainfall patterns and intensity, and changes in fish populations.

Definition

The Atlantic Multidecadal Oscillation (AMO) was identified by Schlesinger and Ramankutty in 1994.

The AMO signal is usually defined from the patterns of SST variability in the North Atlantic once any linear trend has been removed. This detrending is intended to remove the influence of greenhouse gas-induced global warming from the analysis. However, if the global warming signal is significantly non-linear in time (i.e. not just a smooth linear increase), variations in the forced signal will leak into the AMO definition. Consequently, correlations with the AMO index may mask effects of global warming.

AMO Index

Several methods have been proposed to remove the global trend and El Niño-Southern Oscillation (ENSO) influence over the North Atlantic SST. Trenberth and Shea, assuming that the effect of global forcing over the North Atlantic is similar to the global ocean, subtracted the global (60°N-60°S) mean SST from the North Atlantic SST to derive a revised AMO index.

Ting et al. however argue that the forced SST pattern is not globally uniform; they separated the forced and internally generated variability using signal to noise maximizing EOF analysis.

Van Oldenborgh et al. derived an AMO index as the SST averaged over the extra-tropical North Atlantic (to remove the influence of ENSO that is greater at tropical latitude) minus the regression on global mean temperature.

Guan and Nigam removed the non stationary global trend and Pacific natural variability before applying an EOF analysis to the residual North Atlantic SST.

The linearly detrended index suggests that the North Atlantic SST anomaly at the end of the twentieth century is equally divided between the externally forced component and internally generated variability, and that the current peak is similar to middle twentieth century; by contrast the others methodology suggest that a large portion of the North Atlantic anomaly at the end of the twentieth century is externally forced.

Frajka-Williams et al. 2017 pointed out that recent changes in cooling of the subpolar gyre, warm temperatures in the subtropics and cool anomalies over the tropics, increased the spatial distribution of meridional gradient in sea surface temperatures, which is not captured by the AMO Index.

Mechanisms

Based on the about 150-year instrumental record a quasi-periodicity of about 70 years, with a few distinct warmer phases between ca. 1930–1965 and after 1995, and cool between 1900–1930 and 1965–1995 has been identified. In models, AMO-like variability is associated with small changes in the North Atlantic branch of the Thermohaline Circulation. However, historical oceanic observations are not sufficient to associate the derived AMO index to present-day circulation anomalies. Models and observations indicate that changes in atmospheric circulation, which induce changes in clouds, atmospheric dust and surface heat flux, are largely responsible for the tropical portion of the AMO.

The Atlantic Multidecadal Oscillation (AMO) is important for how external forcings are linked with North Atlantic SSTs.

Climate impacts worldwide

The AMO is correlated to air temperatures and rainfall over much of the Northern Hemisphere, in particular in the summer climate in North America and Europe. Through changes in atmospheric circulation, the AMO can also modulate spring snowfall over the Alps and glaciers' mass variability. Rainfall patterns are affected in North Eastern Brazilian and African Sahel. It is also associated with changes in the frequency of North American droughts and is reflected in the frequency of severe Atlantic hurricane activity.

Recent research suggests that the AMO is related to the past occurrence of major droughts in the US Midwest and the Southwest. When the AMO is in its warm phase, these droughts tend to be more frequent or prolonged. Two of the most severe droughts of the 20th century occurred during the positive AMO between 1925 and 1965: The Dust Bowl of the 1930s and the 1950s drought. Florida and the Pacific Northwest tend to be the opposite—warm AMO, more rainfall.

Climate models suggest that a warm phase of the AMO strengthens the summer rainfall over India and Sahel and the North Atlantic tropical cyclone activity. Paleoclimatologic studies have confirmed this pattern—increased rainfall in AMO warmphase, decreased in cold phase—for the Sahel over the past 3,000 years.

Relation to Atlantic hurricanes

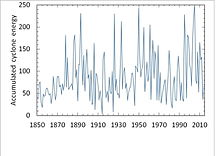
North Atlantic tropical cyclone activity according to the Accumulated Cyclone Energy Index, 1950–2015. For a global ACE graph visit this link.
 
A 2008 study correlated the Atlantic Multidecadal Mode (AMM), with HURDAT data (1851–2007), and noted a positive linear trend for minor hurricanes (category 1 and 2), but removed when the authors adjusted their model for undercounted storms, and stated "If there is an increase in hurricane activity connected to a greenhouse gas induced global warming, it is currently obscured by the 60 year quasi-periodic cycle." With full consideration of meteorological science, the number of tropical storms that can mature into severe hurricanes is much greater during warm phases of the AMO than during cool phases, at least twice as many; the AMO is reflected in the frequency of severe Atlantic hurricanes. Based on the typical duration of negative and positive phases of the AMO, the current warm regime is expected to persist at least until 2015 and possibly as late as 2035. Enfield et al. assume a peak around 2020.

Since 1995, there have been nine Atlantic hurricane seasons considered "extremely active" by Accumulated Cyclone Energy - 1995, 1996, 1998, 1999, 2003, 2004, 2005, 2010 and 2017.

Periodicity and prediction of AMO shifts

There are only about 130–150 years of data based on instrument data, which are too few samples for conventional statistical approaches. With the aid of multi-century proxy reconstruction, a longer period of 424 years was used by Enfield and Cid–Serrano as an illustration of an approach as described in their paper called "The Probabilistic Projection of Climate Risk". Their histogram of zero crossing intervals from a set of five re-sampled and smoothed version of Gray et al. (2004) index together with the maximum likelihood estimate gamma distribution fit to the histogram, showed that the largest frequency of regime interval was around 10–20 year. The cumulative probability for all intervals 20 years or less was about 70%.

There is no demonstrated predictability for when the AMO will switch, in any deterministic sense. Computer models, such as those that predict El Niño, are far from being able to do this. Enfield and colleagues have calculated the probability that a change in the AMO will occur within a given future time frame, assuming that historical variability persists. Probabilistic projections of this kind may prove to be useful for long-term planning in climate sensitive applications, such as water management. 

Assuming that the AMO continues with a quasi-cycle of roughly 70 years, the peak of the current warm phase would be expected in c. 2020, or based on a 50–90 year quasi-cycle, between 2000 and 2040 (after peaks in c. 1880 and c. 1950).

A 2017 study predicts a continued cooling shift beginning 2014, and the authors note, "..unlike the last cold period in the Atlantic, the spatial pattern of sea surface temperature anomalies in the Atlantic is not uniformly cool, but instead has anomalously cold temperatures in the subpolar gyre, warm temperatures in the subtropics and cool anomalies over the tropics. The tripole pattern of anomalies has increased the subpolar to subtropical meridional gradient in SSTs, which are not represented by the AMO index value, but which may lead to increased atmospheric baroclinicity and storminess."
Accumulated cyclone energy

From Wikipedia, the free encyclopedia
 
Accumulated cyclone energy (ACE) is a measure used by various agencies including the National Oceanic and Atmospheric Administration (NOAA) and the India Meteorological Department to express the activity of individual tropical cyclones and entire tropical cyclone seasons. It uses an approximation of the wind energy used by a tropical system over its lifetime and is calculated every six hours. The ACE of a season is the sum of the ACEs for each storm and takes into account the number, strength, and duration of all the tropical storms in the season. The highest ACE calculated for a single storm is 82, for Hurricane/Typhoon Ioke in 2006.

Calculation

The ACE of a season is calculated by summing the squares of the estimated maximum sustained velocity of every active tropical storm (wind speed 35 knots [65 km/h, 40 mph] or higher), at six-hour intervals. Since the calculation is sensitive to the starting point of the six-hour intervals, the convention is to use 00:00, 06:00, 12:00, and 18:00 UTC. If any storms of a season happen to cross years, the storm's ACE counts for the previous year. The numbers are usually divided by 10,000 to make them more manageable. One unit of ACE equals 104 kn2, and for use as an index the unit is assumed. Thus:
where vmax is estimated sustained wind speed in knots

Kinetic energy is proportional to the square of velocity, and by adding together the energy per some interval of time, the accumulated energy is found. As the duration of a storm increases, more values are summed and the ACE also increases such that longer-duration storms may accumulate a larger ACE than more-powerful storms of lesser duration. Although ACE is a value proportional to the energy of the system, it is not a direct calculation of energy (the mass of the moved air and therefore the size of the storm would show up in a real energy calculation). 

A related quantity is hurricane destruction potential (HDP), which is ACE but only calculated for the time where the system is a hurricane.

Atlantic basin ACE

Atlantic basin cyclone intensity by Accumulated cyclone energy, timeseries 1850-2014
 
A season's ACE is used by NOAA and others to categorize the hurricane season into 3 groups by its activity. Measured over the period 1951–2000 for the Atlantic basin, the median annual index was 87.5 and the mean annual index was 93.2. The NOAA categorization system divides seasons into:
  • Above-normal season: An ACE value above 111 (120% of the 1981–2010 median), provided at least two of the following three parameters are also exceeded: number of tropical storms: 12, hurricanes: 6, and major hurricanes: 2.
  • Near-normal season: neither above-normal nor below normal
  • Below-normal season: An ACE value below 66 (71.4% of the 1981–2010 median), or none of the following three parameters are exceeded: number of tropical storms: 9, hurricanes: 4, and major hurricanes: 1.
According to the NOAA categorization system for the Atlantic, the most recent above-normal season is the 2018 season, the most recent near-normal season is the 2014 season, and the most recent below normal season is the 2015 season.

Hyperactivity

The term hyperactive is used by Goldenberg et al. (2001) based on a different weighting algorithm, which places more weight on major hurricanes, but typically equating to an ACE of about 153 (175% of the 1951–2000 median) or more.

Individual storms in the Atlantic

The highest ever ACE estimated for a single storm in the Atlantic is 73.6, for the San Ciriaco hurricane in 1899. This single storm had an ACE higher than many whole Atlantic storm seasons. Other Atlantic storms with high ACEs include Hurricane Ivan in 2004, with an ACE of 70.4, Hurricane Irma in 2017, with an ACE of 64.9, the Great Charleston Hurricane in 1893, with an ACE of 63.5, Hurricane Isabel in 2003, with an ACE of 63.3, and the 1932 Cuba hurricane, with an ACE of 59.8.

Since 1950, the highest ACE of a tropical storm was Tropical Storm Laura in 1971, which attained an ACE of 8.6. The highest ACE of a Category 1 hurricane was Hurricane Nadine in 2012, which attained an ACE of 26.3. The lowest ACE of a tropical storm was 2000's Tropical Storm Chris and 2017's Tropical Storm Philippe, both of which were tropical storms for only six hours and had an ACE of just 0.1. The lowest ACE of any hurricane was 2005's Hurricane Cindy, which was only a hurricane for six hours, and 2007's Hurricane Lorenzo, which was a hurricane for twelve hours; both of which had an ACE of just 1.5. The lowest ACE of a major hurricane (Category 3 or higher), was Hurricane Gerda in 1969, with an ACE of 5.3. The only years since 1950 to feature two storms with an ACE index of over 40 points have been 1966, 2003, and 2004, and the only year to feature three storms is 2017.

The following table shows those storms in the Atlantic basin from 1950–2019 that have attained over 40 points of ACE.

Storm Year Peak classification ACE Duration
Hurricane Ivan 2004
Category 5 hurricane
70.4 23 days
Hurricane Irma 2017
Category 5 hurricane
64.9 13 days
Hurricane Isabel 2003
Category 5 hurricane
63.3 14 days
Hurricane Donna 1960
Category 4 hurricane
57.6 16 days
Hurricane Carrie 1957
Category 4 hurricane
55.8 21 days
Hurricane Inez 1966
Category 4 hurricane
54.6 21 days
Hurricane Luis 1995
Category 4 hurricane
53.5 16 days
Hurricane Allen 1980
Category 5 hurricane
52.3 12 days
Hurricane Esther 1961
Category 4 hurricane
52.2 18 days
Hurricane Matthew 2016
Category 5 hurricane
50.9 12 days
Hurricane Flora 1963
Category 4 hurricane
49.4 16 days
Hurricane Edouard 1996
Category 4 hurricane
49.3 14 days
Hurricane Beulah 1967
Category 5 hurricane
47.9 17 days
Hurricane Dorian 2019
Category 5 hurricane
47.8 15 days
Hurricane Dog 1950
Category 4 hurricane
47.5 13 days
Hurricane Betsy 1965
Category 4 hurricane
47.0 18 days
Hurricane Frances 2004
Category 4 hurricane
45.9 15 days
Hurricane Faith 1966
Category 3 hurricane
45.4 17 days
Hurricane Maria 2017
Category 5 hurricane
44.8 14 days
Hurricane Ginger 1971
Category 2 hurricane
44.2 28 days
Hurricane David 1979
Category 5 hurricane
44.0 12 days
Hurricane Jose 2017
Category 4 hurricane
43.3 17 days
Hurricane Fabian 2003
Category 4 hurricane
43.2 14 days
Hurricane Hugo 1989
Category 5 hurricane
42.7 12 days
Hurricane Gert 1999
Category 4 hurricane
42.3 12 days
Hurricane Igor 2010
Category 4 hurricane
41.9 14 days

Atlantic hurricane seasons, 1851–2019

Due to the scarcity and imprecision of early offshore measurements, ACE data for the Atlantic hurricane season is less reliable prior to the modern satellite era,but NOAA has analyzed the best available information dating back to 1851. The 1933 Atlantic hurricane season is considered the highest ACE on record with a total of 259. For the current season or the season that just ended, the ACE is preliminary based on National Hurricane Center bulletins, which may later be revised.

Eastern Pacific ACE

Observed monthly values for the PDO index, 1900–present.
 
Historical East Pacific Seasonal Activity, 1981–2015.

Individual storms in the Eastern Pacific (east of 180°W)

The highest ever ACE estimated for a single storm in the Eastern or Central Pacific, while located east of the International Date Line is 62.8, for Hurricane Fico of 1978. Other Eastern Pacific storms with high ACEs include Hurricane John in 1994, with an ACE of 54.0, Hurricane Kevin in 1991, with an ACE of 52.1, and Hurricane Hector of 2018, with an ACE of 50.5.

The following table shows those storms in the Eastern and Central Pacific basins from 1971–2018 that have attained over 30 points of ACE.

Storm Year Peak classification ACE Duration
Hurricane Fico 1978
Category 4 hurricane
62.8 20 days
Hurricane John dagger 1994
Category 5 hurricane
54.0 19 days
Hurricane Kevin 1991
Category 4 hurricane
52.1 17 days
Hurricane Hector dagger 2018
Category 4 hurricane
50.5 13 days
Hurricane Tina 1992
Category 4 hurricane
47.7 22 days
Hurricane Trudy 1990
Category 4 hurricane
45.8 16 days
Hurricane Lane 2018
Category 5 hurricane
44.2 13 days
Hurricane Dora dagger 1999
Category 4 hurricane
41.4 13 days
Hurricane Jimena 2015
Category 4 hurricane
40.0 15 days
Hurricane Guillermo 1997
Category 5 hurricane
40.0 16 days
Hurricane Norbert 1984
Category 4 hurricane
39.6 12 days
Hurricane Norman 2018
Category 4 hurricane
36.6 12 days
Hurricane Celeste 1972
Category 4 hurricane
36.3 16 days
Hurricane Sergio 2018
Category 4 hurricane
35.5 13 days
Hurricane Lester 2016
Category 4 hurricane
35.4 14 days
Hurricane Olaf 2015
Category 4 hurricane
34.6 12 days
Hurricane Jimena 1991
Category 4 hurricane
34.5 12 days
Hurricane Doreen 1973
Category 4 hurricane
34.3 16 days
Hurricane Ioke dagger 2006
Category 5 hurricane
34.2 7 days
Hurricane Marie 1990
Category 4 hurricane
33.1 14 days
Hurricane Orlene 1992
Category 4 hurricane
32.4 12 days
Hurricane Greg 1993
Category 4 hurricane
32.3 13 days
Hurricane Hilary 2011
Category 4 hurricane
31.2 9 days
dagger – Indicates that the storm formed in the Eastern/Central Pacific, but crossed 180°W at least once, therefore only the ACE and number of days spent in the EPAC/CPAC are included.

Eastern Pacific hurricane seasons, 1971–2019

Accumulated Cyclone Energy is also used in the eastern and central Pacific Ocean. Data on ACE is considered reliable starting with the 1971 season. The season with the highest ACE since 1971 is the 2018 season. The 1977 season has the lowest ACE. The most recent above-normal season is the 2018 season, the most recent near-normal season is the 2017 season, and the most recent below normal season is the 2013 season. The 35 year median 1971–2005 is 115 x 104 kn2 (100 in the EPAC zone east of 140°W, 13 in the CPAC zone); the mean is 130 (112 + 18).

Sahara (Climate)

From Wikipedia, the free encyclopedia

The Sahara is the world's largest low-latitude hot desert. It is located in the horse latitudes under the subtropical ridge, a significant belt of semi-permanent subtropical warm-core high pressure where the air from upper levels of the troposphere tends to sink towards the ground. This steady descending airflow causes a warming and a drying effect in the upper troposphere. The sinking air prevents evaporating water from rising, and therefore prevents adiabatic cooling, which makes cloud formation extremely difficult to nearly impossible.

The permanent dissolution of clouds allows unhindered light and thermal radiation. The stability of the atmosphere above the desert prevents any convective overturning, thus making rainfall virtually non-existent. As a consequence, the weather tends to be sunny, dry and stable with a minimal chance of rainfall. Subsiding, diverging, dry air masses associated with subtropical high-pressure systems are extremely unfavorable for the development of convectional showers. The subtropical ridge is the predominant factor that explains the hot desert climate (Köppen climate classification BWh) of this vast region. The descending airflow is the strongest and the most effective over the eastern part of the Great Desert, in the Libyan Desert: this is the sunniest, driest and the most nearly "rainless" place on the planet, rivaling the Atacama Desert, lying in Chile and Peru.

The rainfall inhibition and the dissipation of cloud cover are most accentuated over the eastern section of the Sahara rather than the western. The prevailing air mass lying above the Sahara is the continental tropical (cT) air mass, which is hot and dry. Hot, dry air masses primarily form over the North-African desert from the heating of the vast continental land area, and it affects the whole desert during most of the year. Because of this extreme heating process, a thermal low is usually noticed near the surface, and is the strongest and the most developed during the summertime. The Sahara High represents the eastern continental extension of the Azores High, centered over the North Atlantic Ocean. The subsidence of the Sahara High nearly reaches the ground during the coolest part of the year, while it is confined to the upper troposphere during the hottest periods. 

The effects of local surface low pressure are extremely limited because upper-level subsidence still continues to block any form of air ascent. Also, to be protected against rain-bearing weather systems by the atmospheric circulation itself, the desert is made even drier by its geographical configuration and location. Indeed, the extreme aridity of the Sahara is not only explained by the subtropical high pressure: the Atlas Mountains of Algeria, Morocco and Tunisia also help to enhance the aridity of the northern part of the desert. These major mountain ranges act as a barrier, causing a strong rain shadow effect on the leeward side by dropping much of the humidity brought by atmospheric disturbances along the polar front which affects the surrounding Mediterranean climates. 

The primary source of rain in the Sahara is the Intertropical Convergence Zone, a continuous belt of low-pressure systems near the equator which bring the brief, short and irregular rainy season to the Sahel and southern Sahara. Rainfall in this giant desert has to overcome the physical and atmospheric barriers that normally prevent the production of precipitation. The harsh climate of the Sahara is characterized by: extremely low, unreliable, highly erratic rainfall; extremely high sunshine duration values; high temperatures year-round; negligible rates of relative humidity; a significant diurnal temperature variation; and extremely high levels of potential evaporation which are the highest recorded worldwide.

Temperature

The sky is usually clear above the desert, and the sunshine duration is extremely high everywhere in the Sahara. Most of the desert has more than 3,600 hours of bright sunshine per year (over 82% of daylight hours), and a wide area in the eastern part has over 4,000 hours of bright sunshine per year (over 91% of daylight hours). The highest values are very close to the theoretical maximum value. A value of 4300 hours (98%) of the time would be recorded in Upper Egypt (Aswan, Luxor) and in the Nubian Desert (Wadi Halfa). The annual average direct solar irradiation is around 2,800 kWh/(m2 year) in the Great Desert. The Sahara has a huge potential for solar energy production.

Sand dunes in the Sahara
 
The high position of the Sun, the extremely low relative humidity, and the lack of vegetation and rainfall make the Great Desert the hottest large region in the world, and the hottest place on Earth during summer in some spots. The average high temperature exceeds 38 to 40 °C or 100.4 to 104.0 °F during the hottest month nearly everywhere in the desert except at very high altitudes. The world's highest officially recorded average daily high temperature was 47 °C or 116.6 °F in a remote desert town in the Algerian Desert called Bou Bernous, at an elevation of 378 metres (1,240 ft) above sea level, and only Death Valley, California rivals it. Other hot spots in Algeria such as Adrar, Timimoun, In Salah, Ouallene, Aoulef, Reggane with an elevation between 200 and 400 metres (660 and 1,310 ft) above sea level get slightly lower summer average highs, around 46 °C or 114.8 °F during the hottest months of the year. Salah, well known in Algeria for its extreme heat, has average high temperatures of 43.8 °C or 110.8 °F, 46.4 °C or 115.5 °F, 45.5 °C or 113.9 °F and 41.9 °C or 107.4 °F in June, July, August and September respectively. There are even hotter spots in the Sahara, but they are located in extremely remote areas, especially in the Azalai, lying in northern Mali. The major part of the desert experiences around three to five months when the average high strictly exceeds 40 °C or 104 °F; while in the southern central part of the desert, there are up to six or seven months when the average high temperature strictly exceeds 40 °C or 104 °F. Some examples of this are Bilma, Niger and Faya-Largeau, Chad. The annual average daily temperature exceeds 20 °C or 68 °F everywhere and can approach 30 °C or 86 °F in the hottest regions year-round. However, most of the desert has a value in excess of 25 °C or 77 °F. 

Sunset in Sahara
 
Sand and ground temperatures are even more extreme. During daytime, the sand temperature is extremely high: it can easily reach 80 °C or 176 °F or more. A sand temperature of 83.5 °C (182.3 °F) has been recorded in Port Sudan. Ground temperatures of 72 °C or 161.6 °F have been recorded in the Adrar of Mauritania and a value of 75 °C (167 °F) has been measured in Borkou, northern Chad.

Due to lack of cloud cover and very low humidity, the desert usually has high diurnal temperature variations between days and nights. However, it is a myth that the nights are cold after extremely hot days in the Sahara. The average diurnal temperature range is typically between 13 and 20 °C or 23.4 and 36.0 °F. The lowest values are found along the coastal regions due to high humidity and are often even lower than 10 °C or 18 °F, while the highest values are found in inland desert areas where the humidity is the lowest, mainly in the southern Sahara. Still, it is true that winter nights can be cold as it can drop to the freezing point and even below, especially in high-elevation areas. The frequency of subfreezing winter nights in the Sahara is strongly influenced by the North Atlantic Oscillation (NAO), with warmer winter temperatures during negative NAO events and cooler winters with more frosts when the NAO is positive. This is because the weaker clockwise flow around the eastern side of the subtropical anticyclone during negative NAO winters, although too dry to produce more than negligible precipitation, does reduce the flow of dry, cold air from higher latitudes of Eurasia into the Sahara significantly.

Precipitation

The average annual rainfall ranges from very low in the northern and southern fringes of the desert to nearly non-existent over the central and the eastern part. The thin northern fringe of the desert receives more winter cloudiness and rainfall due to the arrival of low pressure systems over the Mediterranean Sea along the polar front, although very attenuated by the rain shadow effects of the mountains and the annual average rainfall ranges from 100 millimetres (4 in) to 250 millimetres (10 in). For example, Biskra, Algeria, and Ouarzazate, Morocco, are found in this zone. The southern fringe of the desert along the border with the Sahel receives summer cloudiness and rainfall due to the arrival of the Intertropical Convergence Zone from the south and the annual average rainfall ranges from 100 millimetres (4 in) to 250 millimetres (10 in). For example, Timbuktu, Mali and Agadez, Niger are found in this zone. The vast central hyper-arid core of the desert is virtually never affected by northerly or southerly atmospheric disturbances and permanently remains under the influence of the strongest anticyclonic weather regime, and the annual average rainfall can drop to less than 1 millimetre (0.04 in). In fact, most of the Sahara receives less than 20 millimetres (0.8 in). Of the 9,000,000 square kilometres (3,500,000 sq mi) of desert land in the Sahara, an area of about 2,800,000 square kilometres (1,100,000 sq mi) (about 31% of the total area) receives an annual average rainfall amount of 10 millimetres (0.4 in) or less, while some 1,500,000 square kilometres (580,000 sq mi) (about 17% of the total area) receives an average of 5 millimetres (0.2 in) or less. The annual average rainfall is virtually zero over a wide area of some 1,000,000 square kilometres (390,000 sq mi) in the eastern Sahara comprising deserts of: Libya, Egypt and Sudan (Tazirbu, Kufra, Dakhla, Kharga, Farafra, Siwa, Asyut, Sohag, Luxor, Aswan, Abu Simbel, Wadi Halfa) where the long-term mean approximates 0.5 millimetres (0.02 in) per year. Rainfall is very unreliable and erratic in the Sahara as it may vary considerably year by year. In full contrast to the negligible annual rainfall amounts, the annual rates of potential evaporation are extraordinarily high, roughly ranging from 2,500 millimetres (100 in) per year to more than 6,000 millimetres (240 in) per year in the whole desert. Nowhere else on Earth has air been found as dry and evaporative as in the Sahara region. However, at least two instances of snowfall have been recorded in Sahara, in February 1979 and December 2016, both in the town of Ain Sefra.

Desertification and prehistoric climate

One theory for the formation of the Sahara is that the monsoon in Northern Africa was weakened because of glaciation during the Quaternary period, starting two or three million years ago. Another theory is that the monsoon was weakened when the ancient Tethys Sea dried up during the Tortonian period around 7 million years.

The climate of the Sahara has undergone enormous variations between wet and dry over the last few hundred thousand years, believed to be caused by long-term changes in the North African climate cycle that alters the path of the North African Monsoon – usually southward. The cycle is caused by a 41000-year cycle in which the tilt of the earth changes between 22° and 24.5°. At present (2000 AD), we are in a dry period, but it is expected that the Sahara will become green again in 15000 years (17000 AD). When the North African monsoon is at its strongest annual precipitation and subsequent vegetation in the Sahara region increase, resulting in conditions commonly referred to as the "green Sahara". For a relatively weak North African monsoon, the opposite is true, with decreased annual precipitation and less vegetation resulting in a phase of the Sahara climate cycle known as the "desert Sahara".

The idea that changes in insolation (solar heating) caused by long-term changes in the Earth's orbit are a controlling factor for the long-term variations in the strength of monsoon patterns across the globe was first suggested by Rudolf Spitaler in the late nineteenth century, The hypothesis was later formally proposed and tested by the meteorologist John Kutzbach in 1981. Kutzbach's ideas about the impacts of insolation on global monsoonal patterns have become widely accepted today as the underlying driver of long term monsoonal cycles. Kutzbach never formally named his hypothesis and as such it is referred to here as the "Orbital Monsoon Hypothesis" as suggested by Ruddiman in 2001.

Sahel region of Mali
 
During the last glacial period, the Sahara was much larger than it is today, extending south beyond its current boundaries. The end of the glacial period brought more rain to the Sahara, from about 8000 BCE to 6000 BCE, perhaps because of low pressure areas over the collapsing ice sheets to the north. Once the ice sheets were gone, the northern Sahara dried out. In the southern Sahara, the drying trend was initially counteracted by the monsoon, which brought rain further north than it does today. By around 4200 BCE, however, the monsoon retreated south to approximately where it is today, leading to the gradual desertification of the Sahara. The Sahara is now as dry as it was about 13,000 years ago.

The Sahara pump theory describes this cycle. During periods of a wet or "Green Sahara", the Sahara becomes a savanna grassland and various flora and fauna become more common. Following inter-pluvial arid periods, the Sahara area then reverts to desert conditions and the flora and fauna are forced to retreat northwards to the Atlas Mountains, southwards into West Africa, or eastwards into the Nile Valley. This separates populations of some of the species in areas with different climates, forcing them to adapt, possibly giving rise to allopatric speciation.

It is also proposed that humans accelerated the drying out period from 6,000–2,500 BCE by pastoralists overgrazing available grassland.

Evidence for cycles

The growth of speleothems (which requires rainwater) was detected in Hol-Zakh, Ashalim, Even-Sid, Ma'ale-ha-Meyshar, Ktora Cracks, Nagev Tzavoa Cave, and elsewhere, and has allowed tracking of prehistoric rainfall. The Red Sea coastal route was extremely arid before 140 and after 115 kya. Slightly wetter conditions appear at 90–87 kya, but it still was just one tenth the rainfall around 125 kya. In the southern Negev Desert speleothems did not grow between 185–140 kya (MIS 6), 110–90 (MIS 5.4–5.2), nor after 85 kya nor during most of the interglacial period (MIS 5.1), the glacial period and Holocene. This suggests that the southern Negev was arid to hyper-arid in these periods.

During the Last Glacial Maximum (LGM) the Sahara desert was more extensive than it is now with the extent of the tropical forests being greatly reduced, and the lower temperatures reduced the strength of the Hadley Cell. This is a climate cell which causes rising tropical air of the Inter-Tropical Convergence Zone (ITCZ) to bring rain to the tropics, while dry descending air, at about 20 degrees north, flows back to the equator and brings desert conditions to this region. It is associated with high rates of wind-blown mineral dust, and these dust levels are found as expected in marine cores from the north tropical Atlantic. But around 12,500 BCE the amount of dust in the cores in the Bølling/Allerød phase suddenly plummets and shows a period of much wetter conditions in the Sahara, indicating a Dansgaard-Oeschger (DO) event (a sudden warming followed by a slower cooling of the climate). The moister Saharan conditions had begun about 12,500 BCE, with the extension of the ITCZ northward in the northern hemisphere summer, bringing moist wet conditions and a savanna climate to the Sahara, which (apart from a short dry spell associated with the Younger Dryas) peaked during the Holocene thermal maximum climatic phase at 4000 BCE when mid-latitude temperatures seem to have been between 2 and 3 degrees warmer than in the recent past. Analysis of Nile River deposited sediments in the delta also shows this period had a higher proportion of sediments coming from the Blue Nile, suggesting higher rainfall also in the Ethiopian Highlands. This was caused principally by a stronger monsoonal circulation throughout the sub-tropical regions, affecting India, Arabia and the Sahara. Lake Victoria only recently became the source of the White Nile and dried out almost completely around 15 kya.

The sudden subsequent movement of the ITCZ southwards with a Heinrich event (a sudden cooling followed by a slower warming), linked to changes with the El Niño-Southern Oscillation cycle, led to a rapid drying out of the Saharan and Arabian regions, which quickly became desert. This is linked to a marked decline in the scale of the Nile floods between 2700 and 2100 BCE.

Delayed-choice quantum eraser

From Wikipedia, the free encyclopedia https://en.wikipedia.org/wiki/Delayed-choice_quantum_eraser A delayed-cho...