Search This Blog

Sunday, June 9, 2019

Carbon footprint

From Wikipedia, the free encyclopedia

A carbon footprint is historically defined as the total emissions caused by an individual, event, organization, or product, expressed as carbon dioxide equivalent. Greenhouse gases (GHGs), including carbon dioxide, can be emitted through land clearance and the production and consumption of food, fuels, manufactured goods, materials, wood, roads, buildings, transportation and other services.

In most cases, the total carbon footprint cannot be exactly calculated because of inadequate knowledge of and data about the complex interactions between contributing processes, including the influence of natural processes that store or release carbon dioxide. For this reason, Wright, Kemp, and Williams, have suggested to define the carbon footprint as: 

A measure of the total amount of carbon dioxide (CO2) and methane (CH4) emissions of a defined population, system or activity, considering all relevant sources, sinks and storage within the spatial and temporal boundary of the population, system or activity of interest. Calculated as carbon dioxide equivalent using the relevant 100-year global warming potential (GWP100).
 
An artistic representation of a carbon footprint, shows a green, cartoon foot over a cartoon map of the world.
Visual representation of carbon footprint.
 
Most of the carbon footprint emissions for the average U.S. household come from "indirect" sources, e.g. fuel burned to produce goods far away from the final consumer. These are distinguished from emissions which come from burning fuel directly in one's car or stove, commonly referred to as "direct" sources of the consumer's carbon footprint.

The concept name of the carbon footprint originates from ecological footprint, discussion, which was developed by William E. Rees and Mathis Wackernagel in the 1990s. This accounting approach compares how much people demand compared to what the planet can renew. This allows to assess the number of "earths" that would be required if everyone on the planet consumed resources at the same level as the person calculating their ecological footprint. The carbon Footprint is one part of the ecological footprint. The carbon part was popularized by a large campaign of BP in 2005. In 2007, carbon footprint was used as a measure of carbon emissions to develop the energy plan for City of Lynnwood, Washington. Carbon footprints are more focused than ecological footprints since they measure merely emissions of gases that cause climate change into the atmosphere.

Carbon footprint is one of a family of footprint indicators, which also includes water footprint and land footprint.

Measuring carbon footprints

An individual's, nation's, or organization's carbon footprint can be measured by undertaking a GHG emissions assessment, a life cycle assessment, or other calculative activities denoted as carbon accounting. Once the size of a carbon footprint is known, a strategy can be devised to reduce it, e.g. by technological developments, energy efficiency improvements, better process and product management, changed Green Public or Private Procurement (GPP), carbon capture, consumption strategies, carbon offsetting and others.

For calculating personal carbon footprints, several free online carbon footprint calculators exist, including a few supported by publicly available peer-reviewed data and calculations including the University of California, Berkeley's CoolClimate Network research consortium and CarbonStory.These websites ask you to answer more or less detailed questions about your diet, transportation choices, home size, shopping and recreational activities, usage of electricity, heating, and heavy appliances such as dryers and refrigerators, and so on. The website then estimates your carbon footprint based on your answers to these questions. A systematic literature review was conducted to objectively determine the best way to calculate individual/household carbon footprints. This review identified 13 calculation principles and subsequently used the same principles to evaluate the 15 most popular online carbon footprint calculators. A recent study’s results by Carnegie Mellon's Christopher Weber found that the calculation of carbon footprints for products is often filled with large uncertainties. The variables of owning electronic goods such as the production, shipment, and previous technology used to make that product, can make it difficult to create an accurate carbon footprint. It is important to question, and address the accuracy of Carbon Footprint techniques, especially due to its overwhelming popularity.

Calculating the carbon footprint of an industry, product, or service is a complex task, as stated earlier. One tool industry uses is Life-cycle assessment (LCA), where carbon footprint may be one of many factors taken into consideration when assessing a product or service. The International Organization for Standardization has a standard called ISO 14040:2006 that has the framework for conducting an LCA study. Another method is through the Greenhouse Gas Protocol, a set of standards for tracking GHG emissions.

It should also be noted that predicting the carbon footprint of a process is also possible through estimations using the above standards. By using Emission intensities/Carbon intensities and the estimated annual use of a fuel, chemical, or other inputs, the carbon footprint can be estimated while a process is being planned/designed.

Direct carbon emissions

Direct carbon emissions come from sources that are directly from the site that is producing a product. These emissions can also be referred to as scope 1 and scope 2 emissions. 

Scope 1 emissions are emissions that are directly emitted from the site of the process or service. An example for industry would be the emissions related to burning a fuel on site. On the individual level, emissions from personal vehicles or gas burning stoves would fall under scope 1. 

Scope 2 emissions are the other emissions related to purchased electricity, heat, and/or steam used on site. In the US, the EPA has broken down electricity emission factors by state.

Indirect carbon emissions

Indirect carbon emissions are emissions from sources upstream or downstream from the process being studied, also known as scope 3 emissions.

Examples of upstream, indirect carbon emissions may include:
  • Transportation of materials/fuels
  • Any energy used outside of the production facility
  • Wastes produced outside of the production facility
Examples of downstream, indirect carbon emissions may include:
  • Any end-of-life process or treatments
  • Product and waste transportation
  • Emissions associated with selling the product

Ways to reduce personal carbon footprint

The most common way to reduce the carbon footprint of humans is to Reduce, Reuse, Recycle, Refuse

This can also be done by using reusable items such as thermoses for daily coffee or plastic containers for water and other cold beverages rather than disposable ones. If that option isn't available, it is best to properly recycle the disposable items after use. When one household recycles at least half of their household waste, they can save 1.2 tons of carbon dioxide annually.

Another easy option is to drive less. By walking or biking to the destination rather than driving, not only is a person going to save money on gas, but they will be burning less fuel and releasing fewer emissions into the atmosphere. However, if walking is not an option, one can look into carpooling or mass transportation options in their area. 

Yet another option for reducing the carbon footprint of humans is to use less air conditioning and heating in the home. By adding insulation to the walls and attic of one's home, and installing weather stripping or caulking around doors and windows one can lower their heating costs more than 25 percent. Similarly, one can very inexpensively upgrade the "insulation" (clothing) worn by residents of the home. For example, it's estimated that wearing a base layer of long underwear (top and bottom) made from a lightweight, super insulating fabric like microfleece (aka Polartec®, Capilene®) can conserve as much body heat as a full set of clothing, allowing a person to remain warm with the thermostat lowered by over 5 °C. These measures all help because they reduce the amount of energy needed to heat and cool the house. One can also turn down the heat while sleeping at night or away during the day, and keep temperatures moderate at all times. Setting the thermostat just 2 degrees lower in winter and higher in summer could save about 1 ton of carbon dioxide each year.

Another option is to stop having children, or at any rate to have fewer of them! World population has increased from three billion to nine billion in fifty years. Each of those nine billion people generate their own carbon footprint, small or large. Can we really afford to carry on expanding world population? If you think we shouldn't, you could do your part by having fewer, or no, children. 

Choice of diet is a major influence on a person's carbon footprint. Animal sources of protein (especially red meat), rice (typically produced in high methane-emitting paddies), foods transported long distance and/or via fuel-inefficient transport (e.g., highly perishable produce flown long distance) and heavily processed and packaged foods are among the major contributors to a high carbon diet. Scientists at the University of Chicago have estimated "that the average American diet – which derives 28% of its calories from animal foods – is responsible for approximately one and a half more tonnes of greenhouse gasses – as CO
2
equivalents – per person, per year than a fully plant-based, or vegan, diet." Their calculations suggest that even replacing one third of the animal protein in the average American's diet with plant protein (e.g., beans, grains) can reduce the diet's carbon footprint by half a tonne. Exchanging two thirds of the animal protein with plant protein is roughly equivalent to switching from a Toyota Camry to a Prius. Finally, throwing food out not only adds its associated carbon emissions to a person or household's footprint, it adds the emissions of transporting the wasted food to the garbage dump and the emissions of food decomposition, mostly in the form of the highly potent greenhouse gas, methane. 

The carbon handprint movement emphasizes individual forms of carbon offsetting, like using more public transportation or planting trees in deforested regions, to reduce one's carbon footprint and increase their "handprint."

Centre for Environment Education (CEE), Ahmedabad, India - a Centre of Excellence in Environmental Education has played a leading role in global efforts at strengthening the role of education in sustainable development over the years. The Handprint concepts signifying positive action and commitment towards Sustainability was launched at one of CEE's conferences “The 4th International Conference on Environmental Education”, in Ahmedabad, in 2007. The Handprint is being used around the world to strengthen action towards fulfillment of the UN SDGs. 

A July 2017 study published in Environmental Research Letters argued that the most significant way individuals could mitigate their own carbon footprint is to have one less child (58.6 tonnes CO2-equivalent per year), followed by living car-free (2.4 CO2-equivalent per year), forgoing air travel (1.6 CO2-equivalent per trans-Atlantic trip) and adopting a plant-based diet (0.8 CO2-equivalent per year). The study also found that most government resources on climate change focus on actions that have a relatively modest effect on greenhouse gas emissions, and concludes that "a US family who chooses to have one fewer child would provide the same level of emissions reductions as 684 teenagers who choose to adopt comprehensive recycling for the rest of their lives".

SDG Handprint Lab

SDG Handprint Lab of Centre for Environment Education (CEE) is an initiative that involves university students in direct Handprint action towards SDGs and targets through a unique pedagogy that makes them understand the complex and transdisciplinary nature of sustainable development in the context of local area sustainability issues. The programme builds a platform for discussion, and creates conditions for their active engagement and using their skills and knowledge to conduct research and executing Handprint activities. Exploring the themes of the SDGs is an excellent way to get the students to link their education and skill with real life problems in the wider community and environment.

Ways to reduce industry's carbon footprint

A product, service, or company’s carbon footprint can be affected by several factors including, but not limited to:
  • Energy sources
  • Offsite electricity generation
  • Materials
These factors can also change with location or industry. However, there are some general steps that can be taken to reduce carbon footprint on a larger scale. 

In 2016, the EIA reported that in the US electricity is responsible for roughly 37% of Carbon Dioxide emissions, making it a potential target for reductions. Possibly the cheapest way to do this is through energy efficiency improvements. The ACEEE reported that energy efficiency has the potential to save the US over 800 billion kWh per year, based on 2015 data. Some potential options to increase energy efficiency include, but are not limited to:
  • Waste heat recovery systems
  • Insulation for large buildings and combustion chambers
  • Technology upgrades, ie different light sources, lower consumption machines
Carbon Footprints from energy consumption can be reduced through the development of alternative energy projects, such as solar and wind energy, which are renewable resources. 

Reforestation, the restocking of existing forests or woodlands that have previously been depleted, is an example of Carbon Offsetting, the counteracting of carbon dioxide emissions with an equivalent reduction of carbon dioxide in the atmosphere. Carbon offsetting can reduce a companies overall carbon footprint by offering a carbon credit

A life cycle or supply chain carbon footprint study can provide useful data which will help the business to identify specific and critical areas for improvement. By calculating or predicting a process’ carbon footprint high emissions areas can be identified and steps can be taken to reduce in those areas.

Schemes to reduce carbon emissions: Kyoto Protocol, carbon offsetting, and certificates

Carbon dioxide emissions into the atmosphere, and the emissions of other GHGs, are often associated with the burning of fossil fuels, like natural gas, crude oil and coal. While this is harmful to the environment, carbon offsets can be purchased in an attempt to make up for these harmful effects.

The Kyoto Protocol defines legally binding targets and timetables for cutting the GHG emissions of industrialized countries that ratified the Kyoto Protocol. Accordingly, from an economic or market perspective, one has to distinguish between a mandatory market and a voluntary market. Typical for both markets is the trade with emission certificates:

Mandatory market mechanisms

To reach the goals defined in the Kyoto Protocol, with the least economical costs, the following flexible mechanisms were introduced for the mandatory market:
The CDM and JI mechanisms requirements for projects which create a supply of emission reduction instruments, while Emissions Trading allows those instruments to be sold on international markets.

- Projects which are compliant with the requirements of the CDM mechanism generate Certified Emissions Reductions (CERs).

- Projects which are compliant with the requirements of the JI mechanism generate Emission Reduction Units (ERUs).

The CERs and ERUs can then be sold through Emissions Trading. The demand for the CERs and ERUs being traded is driven by: 

- Shortfalls in national emission reduction obligations under the Kyoto Protocol.

- Shortfalls amongst entities obligated under local emissions reduction schemes. 

Nations which have failed to deliver their Kyoto emissions reductions obligations can enter Emissions Trading to purchase CERs and ERUs to cover their treaty shortfalls. Nations and groups of nations can also create local emission reduction schemes which place mandatory carbon dioxide emission targets on entities within their national boundaries. If the rules of a scheme allow, the obligated entities may be able to cover all or some of any reduction shortfalls by purchasing CERs and ERUs through Emissions Trading. While local emissions reduction schemes have no status under the Kyoto Protocol itself, they play a prominent role in creating the demand for CERs and ERUs, stimulating Emissions Trading and setting a market price for emissions.

A well-known mandatory local emissions trading scheme is the EU Emissions Trading Scheme (EU ETS). 

New changes are being made to the trading schemes. The EU Emissions Trading Scheme is set to make some new changes within the next year. The new changes will target the emissions produced by flight travel in and out of the European Union.

Other nations are scheduled to start participating in Emissions Trading Schemes within the next few year. These nations include China, India and the United States.

Voluntary market mechanisms

In contrast to the strict rules set out for the mandatory market, the voluntary market provides companies with different options to acquire emissions reductions. A solution, comparable with those developed for the mandatory market, has been developed for the voluntary market, the Verified Emission Reductions (VER). This measure has the great advantage that the projects/activities are managed according to the quality standards set out for CDM/JI projects but the certificates provided are not registered by the governments of the host countries or the Executive Board of the UNO. As such, high quality VERs can be acquired at lower costs for the same project quality. However, at present VERs can not be used in the mandatory market.

The voluntary market in North America is divided between members of the Chicago Climate Exchange and the Over The Counter (OTC) market. The Chicago Climate Exchange is a voluntary yet legally binding cap-and-trade emission scheme whereby members commit to the capped emission reductions and must purchase allowances from other members or offset excess emissions. The OTC market does not involve a legally binding scheme and a wide array of buyers from the public and private spheres, as well as special events that want to go carbon neutral. Being carbon neutral refers to achieving net zero carbon emissions by balancing a measured amount of carbon released with an equivalent amount sequestered or offset, or buying enough carbon credits to make up the difference.

There are project developers, wholesalers, brokers, and retailers, as well as carbon funds, in the voluntary market. Some businesses and nonprofits in the voluntary market encompass more than just one of the activities listed above. A report by Ecosystem Marketplace shows that carbon offset prices increase as it moves along the supply chain—from project developer to retailer.

While some mandatory emission reduction schemes exclude forest projects, these projects flourish in the voluntary markets. A major criticism concerns the imprecise nature of GHG sequestration quantification methodologies for forestry projects. However, others note the community co-benefits that forestry projects foster. Project types in the voluntary market range from avoided deforestation, afforestation/reforestation, industrial gas sequestration, increased energy efficiency, fuel switching, methane capture from coal plants and livestock, and even renewable energy. Renewable Energy Certificates (RECs) sold on the voluntary market are quite controversial due to additionality concerns. Industrial Gas projects receive criticism because such projects only apply to large industrial plants that already have high fixed costs. Siphoning off industrial gas for sequestration is considered picking the low hanging fruit; which is why credits generated from industrial gas projects are the cheapest in the voluntary market.

The size and activity of the voluntary carbon market is difficult to measure. The most comprehensive report on the voluntary carbon markets to date was released by Ecosystem Marketplace and New Carbon Finance in July 2007.

ÆON of Japan is firstly approved by Japanese authority to indicate carbon footprint on three private brand goods in October 2009.

Average carbon footprint per person by country

According to The World Bank, the global average carbon footprint in 2014 was 4.97 metric tons CO2/cap. The EU average for 2007 was about 13.8 tons CO2e/cap, whereas for the U.S., Luxembourg and Australia it was over 25 tons CO2e/cap. In 2017, the average for the USA was about 20 metric tons CO2e.

Mobility (driving, flying & small amount from public transit), shelter (electricity, heating, construction) and food are the most important consumption categories determining the carbon footprint of a person. In the EU, the carbon footprint of mobility is evenly split between direct emissions (e.g. from driving private cars) and emissions embodied in purchased products related to mobility (air transport service, emissions occurring during the production of cars and during the extraction of fuel).

The carbon footprint of U.S. households is about 5 times greater than the global average. For most U.S. households the single most important action to reduce their carbon footprint is driving less or switching to a more efficient vehicle.

The carbon footprints of energy

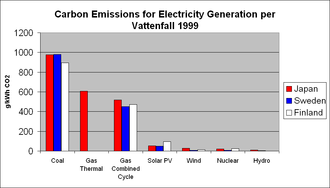
The following table compares, from peer-reviewed studies of full life cycle emissions and from various other studies, the carbon footprint of various forms of energy generation: nuclear, hydro, coal, gas, solar cell, peat and wind generation technology. 

The Vattenfall study found renewable and nuclear generation responsible for far less CO
2
than fossil fuel generation.
 
Emission factors of common fuels
Fuel/
resource
Thermal
(g[CO2-eq]/MJth)
Energy intensity
(Jth/Je)
Electric
(g[CO2-eq]/kW·he)
Coal B 91.50–91.72 2.62–2.85 863–941
Br 94.33 3.46 1,175

88 3.01 955
Oil 73 3.40 893
Natural gas cc 68.20 577
oc 68.4 751


599
Geothermal
power
TL 3~ 0–1
TW 91–122
Uranium
Nuclear power
WL N/A 0.18 60
WL 0.20 65
Hydroelectricity (run of river) N/A 0.046 15
Conc. solar power

40±15
Photovoltaics
0.33 106
Wind power
0.066 21
Note: 3.6 megajoules (MJ) = 1 kilowatt-hour (kW·h), thus 1 g/MJ = 3.6 g/kW·h.
B
Black coal (supercritical)–(new subcritical)
Br
Brown coal (new subcritical)
cc
combined cycle
oc
open cycle
TL
Low-temperature/closed-circuit (geothermal doublet)
TH
High-temperature/open-circuit
WL
Light water reactors
WH
Heavy water reactors, estimate.
These three studies thus concluded that hydroelectric, wind, and nuclear power produced the least CO2 per kilowatt-hour of any other electricity sources. These figures do not allow for emissions due to accidents or terrorism. Wind power and solar power, emit no carbon from the operation, but do leave a footprint during construction phase and maintenance during operation. Hydropower from reservoirs also has large footprints from initial removal of vegetation and ongoing methane (stream detritus decays anaerobically to methane in bottom of reservoir, rather than aerobically to CO2 if it had stayed in an unrestricted stream).

The table above gives the carbon footprint per kilowatt-hour of electricity generated, which is about half the world's man-made CO2 output. The CO2 footprint for heat is equally significant and research shows that using waste heat from power generation in combined heat and power district heating, chp/dh has the lowest carbon footprint, much lower than micro-power or heat pumps.

Coal production has been refined to greatly reduce carbon emissions; since the 1980s, the amount of energy used to produce a ton of steel has decreased by 50%.

Passenger transport

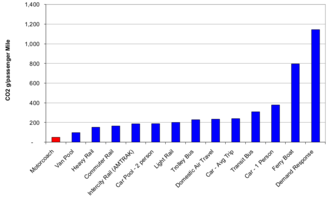
Average carbon dioxide emissions (grams) per passenger mile (USA). Based on 'Updated Comparison of Energy Use & CO
2
Emissions From Different Transportation Modes, October 2008' (Manchester, NH: M.J. Bradley & Associates, 2008), p. 4, table 1.1
 
This section gives representative figures for the carbon footprint of the fuel burned by different transport types (not including the carbon footprints of the vehicles or related infrastructure themselves). The precise figures vary according to a wide range of factors.

Flight

Some representative figures for CO2 emissions are provided by LIPASTO's survey of average direct emissions (not accounting for high-altitude radiative effects) of airliners expressed as CO2 and CO2 equivalent per passenger kilometre:
  • Domestic, short distance, less than 463 km (288 mi): 257 g/km CO2 or 259 g/km (14.7 oz/mile) CO2e
  • Long distance flights: 113 g/km CO2 or 114 g/km (6.5 oz/mile) CO2e
However, emissions per unit distance travelled is not necessarily the best indicator for the carbon footprint of air travel, because the distances covered are commonly longer than by other modes of travel. It is the total emissions for a trip that matters for a carbon footprint, not the merely rate of emissions. For example, a greatly more distant holiday destination may be chosen than if another mode of travel were used, because air travel makes the longer distance feasible in the limited time available.

Road

CO2 emissions per passenger-kilometre (pkm) for all road travel for 2011 in Europe as provided by the European Environment Agency:
  • 109 g/km CO2 (Figure 2)
For vehicles, average figures for CO2 emissions per kilometer for road travel for 2013 in Europe, normalized to the NEDC test cycle, are provided by the International Council on Clean Transportation:
Average figures for the United States are provided by the US Environmental Protection Agency, based on the EPA Federal Test Procedure, for the following categories:
  • Passenger cars: 200 g CO2/km (322 g/mi)
  • Trucks: 280 g CO2/km (450 g/mi)
  • Combined: 229 g CO2/km (369 g/mi)

Rail

In 2005, the US company Amtrak's carbon dioxide equivalent emissions per passenger kilometre were 0.116 kg, about twice as high as the UK rail average (where much more of the system is electrified), and about eight times a Finnish electric intercity train.

Sea

Average carbon dioxide emissions by ferries per passenger-kilometre seem to be 0.12 kg (4.2 oz). However, 18-knot ferries between Finland and Sweden produce 0.221 kg (7.8 oz) of CO2, with total emissions equalling a CO2 equivalent of 0.223 kg (7.9 oz), while 24–27-knot ferries between Finland and Estonia produce 0.396 kg (14.0 oz) of CO2 with total emissions equalling a CO2 equivalent of 0.4 kg (14 oz).

The carbon footprints of products

Several organizations offer footprint calculators for public and corporate use, and several organizations have calculated carbon footprints of products. The US Environmental Protection Agency has addressed paper, plastic (candy wrappers), glass, cans, computers, carpet and tires. Australia has addressed lumber and other building materials. Academics in Australia, Korea and the US have addressed paved roads. Companies, nonprofits and academics have addressed mailing letters and packages. Carnegie Mellon University has estimated the CO2 footprints of 46 large sectors of the economy in each of eight countries. Carnegie Mellon, Sweden and the Carbon Trust have addressed foods at home and in restaurants. 

The Carbon Trust has worked with UK manufacturers on foods, shirts and detergents, introducing a CO2 label in March 2007. The label is intended to comply with a new British Publicly Available Specification (i.e. not a standard), PAS 2050, and is being actively piloted by The Carbon Trust and various industrial partners. As of August 2012 The Carbon Trust state they have measured 27,000 certifiable product carbon footprints.

Evaluating the package of some products is key to figuring out the carbon footprint. The key way to determine a carbon footprint is to look at the materials used to make the item. For example, a juice carton is made of an aseptic carton, a beer can is made of aluminum, and some water bottles either made of glass or plastic. The larger the size, the larger the footprint will be.

Food

In a 2014 study by Scarborough et al., the real-life diets of British people were surveyed and their dietary greenhouse gas footprints estimated. Average dietary greenhouse-gas emissions per day (in kilograms of carbon dioxide equivalent) were:
  • 7.19 for high meat-eaters
  • 5.63 for medium meat-eaters
  • 4.67 for low meat-eaters
  • 3.91 for fish-eaters
  • 3.81 for vegetarians
  • 2.89 for vegans

Textiles

The precise carbon footprint of different textiles varies considerably according to a wide range of factors. However, studies of textile production in Europe suggest the following carbon dioxide equivalent emissions footprints per kilo of textile at the point of purchase by a consumer:
  • Cotton: 8
  • Nylon: 5.43
  • PET (e.g. synthetic fleece): 5.55
  • Wool: 5.48
Accounting for durability and energy required to wash and dry textile products, synthetic fabrics generally have a substantially lower carbon footprint than natural ones.

Materials

The carbon footprint of materials (also known as embodied carbon) varies widely. The carbon footprint of many common materials can be found in the Inventory of Carbon & Energy database, the GREET databases and models, and LCA databases via openLCA Nexus.

Cement

Cement production and carbon footprint resulting from soil sealing was 8.0 Mg person−1 of total per capita CO2 emissions (Italy, year 2003); the balance between C loss due to soil sealing and C stocked in man-made infrastructures resulted in a net loss to the atmosphere, -0.6 Mg C ha−1 y−1.

Biomass

From Wikipedia, the free encyclopedia

Biomass is plant or animal material used for energy production, heat production, or in various industrial processes as raw material for a range of products. It can be purposely grown energy crops (e.g. miscanthus, switchgrass), wood or forest residues, waste from food crops (wheat straw, bagasse), horticulture (yard waste), food processing (corn cobs), animal farming (manure, rich in nitrogen and phosphorus), or human waste from sewage plants.

Burning plant-derived biomass releases CO2, but it has still been classified as a renewable energy source in the EU and UN legal frameworks because photosynthesis cycles the CO2 back into new crops. In some cases, this recycling of CO2 from plants to atmosphere and back into plants can even be CO2 negative, as a relatively large portion of the CO2 is moved to the soil during each cycle.

Cofiring with biomass has increased in coal power plants, because it makes it possible to release less CO2 without the cost associated with building new infrastructure. Co-firing is not without issues however, often an upgrade of the biomass is beneficiary. Upgrading to higher grade fuels can be achieved by different methods, broadly classified as thermal, chemical, or biochemical (see below).
IUPAC definition.
 
Biomass: Material produced by the growth of microorganisms, plants or animals.

Biomass feedstocks

Biomass plant in Scotland.
 
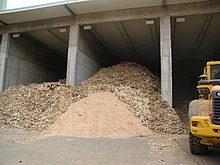
Wood waste outside biomass power plant.
 
Bagasse is the remaining waste after sugar canes have been crushed to extract their juice.
 
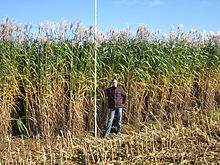
Miscanthus x giganteus energy crop, Germany.
 
Historically, humans have harnessed biomass-derived energy since the time when people began burning wood fuel. Even in 2019, biomass is the only source of fuel for domestic use in many developing countries. All biomass is biologically-produced matter based in carbon, hydrogen and oxygen. The estimated biomass production in the world is approximately 100 billion metric tons of carbon per year, about half in the ocean and half on land.

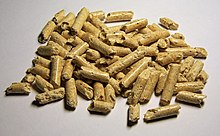
Wood and residues from wood, for instance spruce, birch, eucalyptus, willow, oil palm, remains the largest biomass energy source today. It is used directly as a fuel or processed into pellet fuel or other forms of fuels. Biomass also includes plant or animal matter that can be converted into fuel, fibers or industrial chemicals. There are numerous types of plants, including corn, switchgrass, miscanthus, hemp, sorghum, sugarcane, and bamboo. The main waste energy feedstocks are wood waste, agricultural waste, municipal solid waste, manufacturing waste, and landfill gas. Sewage sludge is another source of biomass. There is ongoing research involving algae or algae-derived biomass. Other biomass feedstocks are enzymes or bacteria from various sources, grown in cell cultures or hydroponics.

Based on the source of biomass, biofuels are classified broadly into two major categories: 

First-generation biofuels are derived from food sources, such as sugarcane and corn starch. Sugars present in this biomass are fermented to produce bioethanol, an alcohol fuel which serve as an additive to gasoline, or in a fuel cell to produce electricity.

Second-generation biofuels utilize non-food-based biomass sources such as perennial energy crops (low input crops), and agricultural/municipal waste. There is huge potential for second generation biofuels but the resources are currently under-utilized.

Biomass conversion

Thermal conversions

Straw bales
 
Thermal conversion processes use heat as the dominant mechanism to upgrade biomass into a better and more practical fuel. The basic alternatives are torrefaction, pyrolysis, and gasification, these are separated principally by the extent to which the chemical reactions involved are allowed to proceed (mainly controlled by the availability of oxygen and conversion temperature).

There are other less common, more experimental or proprietary thermal processes that may offer benefits, such as hydrothermal upgrading. Some have been developed for use on high moisture content biomass, including aqueous slurries, and allow them to be converted into more convenient forms.

Chemical conversion

A range of chemical processes may be used to convert biomass into other forms, such as to produce a fuel that is more practical to store, transport and use, or to exploit some property of the process itself. Many of these processes are based in large part on similar coal-based processes, such as the Fischer-Tropsch synthesis. Biomass can be converted into multiple commodity chemicals.

Biochemical conversion

As biomass is a natural material, many highly efficient biochemical processes have developed in nature to break down the molecules of which biomass is composed, and many of these biochemical conversion processes can be harnessed. In most cases, microorganisms are used to perform the conversion process: anaerobic digestion, fermentation, and composting.

Glycoside hydrolases are the enzymes involved in the degradation of the major fraction of biomass, such as polysaccharides present in starch and lignocellulose. Thermostable variants are gaining increasing roles as catalysts in biorefining applications, since recalcitrant biomass often needs thermal treatment for more efficient degradation.

Electrochemical conversion

Biomass can be directly converted to electrical energy via electrochemical (electrocatalytic) oxidation of the material. This can be performed directly in a direct carbon fuel cell, direct liquid fuel cells such as direct ethanol fuel cell, a direct methanol fuel cell, a direct formic acid fuel cell, a L-ascorbic Acid Fuel Cell (vitamin C fuel cell), and a microbial fuel cell. The fuel can also be consumed indirectly via a fuel cell system containing a reformer which converts the biomass into a mixture of CO and H2 before it is consumed in the fuel cell.

Environmental impact

On combustion, the carbon from biomass is released into the atmosphere as carbon dioxide (CO2). After a period of time ranging from a few months to decades, the CO2 produced from combustion is absorbed from the atmosphere by plants or trees. However, the carbon storage capacity of forests may be reduced overall if destructive forestry techniques are employed.

All biomass crops sequester carbon. For example, soil organic carbon has been observed to be greater below switchgrass crops than under cultivated cropland, especially at depths below 30 cm (12 in). For Miscanthus x giganteus, McCalmont et al. found accumulation rates ranging from 0.42 to 3.8 tonnes per hectare per year,  with a mean accumulation rate of 1.84 tonne (0.74 tonnes per acre per year), or 20% of total harvested carbon per year.  The grass sequesters carbon in its continually increasing root biomass, toghether with carbon input from fallen leaves. Typically, perennial crops sequester more carbon than annual crops because the root buildup is allowed to continue undisturbed over many years. Also, perennial crops avoid the yearly tillage procedures (plowing, digging) associated with growing annual crops. Tilling induces soil aeration, which accelerates the soil carbon decomposition rate, by stimulating soil microbe populations. Also, tilling makes it easier for the oxygen (O) atoms in the atmosphere to attach to carbon (C) atoms in the soil, producing CO2).

GHG / CO2 / carbon negativity for Miscanthus x giganteus production pathways.
 
Relationship between above-ground yield (diagonal lines), soil organic carbon (X axis), and soil's potential for successful/unsuccessful carbon sequestration (Y axis). Basically, the higher the yield, the more land is usable as a GHG mitigation tool (including relatively carbon rich land.)
 
The simple proposal that biomass is carbon-neutral put forward in the early 1990s has been superseded by the more nuanced proposal that for a particular bioenergy project to be carbon neutral, the total carbon sequestered by a bioenergy crop's root system must compensate for all the emissions from the related, aboveground bioenergy project. This includes any emissions caused by direct or indirect land use change. Many first generation bioenergy projects are not carbon neutral given these demands. Some have even higher total GHG emissions than some fossil based alternatives. Transport fuels might be worse than solid fuels in this regard. 

Some are carbon neutral or even negative, though, especially perennial crops. The amount of carbon sequestrated and the amount of GHG (greenhouse gases) emitted will determine if the total GHG life cycle cost of a bio-energy project is positive, neutral or negative. Whitaker et al. estimates that for Miscanthus x giganteus, GHG neutrality and even negativity is within reach. A carbon negative life cycle is possible if the total below-ground carbon accumulation more than compensates for the above-ground total life-cycle GHG emissions. 

The graphic on the right displays two CO2 negative Miscanthus x giganteus production pathways, represented in gram CO2-equivalents per megajoule. The yellow diamonds represent mean values.  Successful sequestration is dependent on planting sites, as the best soils for sequestration are those that are currently low in carbon. The varied results displayed in the graph highlights this fact.  For the UK, successful sequestration is expected for arable land over most of England and Wales, with unsuccessful sequestration expected in parts of Scotland, due to already carbon rich soils (existing woodland) plus lower yields. Soils already rich in carbon includes peatland and mature forest. Grassland can also be carbon rich, however Milner et al. argues that the most successful carbon sequestration in the UK takes place below improved grasslands.  The bottom graphic displays the estimated yield necessary to compensate for the disturbance caused by planting plus lifecycle GHG-emissions for the related above-ground operation.

Forest-based biomass projects has received criticism for ineffective GHG mitigation from a number of environmental organizations, including Greenpeace and the Natural Resources Defense Council. Environmental groups also argue that it might take decades for the carbon released by burning biomass to be recaptured by new trees. Biomass burning produces air pollution in the form of carbon monoxide, volatile organic compounds, particulates and other pollutants. In 2009 a Swedish study of the giant brown haze that periodically covers large areas in South Asia determined that two thirds of it had been principally produced by residential cooking and agricultural burning, and one third by fossil-fuel burning. The use of wood biomass as an industrial fuel has been shown to produce fewer particulates and other pollutants than the burning seen in wildfires or open field fires.

Renewable energy in Africa

From Wikipedia, the free encyclopedia

Global Horizontal Irradiation in Sub-Saharan Africa.
 
The developing nations of Africa are popular locations for the application of renewable energy technology. Currently, many nations already have small-scale solar, wind, and geothermal devices in operation providing energy to urban and rural populations. These types of energy production are especially useful in remote locations because of the excessive cost of transporting electricity from large-scale power plants. The applications of renewable energy technology has the potential to alleviate many of the problems that face Africans every day, especially if done in a sustainable manner that prioritizes human rights. 

Access to energy is essential for the reduction of poverty and promotion of economic growth. Communication technologies, education, industrialization, agricultural improvement and expansion of municipal water systems all require abundant, reliable, and cost-effective energy access.

Avoiding fossil fuels

By investing in the long-term energy solutions that alternative energy sources afford, most African nations would benefit significantly in the longer term by avoiding the pending economic problems developed countries are currently facing. 

Although in many ways fossil fuels provide a simple, easy to use energy source that powered the industrialization of most modern nations, the issues associated with the widespread use of fossil fuels are now numerous, consisting of some of the world's most difficult and large-scale global political, economic, health and environmental problems. The looming energy crisis results from consuming these fossil fuels at a rate which is unsustainable, with the global demand for fossil fuels expected to increase every year for the next several decades, compounding existing problems.

While a great number of projects are currently underway to expand and connect the existing grid networks, too many problems exist to make this a realistic option for the vast majority of people in Africa, especially those who live in rural locations. Distributed generation using renewable energy systems is the only practical solution to meet rural electrification needs. There is a move towards energy decentralization in African nations, with many looking towards variants of energy decentralization frameworks, such as District Energy Officers, for example as described in a recommendations paper for District Energy Officers for the country of Malawi.

Renewable energy resources

Hydro-electric, wind and solar power all derive their energy from the Sun. The Sun emits more energy in one second (3.827 × 1026 J) than is available in all of the fossil fuels present on earth (3.9 × 10²² J), and therefore has the potential to provide all of our current and future global energy requirements. Since the solar source for renewable energy is clean and free, African nations can protect their people, their environment, and their future economic development by using renewable energy sources To this end they have a number of possible options.

Solar resources

World map of global solar horizontal irradiation 
 
Africa is the sunniest continent on Earth, especially as there are many perpetually sunny areas like the huge Sahara Desert. It has much greater solar resources than any other continent. Desert regions stand up as the most sunshiny while rain forests are considerably cloudier but still get a good global solar irradiation because of the proximity with the equator. 

The distribution of solar resources across Africa is fairly uniform, with more than 85% of the continent's landscape receiving at least 2,000 kWh/(m² year). A recent study indicates that a solar generating facility covering just 0.3% of the area comprising North Africa could supply all of the energy required by the European Union. This is the same land area as the state of Maine.

Wave and wind resources

World map of wind power density. 
 
Africa has a large coastline, where wind power and wave power resources are abundant and underutilized in the north and south. Geothermal power has potential to provide considerable amounts of energy in many eastern African nations.

Wind is far less uniformly distributed than solar resources, with optimal locations positioned near special topographical funneling features close to coastal locations, mountain ranges, and other natural channels in the north and south. The availability of wind on the western coast of Africa is substantial, exceeding 3,750 kW·h, and will accommodate the future prospect for energy demands Central Africa has lower than average wind resources to work with.

Geothermal resources

The Rift Valley near Eldoret, Kenya
 
Geothermal power is mostly concentrated in eastern Africa, but there are many fragmented spots of high intensity geothermal potential spread across the continent. There is enormous potential for geothermal energy in the East African Rift which is roughly 5,900 kilometers in length and spans several countries in East Africa including Eritrea, Ethiopia, Djibouti, Kenya, Uganda, and Zambia.

Biomass

The use of biomass fuels endangers biodiversity and risks further damaged or destruction to the landscape. 86% of Africa’s biomass energy is used in the sub-Saharan region, excluding South Africa. Even where other forms of energy are available, it is not harnessed and utilized efficiently, underscoring the need to promote energy efficiency where energy access is available.

There is, however, an urgent need to address the current levels of respiratory illness from burning biomass in the home. Taking into respect the cost differential between the biomass and fossil fuels, it is far more cost-effective to improve the technology used to burn the biomass than to use fossil fuels.

Horizontal integration potential

Solar and wind power are extremely scalable, as there are systems available from less than 1 watt to several megawatts. This makes it possible to initialize the electrification of a home or village with minimal initial capital. It also allows for dynamic and incremental scaling as load demands increases. The component configuration of a wind or solar installation also provides a level of functional redundancy, improving the reliability of the system. If a single panel in a multi-panel solar array is damaged, the rest of the system continues functioning unimpeded. In a similar way, the failure of a single wind tower in a multi-tower configuration does not cause a system-level failure. 

Because solar and wind projects produce power where it is used, they provide a safe, reliable and cost-effective solution. Because transmission equipment is avoided, these systems are more secure, and less vulnerable to attack. This can be an important feature in regions prone to conflict. Wind and solar power systems are simple to set up, easy to operate, easy to repair, and durable. Wind resources and solar resource are abundant enough to provide all of the electrical energy requirements of rural populations, and this can be done in remote and otherwise fragmented low-density areas that are impractical to address using conventional grid-based systems.

Finance

Photo-voltaic panels, wind turbines deep cycle batteries, meters, sockets cables, and connectors are all expensive. Even when the relative difference in buying power, materials cost, opportunity cost, labor cost and overhead is factored in, renewable energy will remain expensive for people who are living on less than US$1 per day. Many rural electrification projects in the past use government subsidies to finance the implementation of rural development programs. It is difficult for rural electrification projects to be accomplished by for-profit companies; in economically impoverished areas these programs must be run at a loss for reasons of practicality. There are several theorized ways in which specific African nations can rally the resources for such projects.

Potential funding sources

European countries that consume oil refined from African countries have the opportunity to subsidize the costs of individual level, village level, or community level alternative energy systems through emissions trading credits. It has been proposed that for every unit of African origin carbon consumed by the European market, a predetermined amount green credits or carbon credits would be yielded. The European partners could then either supply parts, components, or systems directly, an equivalent amount of investment capital, or lend credits to finance the distribution of renewable energy services, knowledge or equipment.

International relief targeted at poverty reduction could also be redirected towards subsidizing renewable energy projects. Because of the integral role that electrification plays in supporting economic and social development, funding of rural electrification can be seen as the core method for addressing poverty. Radios, televisions, telephones, computer networks, and computers all rely on an access to electricity. Because information services allow for the proliferation of education resources, funding the electric backbone to such systems has a derivative effect on their development. In this way, access to communications and education plays a major role in reducing poverty. Additionally, international efforts that supply equipment and services rather than money, are more resistant to resource misappropriation issue that pose problems in less stable governments.

UNEP has developed a loan program to stimulate renewable energy market forces with attractive return rates, buffer initial deployment costs and entice consumers to consider and purchase renewable technology. After a successful solar loan program sponsored by UNEP that helped 100,000 people finance solar power systems in developing countries like India, UNEP started similar schemes in other parts of the developing world like Africa - Tunisia, Morocco, and Kenya projects are already functional and many projects in other African nations are in the pipeline. In Africa, UNEP assistance to Ghana, Kenya, and Namibia has resulted in the adoption of draft National Climate Awareness Plans, publications in local languages, radio programs and seminars. The Rural Energy Enterprise Development (REED) initiative is another flagship UNEP effort focused on enterprise development and seed financing for clean energy entrepreneurs in developing countries of West and Southern Africa.

The Government of South Africa has set up the South African Renewables Initiative (SARi) to develop a financing arrangement that would enable a critical mass of renewables to be developed in South Africa, through a combination of international loans and grants, as well as domestic funding. This has been a highly successful program now known as the REIPPP (Renewable Energy Independent Power Producer Program) with four rounds of allocations already completed. In Round 1, 19 projects were allocated, in Round 2, 28 projects were allocated, in Round 3, 17 projects were allocated and in Round 4, 26 projects were allocated. Over 6100MW has been allocated with a total of R194 billion (US$16 billion) being invested in this program. It is important to note that this investment figure represents full funding from private entities and banks - there are no government subsidies for this program.

Energy sector regulators as facilitators

The funding of renewable energy (RE) projects is dependent on the credibility of the institutions developing and implementing RE policy. This places a particular burden on the energy regulators in Africa, whose professional staff may be few in number and who have track records of only a decade or so. Rules (micro policies) made by regulators are subsidiary to overall government RE policy and depend on some delegation of authority from the state. Nevertheless, there are instances when the sector regulator can pro-active on behalf of customer and utility concerns—providing facts, reports, and public statements that build a case for care in the design of public policy towards RE. Clean and renewable energy is likely to be of concern to a number of organizations. Interaction between multiple authorities requires coordination to align policies, incentives, and administrative processes (including licensing and permitting). Of course, the making of policy by regulators is incidental to and inherent in their duty to decide specific cases or disputes. This micro policy-making role is derived from the fact that macro RE policy cannot reasonably be expected to anticipate all aspects of policy that will have to evolve for the regulatory process to be fully functional. This point is particularly important in the area of renewable energy, with its rapidly changing technologies and ever-changing public (and political) attitudes. Gaps will have to be filled and it is the regulators, with their functional responsibilities, technical expertise, and hands-on experience that are best positioned to accomplish that task in developing countries. Thus, for designing auctions for purchasing power, for establishing feed-in tariffs, or other instruments promoting RE, the energy sector regulator has a significant impact on the penetration of RE in Africa and other regions.

Renewable energy use

Solar power

Global Horizontal Irradiation in Sub-Saharan Africa. 

Several large-scale solar power facilities are under development in Africa including projects in South Africa and Algeria. Although solar power technology has the potential to supply energy to large numbers of people, and has been used to generate power on a large scale in developed nations, its greatest potential in Africa may be to provide power on a smaller scale and to use this energy to help with day-to-day needs such as small-scale electrification, desalination, water pumping, and water purification

The first utility-scale solar farm in Sub-Saharan Africa is the 8.5MW plant at Agahozo-Shalom Youth Village, in the Rwamagana District, Eastern Province of Rwanda. It leased 20 hectares (49 acres) of land from the village which is a charity to house and educate Rwandan genocide victims. The plant uses 28,360 photovoltaic panels and produces 6% of total electrical supply of the country. The project was built with U.S., Israeli, Dutch, Norwegian, Finnish and UK funding and expertise.

There are several examples of small grid-linked solar power stations in Africa, including the photovoltaic 250 kW Kigali Solaire station in Rwanda. Under the South Africa Renewable Energy Independent Power Producer Procurement Program, several projects have been developed, including the 96MW(DC) Jasper Solar Energy Project, the 75MW(DC) Lesedi PV project, and the 75MW(DC) Letsatsi PV Project, all developed by the American company SolarReserve and completed in 2014. 

Power Up Gambia, a non-profit operating in The Gambia, uses solar power technology to provide power to Gambian health care facilities, providing a reliable source of electricity for lighting, diagnostic testing, treatments, and water pumping. Energy For Opportunity (EFO), a non-profit working in West Africa, uses solar power for Schools, Health Clinics and Community Charging Stations, as well as teaches Photovoltaic installation classes at local technical institutes. So far its work has been mainly in Sierra Leone. In particular its solar powered Community Charging Stations have been recognized as an innovative model to provide electricity to rural communities in the region.

Some plans exist to build solar farms in the deserts of North Africa to supply power for Europe. The Desertec project, backed by several European energy companies and banks, planned to generate renewable electricity in the Sahara desert and distribute it through a high-voltage grid for export to Europe and local consumption in North-Africa. Ambitions seek to provide continental Europe with up to 15% of its electricity. The TuNur project would supply 2GW of solar generated electricity from Tunisia to the UK.

Solar water pumping

One of the most immediate and lethal problems facing many third world countries is the availability of clean drinking water. Solar powered technologies can help alleviate this problem with minimal cost using a combination of solar powered well pumping, a water tower or other holding tank, and a solar powered water purifier. These technologies require minimal maintenance, have low operational costs, and once set up, will help provide clean water for drinking and agriculture. With large enough reservoirs for the water that has been pumped and purified with solar powered technology, a community will be better able to withstand drought or famine. This reservoir water could be consumed by humans, livestock, or used to irrigate community gardens and fields, thus improving crop yields and community health. A solar powered water purification system can be used to clean many pathogens and germs from groundwater and runoff. A group of these devices, filtering the water from wells or runoff could help with poor sanitation and controlling the spread of waterborne illnesses

Kenya may be a good candidate for testing out these systems because of its progressive and relatively well-funded department of agriculture, including the Kenya Agricultural Research Center, which provides funding and oversight to many projects investigating experimental methods and technologies.

Even though this solar technology may have a higher starting cost than that of conventional fossil fuel, the low maintenance and operation cost and the ability to operate without fuel makes the solar powered systems cheaper to keep running. A small rural community could use a system like this indefinitely, and it would provide clean drinking water at a negligible cost after the initial equipment purchase and setup. In a larger community, it could at least contribute to the water supply and reduce pressures of daily survival. This technology is capable of pumping hundreds of gallons of water per day, and is limited only by the amount of water available in the water table.

With a minimum of training in operation and maintenance, solar powered water pumping and purification systems have the potential to help rural Africans fulfill one of their most basic needs for survival. Further field test are in progress by organizations like KARI and the many corporations that manufacture the products needed, and these small-scale applications of solar technology are promising. Combined with sustainable agricultural practices and conservation of natural resources, solar power is a prime candidate to bring the benefits of technology to the parched lands of Africa. 

Supplementing the well water would be collection of runoff rainwater during the rainy season for later use in drought. Southern Africa has its own network of information sharing called SEARNET, which informs farmers of techniques to catch and store rainwater, with some seeing increased yields and additional harvests. This new network of farmers sharing their ideas with each other has led to a spread of both new and old ideas, and this has led to greater sustainability of water resources in the countries of Botswana, Ethiopia, Kenya, Malawi, Rwanda, Tanzania, Uganda, Zambia and Zimbabwe. This water could be used for agriculture or livestock, or could be fed through a purifier to yield water suitable for human consumption.

Examples

A solar powered water pump and holding system was installed in Kayrati, Chad, in 2004 as compensation for land lost to oil development. This system utilizes a standard well pump powered by a photovoltaic panel array. The pumped water is stored in a water tower, providing the pressure needed to deliver water to homes in the area. This use of oil revenue to build infrastructure is an example of using profits to advance the standard of living in rural areas. 

Hundreds of solar water pumping stations in Sudan fulfill a similar role, involving various applications of different systems for pumping and storage. Over the past 10 years approximately. 250 photovoltaic water pumps have been installed in Sudan. Considerable progress has been made and the present generation of systems appear to be reliable and cost–effective under certain conditions. A photovoltaic pumping system to pump 25 cubic metres per day requires a solar array of approx. 800 Wp. Such a pump would cost US$6000, since the total system comprises the cost of modules, pump, motor, pipework, wiring, control system and array support structure. PV water pumping has been promoted successfully in Kordofan state in Sudan. It shows favorable economics as compared to diesel pumps, and is free from the need to maintain a regular supply of fuel. The only maintenance problems with PV pumping [are] due to the breakdown of pumps and not the failure of the PV devices.

The Solar Water Purifier, developed and manufactured by an Australian company, is a low-maintenance, low operational cost solution that is able to purify large amounts of water, even seawater, to levels better than human consumption standards set by the World Health Organization. This device works through the processes of evaporation and UV radiation. Light passes through the top layer of glass to the black plastic layer underneath. Heat from the solar radiation is trapped by the water and by the black plastic. This plastic layer is a series of connected troughs that separate the water as it evaporates and trickles down through the levels. The water is also subjected to UV radiation for an extended period of time as it moves through the device, which kills many bacteria, viruses, and other pathogens. In a sunny, equatorial area like much of Africa, this device is capable of purifying up to 45 liters per day from a single array. Additional arrays may be chained together for more capacity. 

The Water School uses SODIS solar disinfection currently in target areas of Kenya and Uganda to help people drink water free of pathogens and disease causing bacteria. SODIS is a UV process that kills microorganisms in the water to prevent water borne disease. The science of the SODIS system is proven with over 20 years of research.

Wind power

Darling Wind Farm in South Africa
 
Wind Speed in Sub-Saharan Africa. 
 
The Koudia Al Baida Farm in Morocco, is the largest wind farm in the continent. Two other large wind farms are under construction in Tangier and Tarfaya

Kenya is building a wind farm, the Lake Turkana Wind Power (LTWP), in Marsabit County. As Africa’s largest wind farm, the project will increase the national electricity supply while creating jobs and reducing greenhouse gas emissions. LTWP is planned to produce 310 MW of wind power at full capacity.

In January 2009, the first wind turbine in West Africa was erected in Batokunku, a village in The Gambia. The 150 kilowatt turbine provides electrical power for the 2,000-person village.

The South African REIPPP has resulted in several wind farms already in commercial operation in the country. These wind farms are currently in operation in the provinces of the Eastern, Northern and Western Cape. It is estimated that 10 farms are already under construction or in operation, with 12 more being approved with the 4th Round of the REIPPP.

Geothermal power

So far, only Kenya has exploited the geothermal potential of the Great Rift Valley. Kenya has been estimated to contain 10,000 MWe of potential geothermal energy, and has twenty potential drilling sites marked for survey in addition to three operational geothermal plants. Kenya was the first country in Africa to adopt geothermal energy, in 1956, and houses the largest geothermal power plant on the continent, Olkaria II, operated by Kengen, who also operate Olkaria I. A further plant, Olkaria III, is privately owned and operated.

Ethiopia is home to a single binary-cycle plant but does not utilize its full potential energy output for lack of experience in its operation. Zambia has several sites planned for construction but their projects have stalled due to lack of funds. Eritrea, Djibouti and Uganda have undertaken preliminary exploration for potential geothermal sources but have not constructed any type of power plant.

Geothermal power has been used in agricultural projects in Africa. The Oserian flower farm in Kenya utilizes several steam wells abandoned by Kengen to power its greenhouse. In addition, the heat involved in the geothermal process is used to maintain stable greenhouse temperatures. The heat can also be utilized in cooking, which would help eliminate the dependence on wood burning.

Finance

Exploration and construction of future geothermal plants present a high cost for poor countries. Drilling potential sites alone costs millions of dollars and can result in zero energy return if the consistency of the heat and steam is unreliable. Return on investments into geothermal power are not as quick as those into fossil fuels and may take years to pay off; however, low-maintenance cost and the renewable nature of geothermal energy mean more benefits in the long term.

As an early and successful adopter of geothermal power, Kenya now has significant financial backing from the World Bank. The country hosts development conferences between representatives of the UN Environment Program and various African governments.

Delayed-choice quantum eraser

From Wikipedia, the free encyclopedia https://en.wikipedia.org/wiki/Delayed-choice_quantum_eraser A delayed-cho...