This group of black people has a history of organizations and
activities that distinguish it from other classes within the black
community, as well as from the white upper class. Many of these traditions, which have persisted for several generations, are discussed in Lawrence Otis Graham's 2000 book, Our Kind of People: Inside America's Black Upper Class. Scholarship on this class from a sociological perspective is generally traced to E. Franklin Frazier's Black Bourgeoisie (first edition in English in 1957 translated from the 1955 French original).
Some people escaped slavery and served in the American Civil War (1861–1865) for the Union and after the war, an extremely small number of freed people along the Georgia coast received 40 acres (160,000 m2) and a mule, which contributed to land ownership among blacks following the emancipation of slaves.
Following the outbreak of the Civil War, abolitionists such as Frederick Douglass
claimed that enlisting Black soldiers would strengthen the North in
winning the war and would be a significant step forward in the fight for
equal rights: "Once let the Black man get upon his person the brass
letters, U.S.; let him get an eagle on his button, and a musket on his
shoulder and bullets in his pocket," Douglass said, "and there is no
power on earth which can deny that he has earned the right to
citizenship." This is just what President Lincoln feared: He was
concerned that arming African Americans, particularly former or escaped
slaves, might lead to the declaring independence of the loyal border
states. As a result, the Union's chances of winning the war would be
slim to none.
Other former slaves, often mixed-race former house slaves who
shared ancestry with their onetime owners and had acquired marketable
skills such as cooking and tailoring, worked in domestic fields or were
able to open small businesses such as restaurants and catering firms.
Some free blacks in the North also founded small businesses and even
newspapers.
They were able to get a head-start on the blacks who were essentially
still enslaved by their lack of access to wealth accumulation,
particularly when it came to owning their own land.
Since the founding of the historically black schools, often
attended originally by the children of skilled former slaves who had
been able to establish businesses or farms in the post-war period,
several generations of many families have often become alumni of
Talladega, Spelman, Morehouse, Howard, Fisk, Tuskegee, Dillard, Atlanta
University (now Clark Atlanta University), and Hampton. While today
there are well over one hundred historically black colleges and
universities (HBCUs) in the US, these early institutions have
consistently been the favorites for upper-class blacks. In particular, Spelman College, Howard University, and Morehouse College, have historically been heavily favored by the Black intelligentsia due to their selectivity, academic rigor, name recognition, networking opportunities, location, and black cultural enrichment.
However, since integration, many children of the black upper
class have attended predominantly non-black colleges and universities.
"In the first time period covered by the scholars, black colleges were
attracting significant numbers of students from professional,
middle-class black families. [These people] are now the students who are
cherry-picked by highly selective, prestigious institutions that
weren't looking for them in the 1970s", said Michael L. Lomax, president
of the United Negro College Fund.
A small number of free blacks during the 19th century were also admitted into private, predominately white institutions such as Harvard and Amherst.
Greek organizations
In 1904 Sigma Pi Phi fraternity, also known as "The Boulè," was established as the first Greek-letter fraternity
for African Americans, admitting only African-American men who were
college graduates, had gained considerable achievement within their
chosen industries, and measured as having good character. The fraternity
is not present as an undergraduate fraternity. Within a decade, African
American undergraduate college students established fraternities and sororities
as small, selective social groups that later developed an emphasis on
scholarship and social activism. Occasionally, alumni members of an
undergraduate fraternity are invited to join Sigma Pi Phi as mid-career
adults.
Some argue that historically black Greek organizations differ
from those that are traditionally all-white, because of their importance
to blacks long after they have left their respective colleges and
universities. Graham said in his book Our Kind of People: Inside America's Black Upper Class
that these sororities and fraternities "are a lasting identity, a
circle of lifetime friends, a base for future political and civic
activism".
Social and family organizations
Over the years, the black upper class has also founded numerous other
organizations that allow them to socialize, build networks and get
involved in communities.
Notable organizations
One of the most notable is Jack and Jill of America, Inc.,
a mothers' club for African-American women founded in Philadelphia,
Pennsylvania in 1938. It was created by a group of middle and upper
middle class mothers who wanted to bring their children together to
experience a variety of educational, social and cultural opportunities,
which, due to segregation and racism, were not otherwise readily
available to African-American children, regardless of the socio-economic
status of their parents. As of 2000 there were around 218 chapters across the US and the world with about 9,500 members.
Separated into age groups, children attend monthly activities
extensively planned by the mothers of that age group, which may include
philanthropic endeavors, community service, pool parties, ski weekends,
theater, museums, lectures, and college tours. Membership is by
invitation only and, even then, not guaranteed due to the extensive
candidate selection process, which may last a year or longer and may
include a vote by existing members. Membership is limited to mothers of
children between the ages of 2-19. Annual costs of membership, including
dues and activity fees, may easily reach thousands of dollars. Cory Booker's mother was a member and Booker participated in activities.
The Links,
Incorporated, founded in 1946, is an invitation-only social service
organization that requires each member to accumulate many volunteer
hours. It is known for numerous annual social activities, including
debutante cotillions, fashion show luncheons, auctions and balls. Women interested in joining any of the local chapters must be nominated by a current member.
Members include philanthropists, college presidents, judges, doctors,
bankers, lawyers, executives, educators or the wives of well-known
public figures including Kamala Harris, Marian Wright Edelman, and Betty Shabazz. As of 2008 there were about 12,000 members in 273 chapters in 42 states.
The 100 Black Men of America was founded in 1963 in New York City.
The organization has chapters across the US and internationally, and
is primarily composed of college-degreed black men. Its primary mission
is to improve the quality of life within their communities and enhance
educational and economic opportunities for all African-Americans. It
currently has over 10,000 members.
The National Coalition of 100 Black Women was founded in 1970 in New York City.
The organization has chapters across the US and its membership is
primarily composed of black women who have college degrees. It advocates
on behalf of black women and girls, as well as promotes leadership
development and gender equity in health, education, and economic
empowerment.
Other social and family organizations
The
Girl Friends, Incorporated is a social organization of African American
women. It was founded in 1927 during the Harlem Renaissance, by a small
group of close friends. As of 2016 the organization included more than
1,700 members in 47 chapters in cities across the country. Although the
original concept was purely social, over the years, The Girl Friends,
Incorporated expanded to include charitable and cultural activities. In
1989, the Girl Friends Fund founded a separate 501(c)3 organization to
provide financial assistance to students countrywide.
The National Smart Set is a private social club founded in 1937
in Washington, DC. Members are African-American women who are leaders in
their professions and, often, leaders of other respected and notable
clubs and organizations. There are 700 members in 26 chapters. Each of
the 26 local chapters provides philanthropic services and financial
support to causes within the geographic region. At the national level,
the organization donates to member-agreed causes including the MLK
Memorial, Smithsonian's National Museum of African-American History and
Culture, NAACP Legal Defense Fund, Lupus Foundation and the Hampton
University Proton Therapy Institute. Membership to the National Smart
Set is by invitation and the organization seeks to contain its size to
ensure that members develop and nurture nation-wide bonds and
relationships.
National Tots and Teens, Incorporated is another well-noted
family organization. It is unique in that fathers hold membership with
mothers; single father-headed households are eligible for membership.
Tots and Teens was founded by Geraldine Jacoway-Ross of Los Angeles,
California in May 1952. In 1953 its second chapter was organized in Baltimore, Maryland.
Ross wanted to expose her daughter and other youths to experiences they
would not otherwise be exposed to. Tots and Teens holds a variety of
activities for youth and parents such as ski trips, debutante
cotillions, volunteer projects, and cultural events. Membership is by
invitation only and requires two families for sponsorship and the first
year the family is viewed as a prospective member without full
membership status.
Twigs, Incorporated was founded by Clara J. Bostic in Yeadon
(Philadelphia) in 1948 as "an association whose objective is to
encourage and foster mental, physical, social and cultural development
of the children who are members." The organization is national in scope
and sponsors a wide variety of activities. It has sponsored ACT/SAT prep
sessions, book fairs geared toward African-American children, and
leadership development for Twigs youth groups. Twigs has sponsored an
annual scholarship competition through its chapters for community youth
graduating from high school and continuing their education at four-year
institutions. The organization has an archival repository housed at the
Historical Society of Pennsylvania.
Other prominent women's groups include the Chums, Inc.; Knights of Peter Claver & Ladies Auxiliary; Continental Societies, Inc.; the Drifters, Inc.; the CARATS, Incorporated; the Moles, Inc.; the Pierians; the Carousels; Top Ladies of Distinction
(TLOD); The National Association of Negro Business and Professional
Women's Club, Inc.; National Women of Achievement, Inc.; and the
Northeasterners.
A few organizations have been founded specifically for upper
class black men. Some of these include the Comus Social Club, the What
Good Are We Social Club a.k.a. "The Whats" (Howard University,
Washington, DC), the Reveille Club, the Hellians (Washington, DC;
Baltimore, Maryland; and Jackson, Mississippi), the Chesterfield Club of
Selma, Alabama the Thebans, the Tux Club, the Consorts, Bachelor-Benedict Club, the National Association of Guardsmen, the El Dorado Club of Houston, Texas, and the Bonanza Social Club of Baton Rouge, Louisiana.
Home ownership rates
According to a 2007 estimate, 80 percent of upper-class blacks own their own homes.
This is compared to 66 percent of those earning more than $50,000 and
52 percent of those who earn between $30,000 and $49,999 in income.
Notable black business districts during segregation
The
following are a few black business districts, areas, and cities that
swelled with success during the era of legal segregation, which also
contributed to the rise of the African-American upper class.
Black Business District, Walnut Street, Louisville, Kentucky
Criticism
Academic
Donald Earl Collins has criticized members of the black middle- and
upper-classes for having attitudes and values similar to their white
counterparts.
Some in the black community have been very critical of the black upper
class community, in particular after the release of Graham's book Our Kind of People.
Darren Walker of the Rockefeller Foundation says that the behaviors of
the black upper classes exclude many from the privileges the group
enjoys, arguing "one part of our community seems quite comfortable
adopting the exclusive practices of the majority community that for many
years kept us out."
Interpretations of the phrase vary, depending on personal
perspectives, political ideologies and the selective use of statistics.
It is frequently used in politics, where it is used to refer to
perceived redistribution from those who have more to those who have
less.
Occasionally, however, the term is used to describe laws or
policies that cause redistribution in the opposite direction, from the
poor to the rich.
The phrase is often coupled with the term class warfare, with high-income earners and the wealthy portrayed as victims of unfairness and discrimination.
Redistribution tax policy should not be confused with predistribution
policies. "Predistribution" is the idea that the state should try to
prevent inequalities from occurring in the first place rather than
through the tax and benefits system once they have occurred. For
example, a government predistribution policy might require employers to
pay all employees a living wage and not just a minimum wage, as a "bottom-up" response to widespread income inequalities or high poverty rates.
Many alternate taxation proposals have been floated without the
political will to alter the status quo. One example is the proposed "Buffett Rule",
which is a hybrid taxation model composed of opposing systems intended
to minimize the favoritism of special interests in tax design.
The effects of a redistributive system are actively debated on
ethical and economic grounds. The subject includes an analysis of its
rationales, objectives, means, and policy effectiveness.
History
In ancient times, redistribution operated as a palace economy.
These economies were centrally based around the administration, meaning
the dictator or pharaoh had both the ability and the right to say who
was taxed and who received special treatment.
Another early form of wealth redistribution occurred in Plymouth Colony under the leadership of William Bradford. Bradford recorded in his diary that this "common course" bred confusion, discontent, distrust, and the colonists looked upon it as a form of slavery.
A closely related term, distributism
(also known as distributionism or distributivism), refers to an
economic ideology that developed in Europe in the late 19th and early
20th century. It was based on the principles of Catholic social teaching, particularly the teachings of Pope Leo XIII in his encyclical Rerum Novarum and Pope Pius XI in Quadragesimo Anno. More recently, Pope Francis echoed the earlier Papal statements in his Evangelii Gaudium.
Role in economic systems
Different types of economic systems
feature varying degrees of interventionism aimed at redistributing
income, depending on how unequal their initial distributions of income
are. Free-market capitalist
economies tend to feature high degrees of income redistribution.
However, Japan's government engages in much less redistribution because
its initial wage distribution is much more equal than Western economies.
Likewise, the socialist planned economies of the former Soviet Union and Eastern bloc featured very little income redistribution because private capital and land income
were restricted. To attain an efficient allocation of resources with
the desired distribution of income, if the assumptions of the
competitive model are satisfied by the economy, the sole role of the
government is to alter the initial distribution of wealth
– the major drivers of income inequality in capitalist systems – was
virtually nonexistent; and because the wage rates were set by the
government in these economies.
A comparison between Socialist and Capitalist
Systems in terms of distribution of income is much easier as both these
systems stand practically implemented in a number of countries under
compatible political systems. Inequality in almost all the Eastern
European economies has increased after moving from socialist controlled
systems to market-based economies.
For the Islamic distribution, the following are the three key
elements of the Islamic Economic System, which have significant
implications for the distribution of income and wealth (if fully
implemented) and are markedly different from Capitalism. The Islamic
system is defined by the following three key elements: Ushr and Zakat,
the prohibition of usury, and the Inheritance Law. Ushr is an obligatory
payment from agriculture output at the time of harvesting. If
agricultural land is irrigated by rain or some other natural freely
available water the producer is obliged to pay ten percent of the output
as Ushr.
In case irrigation water is not free of cost then the deduction
would be five percent, while Zakat is a major instrument of restricting
the excessive accumulation of wealth and helping the poor and most
vulnerable members of the society, Secondly, usury, or charging interest,
is prohibited. Elimination of interest from the economic system is a
revolutionary step with profound effects on all spheres of economic
activities. Finally, the Inheritance Law Of Islam is the distribution of
the property of a deceased person from closest family members and
moving towards a more distant family. Son(s), daughter(s), wife, husband
and parents are the prime recipients. This distribution is explicitly
illustrated in Qur’an and cannot be changed or modified. Under varying
conditions, the share received by different relatives accordingly
changes. The important principle is that the owner at the time of
his/her death cannot change these shares.
How views on redistribution are formed
The context that a person is in can influence their views on redistributive policies.
For example, despite both being Western civilizations, typical
Americans and Europeans do not have the same views on redistribution
policies.
This phenomenon persists even among people who would benefit most from
redistributive policies, as poor Americans tend to favor redistributive
policy less than equally poor Europeans.
Research shows this is because when a society has a fundamental belief
that those who work hard will earn rewards from their work, the society
will favor lower redistributive policies.
However, when a society as a whole believes that some combination of
outside factors, such as luck or corruption, can contribute to
determining one's wealth, those in the society will tend to favor higher
redistributive policies.
This leads to fundamentally different ideas of what is ‘just’ or fair
in these countries and influences their overall views on redistribution.
Another context that can influence one's ideas of redistributive policies is the social class that one is born into. People tend to favor redistributive policy that will help the groups that they are a member of.
This is displayed in a study of Latin American lawmakers, where it is
shown that lawmakers born into a lower social class tend to favor more
redistributive policies than their counterparts born into a higher
social class.
Research has also found that women generally support redistribution
more than men do, though the strength of this preference varies across
countries.
While literature remains mixed on if monetary gain is the true
motivation behind favoring redistributive policies, most researchers
accept that social class plays some role in determining someone's views
towards redistributive policies.
Nonetheless, the classic theory that individual preferences for
redistribution decrease with their income, leading to societal
preferences for redistribution that increase with income inequality has been disputed.
Perhaps the most important impact of government on the distribution of
“wealth” is in the sphere of education—in ensuring that everyone has a
certain amount of human capital. By providing all individuals,
regardless of the wealth of their parents, with a free basic education,
government reduces the degree of inequality that otherwise would exist.
Income inequality has many different connotations, three of which
are of particular importance: (1) The moral dimension, which leads into
the discussion of human rights. What kinds of reasons should a society
accept for the emergence or existence of inequality and how much
inequality between its members is reconcilable with the right of each
individual to human dignity? (2) The second dimension links inequality
to political stability. How much inequality can a society endure before a
significant number of its members begin to reject the existing pattern
of distribution and demand fundamental changes? In societies with very
rigid forms of the income distribution, this may easily lead to public
protest, if not violence. Authorities are then faced with the option of
reacting to protests with repression or reform. In societies with
flexible tools of negotiation and bargaining on income, smoother
mechanisms of adaptation may be available. (3) The third dimension – in
many cases the dominant pattern in the social debate – links inequality
to economic performance. Individuals who achieve more and perform better
deserve a higher income. If everybody is treated the same, the overall
willingness to work may decline. The argument includes the scarcity of
skills. Societies have to provide incentives to ensure that talents and
education are allocated to jobs where they are needed most. Not many
people doubt the general accuracy of these arguments – but nobody has
ever shown how to correctly measure performance and how to find an
objective way of linking it to the prevailing level of the income
distribution. Inequality is needed – to some extent – but nobody knows
how much of it is good.
Inequality in developing countries
The
existence of high inequality within many developing countries,
side-by-side with persistent poverty, started to attract attention in
the early 1970s. Nonetheless, through the 1980s and well into the 1990s,
the mainstream view in development economics was still that high and/or
rising inequality in poor countries was a far less important concern
than assuring sufficient growth, which was the key to poverty reduction.
The policy message for the developing world was clear: one could not
expect to have both lower poverty and less inequality.
Modern forms of redistribution
The
redistribution of wealth and its practical application are bound to
change with the continuous evolution of social norms, politics, and
culture. Within developed countries income inequality has become a
widely popular issue that has dominated the debate stage for the past
few years. The importance of a nation's ability to redistribute wealth
in order to implement social welfare programs, maintain public goods,
and drive economic development has brought various conversations to the
political arena. A country's means of redistributing wealth comes from
the implementation of a carefully thought out well described system of
taxation. The implementation of such a system would aid in achieving the
desired social and economic objective of diminishing social inequality
and maximizing social welfare. There are various ways to impose a tax
system that will help create a more efficient allocation of resources,
in particular, many democratic, even socialist governments utilize a
progressive system of taxation to achieve a certain level of income
redistribution. In addition to the creation and implementation of these
tax systems, "globalization of the world economy [has] provided
incentives for reforming the tax systems" across the globe.
Along with utilizing a system of taxation to achieve the redistribution
of wealth, the same socio-economic benefit can be achieved if there are
appropriate policies enacted within a current political infrastructure
that addresses these issues. Modern thinking towards the topic of the
redistribution of wealth, focuses on the concept that economic
development increases the standard of living across an entire society.
Today, income redistribution occurs in some form in most democratic
countries, through economic policies. Some redistributive policies
attempt to take wealth, income, and other resources from the "haves" and
give them to the "have-nots", but many redistributions go elsewhere.
In a progressive income tax
system, a high income earner will pay a higher tax rate (a larger
percentage of their income) than a low income earner; and therefore,
will pay more total dollars per person.
Other taxation-based methods of redistributing income are the negative income tax for very low income earners and tax loopholes (tax avoidance) for the better-off.
Two other common types of governmental redistribution of income are subsidies and vouchers (such as food stamps or Section-8 housing vouchers). These transfer payment programs are funded through general taxation, but benefit the poor or influential special interest groups and corporations.
While the persons receiving transfers from such programs may prefer to
be directly given cash, these programs may be more palatable to society
than cash assistance, as they give society some measure of control over
how the funds are spent.
In addition to having a progressive tax rate, the U.S. Social Security system also redistributes wealth to the poor via its highly progressive benefit formula.
Governmental redistribution of income may include a direct
benefit program involving either cash transfers or the purchase of
specific services for an individual. Medicare is one example.
Medicare is a government-run health insurance program that covers
people age 65 or older, certain younger people with disabilities, and
people with end-stage renal disease
(permanent kidney failure requiring dialysis or a transplant, sometimes
called ESRD). This is a direct benefit program because the government
is directly providing health insurance for those who qualify.
The difference between the Gini index for the income distribution before taxation and the Gini index after taxation is an indicator for the effects of such taxation.
Wealth redistribution can be implemented through land reform that transfers ownership of land from one category of people to another, or through inheritance taxes, land value taxes or a broader wealth tax on assets in general. Before-and-after Gini coefficients for the distribution of wealth can be compared.
Interventions like rent control can impose large costs. Some
alternative forms of interventions, such as housing subsidies, may
achieve comparable distributional objectives at less cost. If the
government cannot costlessly
redistribute, it should look for efficient ways of redistributing—that
is, ways that reduce the costs as much as possible. This is one of the
main concerns of the branch of economics called the economics of the
public sector.
Class analysis
One study
suggests that "the middle class faces a paradoxical status" in that
they tend to vote against income redistribution, even though they would
benefit economically from it.
Objectives
The
objectives of income redistribution are to increase economic stability
and opportunity for the less wealthy members of society and thus usually
include the funding of public services.
One basis for redistribution is the concept of distributive justice, whose premise is that money and resources ought to be distributed in such a way as to lead to a socially just, and possibly more financially egalitarian, society. Another argument is that a larger middle class benefits an economy by enabling more people to be consumers, while providing equal opportunities for individuals to reach a better standard of living. Seen for example in the work of John Rawls,
another argument is that a truly fair society would be organized in a
manner benefiting the least advantaged, and any inequality would be
permissible only to the extent that it benefits the least advantaged.
Some proponents of redistribution argue that capitalism results in an externality that creates unequal wealth distribution.
Many economists have argued that wealth and income inequality are a cause of economic crises,
and that reducing these inequalities is one way to prevent or
ameliorate economic crises, with redistribution thus benefiting the
economy overall. This view was associated with the underconsumptionism school in the 19th century, now considered an aspect of some schools of Keynesian economics; it has also been advanced, for different reasons, by Marxian economics. It was particularly advanced in the US in the 1920s by Waddill Catchings and William Trufant Foster. More recently, the so-called "Rajan hypothesis" posited that income inequality was at the basis of the explosion of the 2008 financial crisis.
The reason is that rising inequality caused people on low and middle
incomes, particularly in the US, to increase their debt to keep up their
consumption levels with that of richer people. Borrowing was
particularly high in the housing market and deregulation in the financial sector made it possible to extend lending in sub-prime mortgages. The downturn in the housing market in 2007 halted this process and triggered the financial crisis. Nobel Prize laureate Joseph Stiglitz, along with many others, supports this view.
There is currently a debate concerning the extent to which the world's extremely rich have become richer over recent decades. Thomas Piketty's Capital in the Twenty-First Century is at the forefront of the debate, mainly focusing on within-country concentration of income and wealth. Branko Milanovic provided evidence of increasing inequality at the global level, showing how the group of so-called "global plutocrats", i.e. the richest 1% in the world income distribution, were the main beneficiaries of economic growth in the period 1988–2008.
More recent analysis supports this claim, as 27% of total economic
growth worldwide accrued to the top 1% of the world income distribution
in the period 1980–2016. The approach underpinning these analyses has been somehow critiqued in certain publications such as The Economist.
Moral obligation
Peter Singer's argument contrasts to Thomas Pogge's in that he states we have an individual moral obligation to help the poor. The rich people who are living in the states with more redistribution,
are more in favor of immigrants than poorer people, because this can
make them pay less wages.
A 2011 report by the International Monetary Fund
by Andrew G. Berg and Jonathan D. Ostry found a strong association
between lower levels of inequality and sustained periods of economic
growth. Developing countries (such as Brazil, Cameroon, Jordan) with
high inequality have "succeeded in initiating growth at high rates for a
few years" but "longer growth spells are robustly associated with more
equality in the income distribution." The Industrial Revolution led to increasing inequality among nations. Some economies took off, whereas others, like
many of those in Africa or Asia, remained close to a subsistence standard of living. General calculations show that
the 17 countries of the world with the most-developed economies had, on average, 2.4 times the GDP per capita of
the world’s poorest economies in 1870. By 1960, the most developed economies had 4.2 times the GDP per capita of
the poorest economies.
Regarding to GDP indicator, GDP has nothing to say about the level of
inequality in society. GDP per capita is only an average. When GDP per
capita rises by 5%, it could mean that GDP for everyone in the society
has risen by 5%, or that GDP of some groups has risen by more while that
of others has risen by less—or even declined.
Criticism
Public choice
theory states that redistribution tends to benefit those with political
clout to set spending priorities more than those in need, who lack real
influence on government.
The socialist economists John Roemer and Pranab Bardhan criticize redistribution via taxation in the context of Nordic-stylesocial democracy, reportedly highlighting its limited success at promoting relative egalitarianism
and its lack of sustainability. They point out that social democracy
requires a strong labor movement to sustain its heavy redistribution,
and that it is unrealistic to expect such redistribution to be feasible
in countries with weaker labor movements. They point out that, even in
the Scandinavian countries, social democracy has been in decline since
the labor movement weakened. Instead, Roemer and Bardhan argue that changing the patterns of enterprise ownership and market socialism, obviating the need for redistribution, would be more sustainable and effective at promoting egalitarianism.
Marxian economists
argue that social democratic reforms – including policies to
redistribute income – such as unemployment benefits and high taxes on
profits and the wealthy create more contradictions in capitalism by
further limiting the efficiency of the capitalist system via reducing
incentives for capitalists to invest in further production. In the Marxist view, redistribution cannot resolve the fundamental issues of capitalism – only a transition to a socialist economy can.
Income redistribution will lower poverty
by reducing inequality, if done properly. But it may not accelerate
growth in any major way, except perhaps by reducing social tensions
arising from inequality and allowing poor people to devote more
resources to human and physical asset accumulation. Directly investing
in opportunities for poor people is essential.
The distribution of income that emerges from competitive markets
may be very unequal. However, under the
conditions of the basic competitive model, a redistribution of wealth
can move the economy to a more equal allocation that is also Pareto
efficient.
Proportion of Americans living below the poverty line in each county of
the fifty states, the District of Columbia, and Puerto Rico according
to the 2016 - 2020 American Community Survey
Number in Poverty and Poverty Rate: 1959 to 2017. The US.
In the United States, poverty has both social and political implications. In 2020, there were 37.2 million people in poverty. Some of the many causes include income inequality, inflation, unemployment, debt traps and poor education. The vast majority of people living in poverty are less educated and end up in a state of unemployment; higher incarceration rates have also been observed. Although the US is a relatively wealthy country by international standards, poverty has consistently been present throughout the United States, along with efforts to alleviate it, from New Deal-era legislation during the Great Depression, to the national war on poverty in the 1960s and poverty alleviation efforts during the 2008 Great Recession.
The U.S. federal government uses two measures to measure poverty: the poverty thresholds set by the U.S. Census Bureau, used for statistical purposes, and the poverty guidelines issued by the Department of Health and Human Services, which are used for administrative purposes.
Poverty thresholds, which recognize poverty as a lack of those goods
and services which are commonly taken for granted by members of
mainstream society,
consist of income levels. On the other hand, poverty guidelines are
simpler guidelines that are used to determine eligibility for federal
programs such as Head Start and food stamps.
The 2020 assessment by the U.S. Census Bureau showed the percentage of Americans living in poverty for 2019 (before the COVID-19 pandemic) had fallen to some of lowest levels ever recorded due to the record-long period of economic growth. However, between May and October 2020, some eight million people were put into poverty due to the economic effects of the COVID-19 pandemic and the ending of funds from the CARES Act.
Historical background
Progressive era
Neighborhoods in Chicago color-coded by income, published in Hull House Maps and Papers.
Catalyzed by Henry George's 1873 book Progress and Poverty,
public interest in how poverty could arise even in a time of economic
progress arose in the 19th century with the rise of the Progressive
movement. The Progressive American social survey began with the
publication of Hull House Maps and Papers in 1895. This study included essays and maps collected by Florence Kelley and her colleagues working at Hull House and staff of the United States Bureau of Labor.
It focused on studying the conditions of the slums in Chicago,
including four maps color-coded by nationality and income level, which
were based on Charles Booth's earlier pioneering work, Life and Labour of the People in London.
Another social reformer, Jacob Riis, documented the living conditions of New York tenements and slums in his 1890 work How the Other Half Lives.
Great Depression
A group especially vulnerable to poverty consisted of poor sharecroppers
and tenant farmers in the South. These farmers consisted of around a
fourth of the South's population, and over a third of these people were
African Americans.
Historian James T. Patterson refers to these people as the "old
poverty," as opposed to the "new poverty" that emerged after the onset
of the Great Depression.
During the Depression, the government did not provide any unemployment insurance, so people who lost jobs easily became impoverished. People who lost their jobs or homes lived in shantytowns or Hoovervilles. Many New Deal programs were designed to increase employment and reduce poverty. The Federal Emergency Relief Administration
specifically focused on creating jobs for alleviating poverty. Jobs
were more expensive than direct cash payments (called "the dole"), but
were psychologically more beneficial to the unemployed, who wanted any
sort of job for morale. Other New Deal initiatives that aimed at job creation and wellbeing included the Civilian Conservation Corps and Public Works Administration. Additionally, the institution of Social Security was one of the largest factors that helped to reduce poverty.
A number of factors helped start the national War on Poverty in the 1960s. In 1962, Michael Harrington's book The Other America
helped increase public debate and awareness of the poverty issue. The
War on Poverty embraced expanding the federal government's roles in
education and health care as poverty reduction strategies, and many of
its programs were administered by the newly established Office of Economic Opportunity.
The War on Poverty coincided with more methodological and precise
statistical versions of studying poverty; the "official" U.S.
statistical measure of poverty was only adopted in 1969.
21st century
Tents of the homeless in San Francisco, California, May 2020
In the 21st century, the Great Recession helped to increase poverty levels again. As of 2009, the number of people who were in poverty was approaching 1960s levels that led to the national War on Poverty. The 2010 census data shows that half the population qualifies as poor or low income, with one in five millennials living in poverty. Academic contributors to The Routledge Handbook of Poverty in the United States postulate that new and extreme forms of poverty have emerged in the U.S. as a result of neoliberal structural adjustment policies and globalization,
which have rendered economically marginalized communities as destitute
"surplus populations" in need of control and punishment.
Many international bodies have emphasized the issues of poverty that the United States faces. A 2013 UNICEF report ranked the U.S. as having the second-highest relative child poverty rates in the developed world. As of June 2016, the IMF
warned the United States that its high poverty rate needs to be tackled
urgently by raising the minimum wage and offering paid maternity leave
to women to encourage them to enter the labor force. In December 2017, the United Nations special rapporteur on extreme poverty and human rights, Philip Alston,
undertook a two-week investigation on the effects of systemic poverty
in the United States, and sharply condemned "private wealth and public
squalor," declaring the state of Alabama to have the "worst poverty in the developed world." Alston's report was issued in May 2018 and highlights that 40 million people live in poverty and over five million live "in 'Third World' conditions."
According to a 2020 assessment by the U.S. Census Bureau, the percentage of Americans living in poverty for 2019 (before the COVID-19 pandemic)
had fallen to some of lowest levels ever recorded due to the
record-long economic growth period and stood at 11.1% (adjusted for
smaller response during the pandemic). However, between May and October 2020, the economic effects of the COVID-19 pandemic, and the exhaustion of the funding provided by the CARES Act, dragged some eight million people into poverty.
Measuring poverty
There are several measures used by the U.S. federal government to measure poverty. The Census Bureau issues the poverty thresholds, which are generally used for statistical purposes—for
example, to estimate the number of people in poverty nationwide each
year and classify them by type of residence, race, and other social,
economic, and demographic characteristics. The Department of Health and Human Services
issues the poverty guidelines for administrative purposes—for instance,
to determine whether a person or family is eligible for assistance
through various federal programs. Both the poverty thresholds and poverty guidelines are updated yearly.
More recently, the Census Bureau has begun using the Supplemental
Poverty Measure as an additional statistic to measure poverty and
supplement the existing measures.
Poverty income thresholds
The poverty income thresholds originate from work done by Mollie Orshansky, an American economist working for the Social Security Administration. Orshansky introduced the poverty thresholds in a 1963 Social Security Bulletin article, "Children of the Poor."
Orshansky based her thresholds on work she had done with the economy food plan while at the USDA.
According to the USDA's 1955 Household Food Consumption Survey,
families of three or more people spent one-third of their after-tax
income on food. For these families, poverty thresholds were set at three
times the cost of the economy food plan. Different procedures were used
for calculating poverty thresholds for two-person households and
persons living alone.
Her work appeared at an opportune moment, as President Johnson
declared the War on Poverty just six months later—and Orshanky's work
offered a numerical way to measure progress in this effort. The newly formed Office of Economic Opportunity (OEO) adopted the Orshansky poverty thresholds for statistical, planning, and budgetary purposes in May 1965.
Officials at the OEO were enthusiastic; as research director Joseph
Kershaw remarked, "Mollie Orshansky says that when you have more people
in the family, you need more money. Isn't that sensible?"
Officials at the Social Security Administration began to plan on
how to adjust poverty thresholds for changes in the standard of living.
The Bureau of the Budget
resisted these changes, but formed an interagency committee that, in
1969, decided that poverty thresholds would be adjusted for inflation by
being tied to the Consumer Price Index,
rather than changes in the standard of living. In August 1969, the
Bureau of the Budget designated these revised thresholds as the federal
government's official definition of poverty.
Apart from minor changes in 1981 that changed the number of thresholds from 124 to 48,
poverty thresholds have remained static for the past fifty years
despite criticism that the thresholds may not be completely accurate.
Although the poverty thresholds assumes that the average household of
three spends one-third of its budget on food, more recent surveys have
shown that that number has decreased to one-fifth in the 1980s and
one-sixth by the 1990s.
If the poverty thresholds were recalculated based on food costs as of
2008, the economy food budget multiplier would have been 7.8 rather than
3, greatly increasing the thresholds.
The poverty guidelines are a version of the poverty thresholds used
by federal agencies for administrative purposes, such as determining
eligibility for federal assistance programs. They are useful because
poverty thresholds for one calendar year are not published until the
summer of the next calendar year; poverty guidelines, on the other hand,
allow agencies to work with more timely data.
Poverty guidelines were initially issued by the OEO starting in December 1965. After the Omnibus Budget Reconciliation Act of 1981, responsibility for issuing the guidelines was transferred to the Department of Health and Human Services. Poverty guidelines are also referred to as the "federal poverty level" (FPL), but the HHS discourages that term as ambiguous.
Supplemental Poverty Measure
In 1990, a Congressional committee requested the National Research Council (NRC) to conduct a study on revising the poverty measure. The NRC convened a panel, which published a 1995 report Measuring Poverty: A New Approach
that concluded that the official poverty measure in the United States
is flawed. The panel noted that the thresholds are the same irrespective
of geography and stated that due to "rising living standards in the
United States, most approaches for developing poverty thresholds
(including the original one) would produce higher thresholds today than
the current ones."
Additionally, the report suggested an alternative measure of
poverty, which uses actual expenditure data to develop a threshold value
for a family of four—and then update this threshold every year and
according to geographic location. This alternative measure of poverty
would also change the income calculation for a family, including certain
non-cash benefits that satisfied "basic needs" such as food stamps and
public housing while excluding "non-basic needs" such as medical costs
and child care.
The work of the panel led to the development of Supplemental
Poverty Measure (SPM), which was intended to address some of the
weaknesses of the existing poverty guidelines. In October 2014, the
Census Bureau released a report describing the SPM and stated its
intention to publish SPM measures every year.
However, SPM is intended to "supplement" the existing poverty
thresholds, not "replace" them, as poverty thresholds will remain the
"official" Census Bureau measure and poverty guidelines will be derived
only from the "official" poverty measures.
Unlike the poverty thresholds, and in line with the NRC
recommendations, the SPM both includes certain non-cash benefits in a
family's income and adjusts thresholds for differences in housing costs
by geographic area. Additionally, the SPM thresholds are based on how
much a "reference" family with two children spends on food, clothing,
shelter, and utilities (FCSU).
Criticism
Understating poverty
Many
sociologists and government officials have argued that poverty in the
United States is understated, meaning that there are more households
living in actual poverty than there are households below the poverty
threshold. A recent NPR
report states that as many as 30% of Americans have trouble making ends
meet and other advocates have made supporting claims that the rate of
actual poverty in the US is far higher than that calculated by using the
poverty threshold. A study taken in 2012 estimated that roughly 38% of Americans live "paycheck to paycheck."
In 1969, the Bureau of Labor Statistics put forward suggested budgets
for adequate family living. 60% of working-class Americans lived below
the "intermediate" budget, which allowed for the following:
It assumes, for example, that the family will own:
... A toaster that will last for 33 years.
... A vacuum cleaner that will last 14 years.
The budget assumes that a family will buy a two-year-old car and keep it for four years...
Finally, the budget allows nothing whatever for savings.
Given
that the "intermediate" budget was fairly modest, observers questioned
whether poverty levels were really capturing the full extent of
prosperity, challenging the long-established view that most Americans
had attained an affluent standard of living in the two decades following
the end of the Second World War.
There have also been criticism of the methodology used to develop the
U.S. poverty thresholds in the first place. As noted above, the poverty
thresholds used by the US government were originally developed during
the Johnson administration'sWar on Poverty initiative in the early 1960s.
The thresholds were based on the cost of a food basket at the time,
multiplied by three, under the assumption that the average family spent
one third of its income on food.
However, the current poverty line only takes into account food
purchases that were common more than 50 years ago. Additionally, it
assumes that Americans spend one third of their income on food; in fact,
Americans typically spent less than one tenth of their after-tax income
on food in 2000. For many families, the costs of housing, health insurance and medical care,
transportation, and access to basic telecommunications take a much
larger bite out of the family's income today than a half century ago,
yet none of these costs are considered in determining the official
poverty thresholds.
According to John Schwarz, a political scientist at the University of Arizona:
The
official poverty line today is essentially what it takes in today's
dollars, adjusted for inflation, to purchase the same poverty-line level
of living that was appropriate to a half century ago, in 1955 ....
Updated thereafter only for inflation, the poverty line lost all
connection over time with current consumption patterns of the average
family. Quite a few families then didn't have their own private
telephone, or a car, or even a mixer in their kitchen... The official
poverty line has thus been allowed to fall substantially below a
socially decent minimum, even though its intention was to measure such a
minimum.
The issue of understating poverty is especially pressing in states with both a high cost of living and a high poverty rate such as California where the median home price in 2006 was $564,430. In the Monterey area,
where the low-pay industry of agriculture is the largest sector in the
economy and the majority of the population lacks a college education,
the median home price was $723,790, requiring an upper middle class income only earned by roughly 20% of all households in the county.
Such fluctuations in local markets are, however, not considered in the
federal poverty threshold and may leave many who live in poverty-like
conditions out of the total number of households classified as poor.
The Supplemental Poverty Measure, introduced in 2011, aims at
providing a more accurate picture of the true extent of poverty in the
United States by taking account of non-cash benefits and geographic
variations.
According to this new measure, 16% of Americans lived in poverty in
2011, compared with the official figure of 15.2%. With the new measure,
one study estimated that nearly half of all Americans lived within 200%
of the federal poverty line.
According to American economist Sandy Darity, Jr.,
"There is no exact way of measuring poverty. The measures are
contingent on how we conceive of and define poverty. Efforts to develop
more refined measures have been dominated by researchers who
intentionally want to provide estimates that reduce the magnitude of
poverty."
Overstating poverty
Youth play in Chicago's Stateway Gardens high-rise housing project in 1973.
Some critics assert that the official U.S. poverty definition is
inconsistent with how it is defined by its own citizens and the rest of
the world, because the U.S. government considers many citizens
statistically impoverished despite their ability to sufficiently meet
their basic needs. According to a 2011 paper by research fellow Robert Rector from the conservative Heritage Foundation, of the 43.6 million Americans deemed by the U.S. Census Bureau
to be below the poverty level in 2009, the majority had adequate
shelter, food, clothing and medical care. Left-leaning sources disputed
the report's findings.
In addition, the paper stated that those assessed as below the poverty
line in 2011 have a much higher quality of living than those who were
identified by the census 40 years ago as being in poverty. For example,
in 2005, 63.7% of those living in poverty had cable or satellite
television. In some cases the report even said that people currently
living in poverty were actually better off than middle class
people of the recent past. For example, in 2005, 78.3% of households
living in poverty had air conditioning, whereas in 1970, 36.0% of all households had air conditioning.
According to The Heritage Foundation, the federal poverty line also excludes income other than cash income, especially welfare benefits. Thus, if food stamps and public housing
were successfully raising the standard of living for poverty stricken
individuals, then the poverty line figures would not shift, since they
do not consider the income equivalents of such entitlements.
Steven Pinker, writing in an op-ed for The Wall Street Journal, claims that the poverty rate, as measured by consumption, has fallen from 11% in 1988 to 3% in 2018.
Burkhauser et al. find that accounting for cash income, taxes, and
major in-kind transfers and updating poverty thresholds for inflation
show that a Full-income Poverty Rate based on President Johnson's
standards fell from 19.5 percent to 2.3 percent over the 1963–2017
period.
In the 2010 U.S. Census, Guam had a poverty rate of 22.9%, the Northern Mariana Islands had a poverty rate of 52.3%, and the U.S. Virgin Islands had a poverty rate of 22.4% (all higher than any U.S. state). In 2018, Puerto Rico had a poverty rate of 43.1%. In 2017, American Samoa had a poverty rate of 65% — the highest poverty rate of any state or territory in the United States.
As of 2018, the state with the lowest poverty rate was New Hampshire (7.6% poverty rate). Other states with low poverty rates in 2018 include Hawaii (8.8% poverty rate), Maryland (9.0% poverty rate), and Minnesota (9.6% poverty rate). Among U.S. states, Mississippi
had the highest poverty rate in 2018 (19.7% poverty rate), followed by
Louisiana (18.65%), New Mexico (18.55%) and West Virginia (17.10%).
Poverty and demographics
Poverty and family status
Among married couple families: 5.8% lived in poverty. This number varied by race and ethnicity as follows:
5.4% of all white persons (which includes white Hispanics),
10.7% of all black persons (which includes black Hispanics),
14.9% of all Hispanic persons (of any race) living in poverty.
Among single parent (male or female) families: 26.6% lived in poverty. This number varied by race and ethnicity as follows:
22.5% of all white persons (which includes white Hispanics),
44.0% of all black persons (which includes black Hispanics),
33.4% of all Hispanic persons (of any race) living in poverty.
Among individuals living alone: 19.1% lived in poverty. This number varied by race and ethnicity as follows:
18% of white persons (which includes white Hispanics)
28.9% of black persons (which includes black Hispanics)
27% of Hispanic persons (of any race) are living in poverty.
Poverty and race/ethnicity
Poverty rates by sex and work status for Americans aged 65 and over
The US Census declared that in 2014 14.8% of the general population lived in poverty:
As of 2010 about half of those living in poverty are non-Hispanic white (19.6 million). Non-Hispanic white children comprised 57% of all poor rural children.
In FY 2009, African American families comprised 33.3% of TANF families, non-Hispanic white families comprised 31.2%, and 28.8% were Hispanic.
Poverty among Native Americans
Poverty is also notoriously high on Native American reservations (see Reservation poverty). 7 of the 11 poorest counties in per capita income (in the 50 states), including the 2 poorest in the 50 states, encompass Lakota Sioux reservations in South Dakota.
This fact has been cited by some critics as a mechanism that enables
the "kidnapping" of Lakota children by the state of South Dakota's
Department of Social Services. The Lakota People's Law Project,
among other critics, allege that South Dakota "inappropriately equates
economic poverty with neglect ... South Dakota's rate of identifying
"neglect" is 18% higher than the national average ... In 2010, the
national average of state discernment of neglect, as a percent of total
maltreatment of foster children prior to their being taken into custody
by the state, was 78.3%. In South Dakota the rate was 95.8%."
Poverty in the Pine Ridge Reservation
in particular has had unprecedented effects on its residents'
longevity. "Recent reports state the average life expectancy is 45 years
old while others state that it is 48 years old for men and 52 years old
for women. With either set of figures, that's the shortest life
expectancy for any community in the Western Hemisphere outside Haiti,
according to The Wall Street Journal."
With
data collected from 35 states from 2014-2017, the Behavioral Risk
Factor Surveillance System (BRFSS) survey shows that 21.6% of the LGBTQ+
population is living in poverty. The number varies depending on
identity:
12.1% of cis-gay men
17.9% of cis-lesbian women
19.5% of cis-bisexual men
29.4% of cis-bisexual women
33.7% of transgender men
29.6% of transgender women, and
23.8% of gender nonconforming people.
For comparison, 13.4% of cis-straight men and 17.8% of cis-straight women are living in poverty.
Transgender Poverty
The
rate of poverty for the transgender community is larger than any other
LGBTQ+ population. The 2015 U.S. Transgender Survey shows that this
percentage varies depending on racial identity:
41% American Indian
32% Asian
38% Black
43% Latinx
34% Middle Eastern
40% Multiracial
For comparison, 24% of White transgender people are living in poverty.
The percentage of those living in poverty also increases for transgender people with HIV (51%) and disabilities (45%).
Poverty and age
Poverty Rates by Age 1959 to 2015. United States.
As of 2010, the US Census declared that 15.1% of the general population of the United States lived in poverty:
Homeless children in the United States. The number of homeless children reached record highs in 2011, 2012, and 2013 at about three times their number in 1983.
In May 2009, the non-profit advocacy group Feeding America released a study based on 2005–2007 data from the U.S. Census Bureau and the Agriculture Department,
which claims that 3.5 million children under the age of 5 are at risk
of hunger in the United States. The study claims that in 11 states,
Louisiana, which has the highest rate, followed by North Carolina, Ohio,
Kentucky, Texas, New Mexico, Kansas, South Carolina, Tennessee, Idaho
and Arkansas, more than 20 percent of children under 5 are allegedly at
risk of going hungry. (receiving fewer than 1,800 calories per day).
In 2012, 16.1 million American children were living in poverty.
Outside of the 49 million Americans living in food insecure homes, 15.9
million of them were children. In 2013, child poverty reached record high levels in the U.S., with 16.7 million children living in food insecure households. Many of the neighborhoods these children live in lack basic produce and nutritious food. 47 million Americans depend on food banks, more than 30% above 2007 levels. Households headed by single mothers are most likely to be affected. 30 percent of low-income single mothers cannot afford diapers.
Inability to afford this necessity can cause a chain reaction,
including mental, health, and behavioral problems. Some women are forced
to make use of one or two diapers, using them more than once. This
causes rashes and sanitation problems as well as health problems.
Without diapers, children are unable to enter into daycare. The lack of
childcare can be detrimental to single mothers, hindering their ability
to obtain employment.
Worst affected are Oregon, Arizona, New Mexico, Florida, and the
District of Columbia, while North Dakota, New Hampshire, Virginia,
Minnesota and Massachusetts are the least affected.
31 million low-income children received free or reduced-price meals
daily through the National School lunch program during the 2012 federal
fiscal year. Nearly 14 million children are estimated to be served by
Feeding America with over 3 million being of the ages of 5 and under.
A 2014 report by the National Center on Family Homelessness states the number of homeless children in the U.S.
has reached record levels, calculating that 2.5 million children, or
one child in every 30, experienced homelessness in 2013. High levels of
poverty, lack of affordable housing and domestic violence were cited as
the primary causes. A 2017 peer-reviewed study published in Health Affairs found that the U.S. has the highest levels of child mortality among 20 OECD countries.
Racial inequality is also visible when it comes to discerning poverty among children in America. In 2021, Children's Defense Fund estimated that 71% of children living in poverty are children of color.
Poverty is also associated with expanded adverse childhood
experiences, such as witnessing violence, feeling discrimination, and
experiencing bullying. According to a 2016 study by the Urban Institute,
teenagers in low income communities are often forced to join gangs,
save school lunches, sell drugs or exchange sexual favors because they
cannot afford food.
According to the Save the Children
fund, food insecurity among families with children as increased by two
thirds since March 2020. The fund further states that "the U.S.
continues to lag behind most peer countries in meeting the needs of
children and families during the pandemic".
Children living in poverty may also experience many health and
developmental problems due to food insecurity and malnutrition. Children
in low socioeconomic statuses are shown to have more gray matter which
affects educational and life outcomes. They may have a lower immune systems due to malnutrition, and they are more likely to have chronic disease like asthma.
Effects of poverty
Access to selected courses in US public schools by poverty level in the 2015–16 school year.
Education
Poverty affects individual access to quality education. The U.S. education system
is often funded by local communities; therefore the quality of
materials and teachers can reflect the affluence of community. That
said, many communities address this by supplementing these areas with
funds from other districts. Low income communities are often not able to
afford the quality education that high income communities do which
results in a cycle of poverty.
There are numerous factors related to poverty in the United States.
Income has a high correlation with educational levels. In 2007,
the median earnings of household headed by individuals with less than a
9th grade education was $20,805 while households headed by high school
graduates earned $40,456, households headed by holders of bachelor's
degrees earned $77,605, and families headed by individuals with
professional degrees earned $100,000. Federal Reserve Chair Janet Yellen
stated in 2014: "Public funding of education is another way that
governments can help offset the advantages some households have in
resources available for children. One of the most consequential examples
is early childhood education. Research shows that children from
lower-income households who get good-quality pre-Kindergarten education
are more likely to graduate from high school and attend college as well
as hold a job and have higher earnings, and they are less likely to be
incarcerated or receive public assistance."
In many cases poverty is caused by job loss. In 2007, the poverty
rate was 21.5% for individuals who were unemployed, but only 2.5% for
individuals who were employed full-time.
Income levels vary with age. For example, the median 2009 income for
households headed by individuals age 15–24 was only $30,750, but
increased to $50,188 for household headed by individuals age 25–34 and
$61,083 for household headed by individuals 35–44. Work experience and additional education may be factors.
Income levels vary along racial/ethnic lines: 21% of all children in the United States live in poverty, about 46% of black children and 40% of Latino children.
The poverty rate is 9.9% for black married couples, and only 30% of
black children are born to married couples (see Marriage below). The
poverty rate for native born and naturalized whites is identical (9.6%).
On the other hand, the poverty rate for naturalized blacks is 11.8%
compared to 25.1% for native born blacks, suggesting race alone does
not explain income disparity. Not all minorities have low incomes.
Asian families have higher incomes than all other ethnic groups. For
example, the 2005 median income of Asian families was $68,957 compared
to the median income of white families of $59,124.
Asians, however, report discrimination occurrences more frequently
than blacks. Specifically, 31% of Asians reported employment
discrimination compared to 26% of blacks in 2005.
Policies that address income
and wealth inequality (i.e., policies that transfer money from
higher-income and more wealthy families to less wealthy families) bear
significantly on poverty. Economist Jared Bernstein and Elise Gould of the Economic Policy Institute suggest that poverty could have decreased significantly if inequality had not increased over the last few decades. Economist Larry Summers
estimated that at 1979 levels of income inequality, the bottom 80% of
families would have an average of $11,000 more per year in income in
2014.
The relationship between tax rates and poverty is disputed. A study
comparing high tax Scandinavian countries with the U. S. suggests high
tax rates are inversely correlated with poverty rates.
The poverty rate, however, is low in some low tax countries like
Switzerland. A comparison of poverty rates between states reveals that
some low tax states have low poverty rates. For example, New Hampshire
has the lowest poverty rate of any state in the U. S., and has very low
taxes (46th among all states). It is true however that both Switzerland
and New Hampshire have a very high household income and other measures
offsetting the lack of taxation. For example, Switzerland has Universal
Healthcare and a free system of education for children as young as four
years old. New Hampshire has no state income tax or sales tax, but does have the nation's highest property taxes.
The poor in the United States are incarcerated
at a much higher rate than their counterparts in other developed
nations, with penal confinement being, according to sociologist Bruce Western, "commonplace for poor men of working age." A 2015 study by the Vera Institute of Justice contends that jails in the U.S. have become "massive warehouses" of the impoverished since the 1980s.
Scholars assert that the transformation of the already anemic U.S.
welfare state to a post-welfare punitive state, along with neoliberal
structural adjustment policies, the globalization of the U.S. economy
and the dominance of global financial institutions, have created more
extreme forms of "destitute poverty" in the U.S. which must be contained
by expanding the criminal justice system and the carceral state into
every aspect of the lives of the poor, which, according to Reuben
Jonathan Miller and Emily Shayman, has resulted in "transforming what it
means to be poor in America."
According to the American Enterprise Institute, research has shown that income and intelligence are related.
In a 1998 study, Charles Murray compared the earnings of 733 full
sibling pairs with differing intelligence quotients (IQs). He referred
to the sample as utopian in that the sampled pairs were raised in
families with virtually no illegitimacy, divorce or poverty. The average
earnings of sampled individuals with an IQ of under 75 was $11,000,
compared to $16,000 for those with an IQ between 75 and 90, $23,000 for
those with an IQ between 90 and 110, $27,000 for those with an IQ
between 110 and 125, and $38,000 for those with an IQ above 125.Murray's work on IQ has been criticized by Stephen Jay Gould, Loïc Wacquant and others, including the Southern Poverty Law Center.
According to a 2017 academic study by MIT economist Peter Temin, Americans trapped in poverty live in conditions rivaling the developing world, and are forced to contend with substandard education, dilapidated housing, and few stable employment opportunities. A 2017 study published in The American Journal of Tropical Medicine and Hygiene found that hookworm, a parasite that thrives on extreme poverty, is flourishing in the Deep South. A report on the study in The Guardian stated:
Scientists in Houston,
Texas, have lifted the lid on one of America’s darkest and deepest
secrets: that hidden beneath fabulous wealth, the US tolerates
poverty-related illness at levels comparable to the world’s poorest
countries. More than one in three people sampled in a poor area of
Alabama tested positive for traces of hookworm, a gastrointestinal
parasite that was thought to have been eradicated from the US decades
ago.
Poverty may be fueling the Obesity epidemic, with the poorest
states, counties and neighborhoods having the highest death rates from
heart disease, stroke, diabetes and other diseases related to obesity. For every $10,000 poorer a neighborhood is, the death rate of heart disease increases by 10%
In the age of inequality, such
anti-poverty policies are more important than ever, as higher inequality
creates both more poverty along with steeper barriers to getting ahead,
whether through the lack of early education, nutrition, adequate
housing, and a host of other poverty-related conditions that dampen
one's chances in life.
There have been governmental and nongovernmental
efforts to reduce poverty and its effects. These range in scope from
neighborhood efforts to campaigns with a national focus. They target
specific groups affected by poverty such as children, people who are
autistic, immigrants, or people who are homeless. Efforts to alleviate
poverty use a disparate set of methods, such as advocacy, education,
social work, legislation, direct service or charity, and community organizing.
Recent debates have centered on the need for policies that focus on both "income poverty" and "asset poverty."
Advocates for the approach argue that traditional governmental poverty
policies focus solely on supplementing the income of the poor through
programs such as Temporary Assistance for Needy Families (TANF, formerly Aid to Families with Dependent Children, AFDC) and Supplemental Nutrition Assistance Program (SNAP, formerly the Food Stamp Program). According to the CFED2012 Assets & Opportunity Scorecard,
27 percent of households – nearly double the percentage that are income
poor – are living in "asset poverty." These families do not have the
savings or other assets to cover basic expenses (equivalent to what
could be purchased with a poverty level income) for three months if a
layoff or other emergency leads to loss of income. Since 2009, the
number of asset poor families has increased by 21 percent from about one
in five families to one in four families. In order to provide
assistance to such asset poor families, Congress appropriated $24
million to administer the Assets for Independence Program under the
supervision of the US Department for Health and Human Services. The
program enables community-based nonprofits and government agencies to
implement Individual Development Account or IDA programs, which are an asset-based development initiative. Every dollar accumulated in IDA
savings is matched by federal and non-federal funds to enable
households to add to their assets portfolio by buying their first home,
acquiring a post-secondary education, or starting or expanding a small
business.
Additionally, the Earned Income Tax Credit
(EITC or EIC) is a credit for people who earn low-to-moderate incomes.
This credit allows them to get money from the government if their total
tax outlay is less than the total credit earned, meaning it is not just a
reduction in total tax paid but can also bring new income to the
household. The Earned Income Tax Credit
is viewed as the largest poverty reduction program in the United
States. There is an ongoing debate in the U.S. about what the most
effective way to fight poverty is, through the tax code with the EITC,
or through the minimum wage laws.
Government safety-net programs put in place since the War on Poverty
have helped reduce the poverty rate from 26% in 1967 to 16% in 2012,
according to a Supplemental Poverty Model (SPM) created by Columbia
University, while the official U.S. Poverty Rate has not changed, as the
economy by itself has done little to reduce poverty. According to the
2013 Columbia University study which created the (SPM) method of
measuring poverty, without such programs the poverty rate would be 29%
today. An analysis of the study by Kevin Drum suggests the American welfare state effectively reduces poverty among the elderly but provides relatively little assistance to the working-age poor. A 2014 study by Pew Charitable Trusts shows that without social programs like food stamps, social security and the federal EITC, the poverty rate in the U.S. would be much higher. Nevertheless, the U.S. has the weakest social safety net of all developed nations. Sociologist Monica Prasad of Northwestern University
argues that this developed because of government intervention rather
than lack of it, which pushed consumer credit for meeting citizens'
needs rather than applying social welfare policies as in Europe.


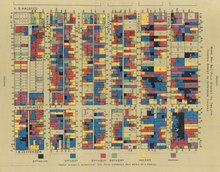
.jpg)


.jpg)


