From Wikipedia, the free encyclopedia
The
1918 flu pandemic (January 1918 – December 1920) was an unusually deadly
influenza pandemic, the first of the two pandemics Involving
H1N1 influenza virus.
[1] It infected 500 million people around the world,
including remote Pacific islands and the Arctic, and resulted in the
deaths of 50 to 100 million (three to five percent of the world's
population
[3]), making it one of the deadliest natural disasters in human history. Disease had already greatly limited
life expectancy
in the early 20th century. A considerable spike occurred at the time of
the pandemic, specifically the year 1918. Life expectancy in the United
States alone dropped by about 12 years.
[7][8][9][10]
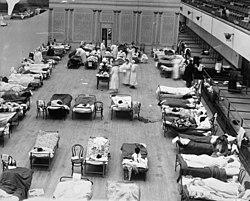
Most influenza outbreaks disproportionately kill juvenile, elderly,
or already weakened patients; in contrast, the 1918 pandemic
predominantly killed previously healthy young adults.
There are several possible explanations for the high mortality rate
of the 1918 influenza pandemic. Some research suggests that the specific
variant of the virus had an unusually aggressive nature. One group of
researchers recovered the original virus from the bodies of frozen
victims, and found that transfection in animals caused a rapid
progressive respiratory failure and death through a
cytokine storm (overreaction of the body's
immune system).
It was then postulated that the strong immune reactions of young adults
ravaged the body, whereas the weaker immune systems of children and
middle-aged adults resulted in fewer deaths among those groups.
More recent investigations, mainly based on original medical reports from the period of the pandemic,
[12][13]
found that the viral infection itself was not more aggressive than any
previous influenza, but that the special circumstances (malnourishment,
overcrowded medical camps and hospitals, poor hygiene) promoted
bacterial superinfection that killed most of the victims typically after
a somewhat prolonged death bed.
[14][15]
Historical and
epidemiological data are inadequate to identify the pandemic's geographic origin. It was implicated in the outbreak of
encephalitis lethargica in the 1920s.
To maintain morale,
wartime censors minimized early reports of illness and mortality in Germany, the United Kingdom, France, and the United States.
[18] However, papers were free to report the epidemic's effects in neutral Spain (such as the grave illness of
King Alfonso XIII). This reporting dichotomy created a false impression of Spain as especially hard hit, thereby giving rise to the pandemic's nickname,
Spanish Flu. In Spain, a different nickname was adopted, the Naples Soldier (
Soldado de Nápoles), which came from a musical operetta (zarzuela) titled
La canción del olvido (
The Song of Forgetting), which premiered in Madrid during the first epidemic wave.
Federico Romero, one of the librettists, quipped that the play's most popular musical number,
Naples Soldier, was as catchy as the flu.
History
Hypotheses about source
The site of the very first confirmed outbreak was at Camp Funston,
Fort Riley,
Kansas,
then a military training facility preparing American troops for
involvement in World War I. The first victim diagnosed with the new
strain of flu on Monday, March 11, 1918, was mess cook Private Albert
Gitchell.
[23][24] Historian
Alfred W. Crosby recorded that the flu originated in Kansas, and popular writer
John Barry echoed Crosby in describing
Haskell County, Kansas, as the point of origin.
In contrast, investigative work in 1999 by a British team led by
virologist John Oxford[27] of
St Bartholomew's Hospital and the
Royal London Hospital identified the major troop staging and hospital camp in
Étaples,
France, as being the center of the 1918 flu pandemic. These researchers
postulated that a significant precursor virus, harbored in birds,
mutated to pigs that were kept near the front.
[28]
Earlier hypotheses of the epidemic's origin have varied. Some hypothesized the flu originated in East Asia.
[29][30] Dr. C. Hannoun, leading expert of the 1918 flu for the
Institut Pasteur, asserted the former virus was likely to have come from China, mutating in the United States near
Boston and spreading to
Brest, France, Europe's battlefields, Europe, and the world using Allied soldiers and sailors as main spreaders.
[31] He considered several other hypotheses of origin, such as Spain,
Kansas, and Brest, as being possible, but not likely.
Political scientist
Andrew Price-Smith published data from the
Austrian archives suggesting the influenza had earlier origins, beginning in
Austria in the spring of 1917.
In 2014, historian Mark Humphries of Canada's
Memorial University of Newfoundland stated that newly unearthed records confirmed that one of the side stories of the war, the mobilization of 96,000
Chinese laborers
to work behind the British and French lines on World War I's western
front, might have been the source of the pandemic. In the report,
Humphries found archival evidence that a respiratory illness that struck
northern China in November 1917 was identified a year later by Chinese
health officials as identical to the Spanish flu.
[34] However, a report published in 2016 in the Journal of the
Chinese Medical Association
found no evidence that the 1918 virus was imported to Europe from
Chinese and Southeast Asian soldiers and workers. In fact, it found
evidence that the virus had been circulating in the European armies for
months and potentially years before the 1918 pandemic.
[35]
Spread
When an infected person sneezes or coughs, more than half a million virus particles can be spread to those close by.
[36] The close quarters and massive troop movements of
World War I
hastened the pandemic, and probably both increased transmission and
augmented mutation; the war may also have increased the lethality of the
virus. Some speculate the soldiers' immune systems were weakened by
malnourishment, as well as the stresses of combat and chemical attacks,
increasing their susceptibility.
A large factor in the worldwide occurrence of this flu was increased
travel. Modern transportation systems made it easier for soldiers,
sailors, and civilian travelers to spread the disease.
[38]
In the United States, the disease was first observed in
Haskell County, Kansas,
in January 1918, prompting local doctor Loring Miner to warn the U.S.
Public Health Service's academic journal. On 4 March 1918, company cook
Albert Gitchell reported sick at
Fort Riley, Kansas. By noon on 11 March 1918, over 100 soldiers were in the hospital.
[39] Within days, 522 men at the camp had reported sick.
[40] By 11 March 1918, the virus had reached
Queens, New York.
[41] Failure to take preventative measures in March/April was later criticised.
In August 1918, a more virulent strain appeared simultaneously in
Brest, France; in
Freetown, Sierra Leone; and in the U.S. in
Boston, Massachusetts. The Spanish flu also spread through Ireland, carried there by returning Irish soldiers. The
Allies of World War I
came to call it the Spanish flu, primarily because the pandemic
received greater press attention after it moved from France to Spain in
November 1918. Spain was not involved in the war and had not imposed
wartime
censorship.
[42]
Mortality
Around the globe
The difference between the influenza mortality age-distributions of the
1918 epidemic and normal epidemics – deaths per 100,000 persons in each
age group, United States, for the interpandemic years 1911–1917 (dashed
line) and the pandemic year 1918 (solid line)
Three pandemic waves: weekly combined influenza and pneumonia mortality, United Kingdom, 1918–1919
The global
mortality rate
from the 1918/1919 pandemic is not known, but an estimated 10% to 20%
of those who were infected died. With about a third of the world
population infected, this
case-fatality ratio means 3% to 6% of the entire global population died.
Influenza may have killed as many as 25 million people in its first 25
weeks. Older estimates say it killed 40–50 million people, while current estimates say 50–100 million people worldwide were killed.
This
pandemic has been described as "the greatest medical holocaust in history" and may have killed more people than the
Black Death.
It is said that this flu killed more people in 24 weeks than AIDS
killed in 24 years, and more in a year than the Black Death killed in a
century.
The disease killed in every corner of the globe. As many as 17 million died in
India, about 5% of the population.
[47] The death toll in
India's British-ruled districts alone was 13.88 million.
[48]
In Japan, of the 23 million people who were affected, 390,000 died.
[49] In the
Dutch East Indies (now
Indonesia), 1.5 million were assumed to have died among 30 million inhabitants.
[50] In
Tahiti 13% of the population died during only a month. Similarly, in
Samoa 22% of the population of 38,000 died within two months.
In the U.S., about 28% of the population became infected, and 500,000 to 675,000 died.
[52] Native American tribes were particularly hard hit. In the
Four Corners area alone, 3,293 deaths were registered among Native Americans.
[53] Entire village communities perished in
Alaska.
[54] In Canada 50,000 died.
[55] In Brazil 300,000 died, including president
Rodrigues Alves.
[56] In Britain, as many as 250,000 died; in France, more than 400,000.
[57] In West Africa an influenza epidemic killed at least 100,000 people in
Ghana. Tafari Makonnen (the future
Haile Selassie, Emperor of Ethiopia) was one of the first
Ethiopians who contracted influenza but survived,
[59] although many of his family's subjects did not; estimates for the fatalities in the capital city,
Addis Ababa, range from 5,000 to 10,000, or higher. In
British Somaliland one official estimated that 7% of the native population died.
This huge death toll was caused by an extremely high infection rate
of up to 50% and the extreme severity of the symptoms, suspected to be
caused by
cytokine storms. Symptoms in 1918 were so unusual that initially influenza was misdiagnosed as
dengue,
cholera, or
typhoid.
One observer wrote, "One of the most striking of the complications was
hemorrhage from mucous membranes, especially from the nose, stomach, and
intestine. Bleeding from the ears and
petechial hemorrhages in the skin also occurred". The majority of deaths were from
bacterial pneumonia,
[63] a common
secondary infection associated with influenza, but the virus also killed people directly, by causing massive
hemorrhages and
edema in the lung.
The unusually severe disease killed up to 20% of those infected, as opposed to the usual flu epidemic
mortality rate of 0.1%.
Patterns of fatality
An unusual feature of this pandemic was that it mostly killed young
adults. In 1918–1919, 99% of pandemic influenza deaths in the US
occurred in people under 65, and nearly half in young adults 20 to
40 years old. In 1920 the mortality rate among people under 65 had
decreased six-fold to half the mortality rate of people over 65, but
still 92% of deaths occurred in people under 65. This is noteworthy, since influenza is normally most deadly to weak individuals, such as
infants (under age two), the very old (over age 70), and the
immunocompromised. In 1918, older adults may have had partial protection caused by exposure to the
1889–1890 flu pandemic, known as the Russian flu.
[66] According to historian John M. Barry, the most vulnerable of all –
"those most likely, of the most likely", to die – were pregnant women.
He reported that in thirteen studies of hospitalized women in the
pandemic, the death rate ranged from 23% to 71%.
[67] Of the pregnant women who survived childbirth, over one-quarter (26%) lost the child.
Another oddity was that the outbreak was widespread in the summer and autumn (in the
Northern Hemisphere); influenza is usually worse in winter.
[69]
Modern analysis has shown the virus to be particularly deadly because it triggers a
cytokine storm, which ravages the stronger immune system of young adults.
In fast-progressing cases, mortality was primarily from
pneumonia, by virus-induced pulmonary
consolidation. Slower-progressing cases featured secondary bacterial pneumonias, and there may have been
neural involvement that led to
mental disorders in some cases. Some deaths resulted from malnourishment.
A study – conducted by He et al. – used a mechanistic modelling
approach to study the three waves of the 1918 influenza pandemic. They
tried to study the factors that underlie variability in temporal
patterns, and the patterns of mortality and morbidity. Their analysis
suggests that temporal variations in transmission rate provide the best
explanation and the variation in transmission required to generate these
three waves is within biologically plausible values.
Another study by He et al. used a simple epidemic model, to
incorporate three factors including: school opening and closing,
temperature changes over the course of the outbreak, and human
behavioral changes in response to the outbreak to infer the cause of the
three waves of the 1918 influenza pandemic. Their modelling results
showed that all three factors are important but human behavioral
responses showed the largest effects.
Deadly second wave
The second wave of the 1918 pandemic was much deadlier than the
first. The first wave had resembled typical flu epidemics; those most at
risk were the sick and elderly, while younger, healthier people
recovered easily. But in August, when the second wave began in France,
Sierra Leone and the United States,
[72] the virus had
mutated to a much deadlier form.
This increased severity has been attributed to the circumstances of the First World War.
In civilian life, natural selection favours a mild strain. Those who
get very ill stay home, and those mildly ill continue with their lives,
preferentially spreading the mild strain. In the trenches, natural
selection was reversed. Soldiers with a mild strain stayed where they
were, while the severely ill were sent on crowded trains to crowded
field hospitals, spreading the deadlier virus. The second wave began and
the flu quickly spread around the world again. Consequently, during
modern pandemics health officials pay attention when the virus reaches
places with social upheaval (looking for deadlier strains of the virus).
The fact that most of those who recovered from first-wave infections were now
immune showed that it must have been the same strain of flu. This was most dramatically illustrated in
Copenhagen,
which escaped with a combined mortality rate of just 0.29% (0.02% in
the first wave and 0.27% in the second wave) because of exposure to the
less-lethal first wave.
[75]
On the rest of the population it was far more deadly now; the most
vulnerable people were those like the soldiers in the trenches – young
previously healthy adults.
Devastated communities
A chart of deaths in major cities, showing a peak in the autumn of 1918.
Even in areas where mortality was low, so many were incapacitated
that much of everyday life was hampered. Some communities closed all
stores or required customers to leave orders outside. There were reports
that the health-care workers could not tend the sick nor the
gravediggers bury the dead because they too were ill. Mass graves were
dug by
steam shovel and bodies buried without coffins in many places.
[77]
Several
Pacific island
territories were particularly hard-hit. The pandemic reached them from
New Zealand, which was too slow to implement measures to prevent
ships carrying the flu from leaving its ports. From New Zealand, the flu reached
Tonga (killing 8% of the population),
Nauru (16%) and
Fiji (5%, 9,000 people).
Worst affected was
German Samoa, today the independent state of
Samoa, which had been
occupied by New Zealand
in 1914. A crippling 90% of the population was infected; 30% of adult
men, 22% of adult women and 10% of children died. By contrast, the flu
was kept away from
American Samoa when
Governor John Martin Poyer imposed a blockade.
In New Zealand itself, 8,573 deaths were attributed to the 1918
pandemic influenza, resulting in a total population fatality rate of
0.74%.
In Ireland, the Spanish Flu accounted for 10% of the total deaths in
1918 which can be seen as quite detrimental considering World War 1 was
still occurring.
Less-affected areas
In Japan, 257,363 deaths were attributed to influenza by July 1919,
giving an estimated 0.425% mortality rate, much lower than nearly all
other Asian countries for which data are available. The Japanese
government severely restricted maritime travel to and from the home
islands when the pandemic struck.
In the Pacific,
American Samoa[80] and the French colony of
New Caledonia[81] also succeeded in preventing even a single death from influenza through effective
quarantines. In Australia, nearly 12,000 perished.
[82]
By the end of the pandemic, the isolated island of
Marajó, in Brazil's Amazon River Delta had not reported an outbreak.
[83]
Aspirin poisoning
In a 2009 paper published in the journal
Clinical Infectious Diseases, Karen Starko proposed that
aspirin poisoning
had contributed substantially to the fatalities. She based this on the
reported symptoms in those dying from the flu, as reported in the post
mortem reports still available, and also the timing of the big "death
spike" in October 1918 which happened right after the
Surgeon General of the United States Army, and the
Journal of the American Medical Association both recommended very large doses of 8.0–31.2 g of aspirin per day. Starko also suggests that the wave of aspirin poisonings was due to a "
perfect storm" of events:
Bayer's
patent on aspirin expired, so that many companies rushed in to make a
profit and greatly increased the supply; this coincided with the flu
pandemic; and the symptoms of aspirin poisoning were not known at the
time.
As an explanation for the
universally high mortality rate,
this hypothesis was questioned in a letter to the journal published in
April 2010 by Andrew Noymer and Daisy Carreon of the
University of California, Irvine, and Niall Johnson of the
Australian Commission on Safety and Quality in Health Care.
They questioned this universal applicability given the high mortality
rate in countries such as India, where there was little or no access to
aspirin at the time. They concluded that "the
salicylate
[aspirin] poisoning hypothesis [was] difficult to sustain as the
primary explanation for the unusual virulence of the 1918–1919 influenza
pandemic".
But they overlooked that inexpensive aspirin had become available in
India and other places after October 1918, when the Bayer patent
expired. In responding, Starko pointed to anecdotal evidence of aspirin
over-prescription in India and argued that even if aspirin
over-prescription had not contributed to the high Indian mortality rate,
it could still have been a major factor for other high rates in areas
where other exacerbating factors present in India played less of a role.
End of the pandemic
After the lethal second wave struck in late 1918, new cases dropped
abruptly – almost to nothing after the peak in the second wave.
In Philadelphia, for example, 4,597 people died in the week ending 16
October, but by 11 November, influenza had almost disappeared from the
city. One explanation for the rapid decline of the lethality of the
disease is that doctors simply got better at preventing and treating the
pneumonia that developed after the victims had contracted the virus,
although John Barry stated in his book that researchers have found no
evidence to support this.
Another theory holds that the 1918 virus mutated extremely rapidly to
a less lethal strain. This is a common occurrence with influenza
viruses: there is a tendency for pathogenic viruses to become less
lethal with time, as the hosts of more dangerous strains tend to die out (see also
"Deadly Second Wave", above).
Legacy
Academic
Andrew Price-Smith
has made the argument that the virus helped tip the balance of power in
the later days of the war towards the Allied cause. He provides data
that the viral waves hit the Central Powers before they hit the Allied
powers, and that both
morbidity and
mortality in Germany and Austria were considerably higher than in Britain and France.
In the United States, Britain and other countries, despite the
relatively high morbidity and mortality rates that resulted from the
epidemic in 1918–1919, the Spanish flu began to fade from public
awareness over the decades until the arrival of news about
bird flu and other pandemics in the 1990s and 2000s. This has led some historians to label the Spanish flu a "forgotten pandemic".
Various theories of why the Spanish flu was "forgotten" include the
rapid pace of the pandemic, which killed most of its victims in the
United States, for example, within a period of less than nine months,
resulting in limited media coverage. The general population was familiar
with patterns of pandemic disease in the late 19th and early 20th
centuries:
typhoid,
yellow fever,
diphtheria, and
cholera all occurred near the same time. These outbreaks probably lessened the significance of the influenza pandemic for the public. In some areas, the flu was not reported on, the only mention being that of advertisements for medicines claiming to cure it.
In addition, the outbreak coincided with the deaths and media focus on the First World War.
Another explanation involves the age group affected by the disease. The
majority of fatalities, from both the war and the epidemic, were among
young adults. The deaths caused by the flu may have been overlooked due
to the large numbers of deaths of young men in the war or as a result of
injuries. When people read the obituaries, they saw the war or postwar
deaths and the deaths from the influenza side by side. Particularly in
Europe, where the war's toll was extremely high, the flu may not have
had a great, separate, psychological impact, or may have seemed a mere
extension of the war's tragedies.
The duration of the pandemic and the war could have also played a
role. The disease would usually only affect a certain area for a month
before leaving, while the war, which most had initially expected to end
quickly, had lasted for four years by the time the pandemic struck. This
left little time for the disease to have a significant impact on the
economy.
Regarding global economic effects, many businesses in the
entertainment and service industries suffered losses in revenue, while
the health care industry reported profit gains.
Historian Nancy Bristow has argued that the pandemic, when combined
with the increasing number of women attending college, contributed to
the success of women in the field of nursing. This was due in part to
the failure of medical doctors, who were predominantly men, to contain
and prevent the illness. Nursing staff, who were predominantly women,
felt more inclined to celebrate the success of their patient care and
less inclined to identify the spread of the disease with their own work.
[92]
In Spain, sources from the period explicitly linked the Spanish flu to the cultural figure of
Don Juan. The nickname for the flu, the "Naples Soldier", was adopted from Federico Romero and
Guillermo Fernández Shaw's operetta,
The Song of Forgetting (
La canción del olvido),
the protagonist of which is a stock Don Juan type. Davis has argued the
Spanish flu–Don Juan connection served a cognitive function, allowing
Spaniards to make sense of their epidemic experience by interpreting it
through a familiar template, namely the Don Juan story.
Spanish flu research
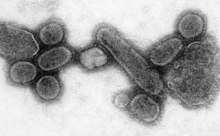
An electron micrograph showing recreated 1918 influenza virions.
The origin of the Spanish flu pandemic, and the relationship between
the near-simultaneous outbreaks in humans and swine, have been
controversial. One hypothesis is that the virus strain originated at
Fort Riley,
Kansas,
in viruses in poultry and swine which the fort bred for food; the
soldiers were then sent from Fort Riley around the world, where they
spread the disease.
[94]
Similarities between a reconstruction of the virus and avian viruses,
combined with the human pandemic preceding the first reports of
influenza in swine, led researchers to conclude the influenza virus
jumped directly from birds to humans, and swine caught the disease from
humans.
[95]
Others have disagreed, and more recent research has suggested the strain may have originated in a nonhuman, mammalian species. An estimated date for its appearance in mammalian hosts has been put at the period 1882–1913. This ancestor virus diverged about 1913–1915 into two
clades (or biological groups), which gave rise to the classical swine and human
H1N1
influenza lineages. The last common ancestor of human strains dates to
between February 1917 and April 1918. Because pigs are more readily
infected with avian influenza viruses than are humans, they were
suggested as the original recipients of the virus, passing the virus to
humans sometime between 1913 and 1918.
An effort to recreate the 1918 flu strain (a subtype of avian strain H1N1) was a collaboration among the
Armed Forces Institute of Pathology, the
USDA ARS Southeast Poultry Research Laboratory and
Mount Sinai School of Medicine in
New York City.
The effort resulted in the announcement (on 5 October 2005) that the
group had successfully determined the virus's genetic sequence, using
historic tissue samples recovered by pathologist
Johan Hultin from a female flu victim buried in the Alaskan
permafrost and samples preserved from American soldiers.
[100]
On 18 January 2007, Kobasa et al. (2007) reported that monkeys (
Macaca fascicularis) infected with the recreated flu strain exhibited classic symptoms of the 1918 pandemic, and died from a
cytokine storm—an overreaction of the
immune system.
This may explain why the 1918 flu had its surprising effect on younger,
healthier people, as a person with a stronger immune system would
potentially have a stronger overreaction.
[102]
On 16 September 2008, the body of British politician and diplomat
Sir Mark Sykes was exhumed to study the RNA of the flu virus in efforts to understand the genetic structure of modern
H5N1 bird flu. Sykes had been buried in 1919 in a lead coffin which scientists hoped had helped preserve the virus.
[103]
However, the coffin was found to be split because of the weight of soil
over it, and the cadaver was badly decomposed. Nonetheless, samples of
lung and brain tissue were taken through the split, with the coffin
remaining
in situ in the grave during this process.
[104]
In December 2008, research by
Yoshihiro Kawaoka of the
University of Wisconsin
linked the presence of three specific genes (termed PA, PB1, and PB2)
and a nucleoprotein derived from 1918 flu samples to the ability of the
flu virus to invade the lungs and cause pneumonia. The combination
triggered similar symptoms in animal testing.
In June 2010, a team at the Mount Sinai School of Medicine reported the
2009 flu pandemic vaccine provided some cross-protection against the 1918 flu pandemic strain.
One of the few things known for certain about the influenza in 1918
and for some years after was that it was, out of the laboratory,
exclusively a disease of human beings.
In 2013, the AIR Worldwide Research and Modeling Group "characterized
the historic 1918 pandemic and estimated the effects of a similar
pandemic occurring today using the AIR Pandemic Flu Model". In the
model, "a modern day "Spanish flu" event would result in additional life
insurance losses of between USD 15.3–27.8 billion in the United States
alone" with 188,000–337,000 deaths in the United States.
In popular culture
The 1995 film
Outbreak,
[109] the 2011 film
Contagion and the 2013 film
World War Z make reference to the pandemic.
[110]
The television show
Resurrection
uses the pandemic, in the episode "Afflictions" that aired on November
2, 2014, as the explanation for why many of the Returned were getting
sick and disappearing.
In season four of British drama
Upstairs, Downstairs,
Hazel Bellamy dies of Spanish flu in 1918, after her husband James
Bellamy survives injuries in the "Great War" (World War I). Her funeral
takes place on 11 November, the day the war ends.
In season two of British drama
Downton Abbey, Lavinia Swire dies of the Spanish flu in April 1919, after her fiancé
Matthew Crawley recovers from injuries and temporary paralysis from the Great War.
Twentieth-century fiction includes at least three novels with the flu pandemic as a major theme: Katherine Anne Porter's
Pale Horse, Pale Rider, Thomas Mullen's
The Last Town on Earth, and Thomas Wolfe's
Look Homeward, Angel.
In the one-act play
1918 by
Horton Foote (part of his
Orphans' Home Cycle
(1979)), the presence and threat of the flu (and the tragedy it
ultimately causes) is a major element of the plot. The play was made
into a
film of the same title, released in 1985, which was subsequently edited for broadcast by
PBS as the last part of the miniseries "The Story of A Marriage".


![\frac{N_i}{N} =
\frac{1}{Z}
\exp \left[
-\frac{p_{i, x}^2 + p_{i, y}^2 + p_{i, z}^2}{2mkT}
\right]](https://wikimedia.org/api/rest_v1/media/math/render/svg/8dc173ee0113a100c4713d64801c5f4d028cff71)
![f_\mathbf{p} (p_x, p_y, p_z) =
\frac{c}{Z}
\exp \left[
-\frac{p_x^2 + p_y^2 + p_z^2}{2mkT}
\right]](https://wikimedia.org/api/rest_v1/media/math/render/svg/c4d3859f110a3d7bdfd33719a5aaf1e6227212ed)

![f_\mathbf{p} (p_x, p_y, p_z) =
\left( 2 \pi mkT \right)^{-3/2}
\exp \left[
-\frac{p_x^2 + p_y^2 + p_z^2}{2mkT}
\right]](https://wikimedia.org/api/rest_v1/media/math/render/svg/76fdc75e9040e7fa2bb88d60729f7183c2b1bf1a)


![{\displaystyle f_{\epsilon }(\epsilon )\,d\epsilon ={\sqrt {\frac {1}{\pi \epsilon kT}}}~\exp \left[{\frac {-\epsilon }{kT}}\right]\,d\epsilon }](https://wikimedia.org/api/rest_v1/media/math/render/svg/9d0b957722f14b4f35ca02434218927e2ffff4d4)


![f_{{\mathbf {v}}}(v_{x},v_{y},v_{z})=\left({\frac {m}{2\pi kT}}\right)^{{3/2}}\exp \left[-{\frac {m(v_{x}^{2}+v_{y}^{2}+v_{z}^{2})}{2kT}}\right]](https://wikimedia.org/api/rest_v1/media/math/render/svg/efc0617ed7d78e1282e9dffef06398cadf8b74b9)


![f_v (v_i) =
\sqrt{\frac{m}{2 \pi kT}}
\exp \left[
\frac{-mv_i^2}{2kT}
\right].](https://wikimedia.org/api/rest_v1/media/math/render/svg/86a6d2151bda2079488be11059d0320477fb8eb8)


