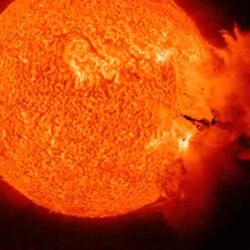
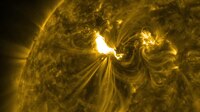
Superflares are very strong explosions observed on stars with energies up to ten thousand times that of typical solar flares. The stars in this class satisfy conditions which should make them solar analogues, and would be expected to be stable over very long time scales. The original nine candidates were detected by a variety of methods. No systematic study was possible until the launch of the Kepler satellite, which monitored a very large number of solar-type stars with very high accuracy for an extended period. This showed that a small proportion of stars had violent outbursts, up to 10,000 times as powerful as the strongest flares known on the Sun. In many cases there were multiple events on the same star. Younger stars were more likely to flare than old ones, but strong events were seen on stars as old as the Sun.
The flares were initially explained by postulating giant planets in very close orbits, such that the magnetic fields of the star and planet were linked. The orbit of the planet would warp the field lines
until the instability released magnetic field energy as a flare.
However, no such planet has showed up as a Kepler transit and this
theory has been abandoned.
All superflare stars show quasi-periodic brightness variations interpreted as very large starspots carried round by rotation. Spectroscopic studies found spectral lines that were clear indicators of chromospheric activity associated with strong and extensive magnetic fields. This suggests that superflares only differ in scale from solar flares.
Attempts have been made to detect past solar superflares from nitrate concentrations in polar ice, from historical observations of auroras, and from those radioactive isotopes that can be produced by solar energetic particles. Although two promising events have been found in the carbon-14 records in tree rings, it is not possible to associate them definitely with a superflare event.
Solar superflares would have drastic effects, especially if they occurred as multiple events. Since they can occur on stars of the same age, mass and composition as the Sun this cannot be ruled out. However, solar-type superflare stars are very rare and are magnetically much more active than the Sun; if solar superflares do occur, it may be in well-defined episodes that occupy a small fraction of its time.
Superflare stars
- The star is in spectral class F8 to G8
- It is on or near the main sequence
- It is single or part of a very wide binary
- It is not a rapid rotator
- It is not exceedingly young
Original superflare candidates
The original paper identified nine candidate objects from a literature search:| Star | Type | V (mag) | Detector | Flare Amplitude | Duration | Energy (erg) |
|---|---|---|---|---|---|---|
| Groombridge 1830 | G8 V | 6.45 | Photography | ΔB = 0.62 mag | 18 min | EB ~ 1035 |
| Kappa1 Ceti | G5 V | 4.83 | Spectroscopy | EW(He) = 0.13Å | ~ 40 min | E ~ 2 × 1034 |
| MT Tauri | G5 V | 16.8 | Photography | ΔU = 0.7 mag | ~ 10 min | EU ~ 1035 |
| Pi1 Ursae Majoris | G1.5 Vb | 5.64 | X-ray | LX = 1029 erg/s | >~ 35 min | EX = 2 × 1033 |
| S Fornacis | G1 V | 8.64 | Visual | ΔV ~ 3 mag | 17 - 367 min | EV ~ 2 × 1038 |
| BD +10°2783 | G0 V | 10.0 | X-ray | LX = 2 × 1031 erg/s | ~ 49 min | EX >> 3 × 1034 |
| Omicron Aquilae | F8 V | 5.11 | Photometry | ΔV = 0.09 mag | ~ 5 - 15 day | EBV ~ 9 × 1037 |
| 5 Serpentis | F8 IV-V | 5.06 | Photometry | ΔV = 0.09 mag | ~ 3 - 25 day | EBV ~ 7 × 1037 |
| UU Coronae Borealis | F8 V | 8.86 | Photometry | ΔI = 0.30 mag | >~ 57 min | Eopt ~ 7 × 1035 |
V (mag) means the normal apparent visual magnitude of the star.
EW(He) is the equivalent width of the 5875.6Å He I D3 line seen in emission.
The observations vary for each object. Some are X-ray measurements, others are visual, photographic, spectroscopic or photometric. The energies for the events vary from 2 × 1033 to 2 × 1038 ergs.
Kepler discoveries
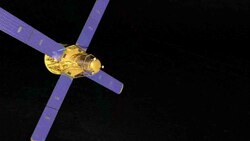
The Kepler spacecraft is a space observatory designed to find planets by the method of transits. A photometer continually monitors the brightness of 150,000 stars in a fixed area of the sky (in the constellations of Cygnus, Lyra and Draco) to detect changes in brightness caused by planets passing in front of the stellar disc. More than 90,000 are G-type stars (similar to the Sun) on or near the main sequence. The observed area corresponds to about 0.25% of the entire sky. The photometer is sensitive to wavelengths of 400–865 nm: the entire visible spectrum and part of the infrared. The photometric accuracy achieved by Kepler is typically 0.01% (0.1 mmag) for 30 minute integration times of 12th magnitude stars.G-type stars
The high accuracy, the large number of stars observed and the long period of observation make Kepler ideal for detecting superflares. Studies published in 2012 and 2013 involved 83,000 stars over a period of 500 days (much of the data analysis was carried out with the help of five first-year undergraduates). The stars were selected from the Kepler Input Catalog to have Teff, the effective temperature, between 5100 and 6000K (the solar value is 5750K) to find stars of similar spectral class to the Sun, and the surface gravity log g > 4.0 to eliminate sub-giants and giants. The spectral classes range from F8 to G8. The integration time was 30 min in the original study. 1547 superflares were found on 279 solar-type stars.The most intense events increased the brightness of the stars by 30% and had an energy of 1036 ergs. White-light flares on the Sun change the brightness by about 0.01%, and the strongest flares have a visible-light energy of about 1032 ergs. (All energies quoted are in the optical bandpass and so are lower limits since some energy is emitted at other wavelengths.) Most events were much less energetic than this: flare amplitudes below 0.1% of the stellar value and energies of 2 × 1033 ergs were detectable with the 30 minute integration. The flares had a rapid rise followed by an exponential decay on a time scale of 1–3 hours. The most powerful events corresponded to energies ten thousand greater than the largest flares observed on the Sun. Some stars flared very frequently: one star showed 57 events in 500 days, a rate of one every nine days. For the statistics of flares, the number of flares decreased with energy E roughly as E−2, a similar behaviour to solar flares. The duration of the flare increased with its energy, again in accordance with the solar behaviour.Some Kepler data is taken at one minute sampling, though inevitably with lower accuracy. Using this data, on a smaller sample of stars, reveals flares that are too brief for reliable detection with 30-min integrations, allowing detection of events as low as 1032 ergs, comparable with the brightest flares on the Sun. The occurrence frequency as a function of energy remains a power law E−n when extended to lower energies, with n around 1.5. At this time resolution some superflares show multiple peaks with separations of 100 to 1000 seconds, again comparable to the pulsations in solar flares. The star KIC 9655129 showed two periods, of 78 and 32 minutes, suggesting magnetohydrodynamic oscillations in the flaring region. These observations suggest that superflares are different only in scale and not in type to solar flares.
Superflare stars show a quasi-periodic brightness variation, which is interpreted as evidence of starspots carried around by solar rotation. This allows an estimate of the rotation period of the star; values range from less than one day up to tens of days (the value for the Sun is 25 days). On the Sun, radiometer monitoring from satellites shows that large sunspots can reduce the brightness by up to 0.2%. In superflare stars the most common brightness variations are 1-2%, though they can be as great as 7-8%, suggesting that the area of the starspots can be very much larger than anything found on the Sun. In some cases the brightness variations can be modelled by only one or two large starspots, though not all cases are so simple. The starspots could be groups of smaller spots or single giant spots.
Flares are more common in stars with short periods. However, the energy of the largest flares is not related to the period of rotation. Stars with larger variations also have much more frequent flares; there is as well a tendency for them to have more energetic flares. Large variations can be found on even the most slowly rotating stars: one star had a rotation period of 22.7 days and variations implying spot coverage of 2.5% of the surface, over ten times greater than the maximum solar value. By estimating the size of the starspots from the amplitude variation, and assuming solar values for the magnetic fields in the spots (1000 G), it is possible to estimate the energy available: in all cases there is enough energy in the field to power even the largest flares observed. This suggests that superflares and solar flares have essentially the same mechanism.
In order to determine whether superflares can occur on the Sun, it is important to narrow the definition of Sun-like stars. When the temperature range is divided into stars with Teff above and below 5600K (early and late G-type stars), stars of lower temperature are about twice as likely to show superflare activity as those in the solar range and those that do so have more flares: the occurrence frequency of flares (number per star per year) is about five times as great in the late-type stars. It is well known that both the rotation rate and the magnetic activity of a star decrease with age in G-type stars. When flare stars are divided into fast and slow rotators, using the rotation period estimated from brightness variations, there is a general tendency for the fastest-rotating (and presumably youngest) stars to show a greater probability of activity: in particular, stars rotating in less than 10 days are 20-30 times more likely to have activity. Nevertheless, 44 superflares were found on 19 stars with similar temperatures to the Sun and periods greater than 10 days (out of 14000 such stars examined); four superflares with energies in the range 1-5 × 1033 ergs were detected on stars rotating more slowly than the Sun (of about 5000 in the sample). The distribution of flares with energy has the same shape for all classes of star: although Sun-like stars are less likely to flare, they have the same proportion of very energetic flares as younger and cooler stars.
K and M type stars
Kepler data have also been used to search for flares on stars of later spectral types than G. A sample of 23,253 stars with effective temperature Teff less than 5150K and surface gravity log g > 4.2, corresponding to main sequence stars later than K0V, was examined for flares over a time period of 33.5 days. 373 stars were identified as having obvious flares. Some stars had only one flare, while others showed as many as fifteen. The strongest events increased the brightness of the star by 7-8%. This is not radically different from the peak brightness of flares on G-type stars; however, since K and M stars are less luminous than type G, this suggests that flares on these stars are less energetic. Comparing the two classes of stars studied, it seems that M stars flare more frequently than K stars but the duration of each flare tends to be shorter. It is not possible to draw any conclusions about the relative proportion of G and K type stars showing superflares, or about the frequency of flares on those stars that do show such activity, since the flare detection algorithms and criteria in the two studies are quite different.Most (though not all) of the K and M stars show the same quasi-periodic brightness variations as the G stars. There is a tendency for more energetic flares to occur on more variable stars; however flare frequency is only weakly related to variability.
Hot Jupiters as an explanation
When superflares were originally discovered on solar-type stars it was suggested that these eruptions may be produced by the interaction of the star's magnetic field with the magnetic field of a gas-giant planet orbiting so close to the primary that the magnetic fields were linked. Rotation or orbital motion would wind up the magnetic fields until a reconfiguration of the fields would cause an explosive release of energy. The RS Canum Venaticorum variables are close binaries, with orbital periods between 1 and 14 days, in which the primary is an F- or G-type main sequence star, and with strong chromospheric activity at all orbital phases. These systems have brightness variations attributed to large starspots on the primary; some show large flares thought to be caused by magnetic reconnection. The companion is close enough to spin up the star by tidal interactions.A gas giant however would not be massive enough to do this, leaving the various measurable properties of the star (rotation speed, chromospheric activity) unchanged. If the giant and the primary were close enough for the magnetic fields to be linked, the orbit of the planet would wrap the field lines until the configuration became unstable followed by a violent release of energy in the form of a flare. Kepler discovered a number of closely orbiting gas giants, known as hot Jupiters; studies of two such systems showed periodic variations of the chromospheric activity of the primary synchronised to the period of the companion.
Not all planetary transits can be detected by Kepler, since the planetary orbit may be out of the line of sight to Earth. However, the hot Jupiters orbit so close to the primary that the chance of a transit is about 10%. If superflares were caused by close planets the 279 flare stars discovered should have about 28 transiting companions; none of them actually showed evidence of transits, effectively excluding this explanation.
Spectroscopic observations of superflare stars
Spectroscopic studies of superflares allow their properties to be determined in more detail, in the hope of detecting the cause of the flares. The first studies were made using the high dispersion spectrograph on the Subaru telescope in Hawaii. Some 50 apparently solar-type stars, known from the Kepler observations to show superflare activity, have been examined in detail. Of these, only 16 showed evidence of being visual or spectroscopic binaries; these were excluded since close binaries are frequently active, while in the case of visual binaries there is the chance of activity taking place on the companion. Spectroscopy allows accurate determinations of the effective temperature, the surface gravity and the abundance of elements beyond helium ('metallicity'); most of the 34 single stars proved to be main sequence stars of spectral type G and similar composition to the Sun. Since properties such as temperature and surface gravity change over the lifetime of a star, stellar evolution theory allows an estimate of the age of a star: in most cases the age appeared to be above several hundred million years. This is important since very young stars are known to be much more active. Nine of the stars conformed to the narrower definition of solar-type given above, with temperatures greater than 5600K and rotation periods longer than 10 days; some had periods above 20 or even 30 days. Only five of the 34 could be described as fast rotators.Observations from LAMOST have been used to measure chromospheric activity of 5,648 solar-like stars in the Kepler field, including 48 superflare stars. These observations show that superflare stars are generally characterized by larger chromospheric emissions than other stars, including the Sun. However, superflare stars with activity levels lower than, or comparable to, the Sun do exist, suggesting that solar flares and superflares most likely share the same origin. The very large ensemble of solar-like stars included in this study enables detailed and robust estimates of the relation between chromospheric activity and the occurrence of superflares.
All the stars showed the quasi-periodic brightness variations, ranging from 0.1% to nearly 10%, interpreted as the rotation of large starspots. When large spots exist on a star, the activity level of the chromosphere becomes high; in particular, large chromospheric plages form around sunspot groups. The intensities of certain solar and stellar lines generated in the chromosphere, particularly the lines of ionised calcium (Ca II) and the Hα line of hydrogen, are known to be indicators of magnetic activity. Observations of the Ca lines in stars of similar age to the Sun even show cyclic variations reminiscent of the 11 year solar cycle. By observing certain infrared lines of Ca II for the 34 superflare stars it was possible to estimate their chromospheric activity. Measurements of the same lines at points within an active region on the Sun, together with simultaneous measurements of the local magnetic field, show that there is a general relation between field and activity.
Although the stars show a clear correlation between rotational speed and activity, this does not exclude activity on slowly rotating stars: even stars as slow as the Sun can have high activity. All the superflare stars observed had more activity than the Sun, implying larger magnetic fields. There is also a correlation between the activity of a star and its brightness variations (and therefore the starspot coverage): all stars with large amplitude variations showed high activity.
Knowing the approximate area covered by starspots from the size of the variations, and the field strength estimated from the chromospheric activity, allows an estimate of the total energy stored in the magnetic field; in all cases there was enough energy stored in the field to account for even the largest superflares. Both the photometric and the spectroscopic observations are consistent with the theory that superflares are different only in scale from solar flares, and can be accounted for by the release of magnetic energy in active regions very much larger than those on the Sun. Nevertheless, these regions can appear on stars with masses, temperatures, compositions, rotation speeds and ages similar to the Sun.
Detecting past superflares on the Sun
Since stars apparently identical to the Sun can produce superflares it is natural to ask if the Sun itself can do so, and to try to find evidence that it has done in the past. Large flares are invariably accompanied by energetic particles, and these particles produce effects if they reach the earth. The Carrington event of 1859, the largest flare of which we have direct observation, produced global auroral displays extending close to the equator. Energetic particles can produce chemical changes in the atmosphere, which can be permanently recorded in the polar ice. Fast protons generate distinctive isotopes, particularly carbon-14, which can be taken up and preserved by living creatures.Nitrate concentrations in polar ice
When solar energetic particles reach the Earth's atmosphere they cause ionisation that creates nitric oxide (NO) and other reactive nitrogen species, which then precipitate out in the form of nitrates. Since all energetic particles are deflected to a greater or lesser extent by the geomagnetic field, they enter preferentially at the polar latitudes; since high latitudes also contain permanent ice, it is natural to look for the nitrate signature of particle events in ice cores. A study of a Greenland ice core extending back to 1561 AD achieved resolutions of 10 or 20 samples a year, allowing in principle the detection of single events. Precise dates (within one or two years) can be achieved by counting annual layers in the cores, checked by identification of deposits associated with known volcanic eruptions. The core contained an annual variation of nitrate concentration, accompanied by a number of 'spikes' of different amplitudes. The strongest of these in the entire record was dated to within a few weeks of the Carrington event of 1859. However, other events can produce nitrate spikes, including biomass burning which also produces enhanced ammonium concentrations. An examination of fourteen ice cores from Antarctic and Arctic regions showed large nitrate spikes: however, none of them were dated to 1859 (the closest was 1863). All such spikes were associated with ammonium and other chemical indicators of combustion. There is no evidence that nitrate concentrations can be used as indicators of historic solar activity.Single events from cosmogenic isotopes
When energetic protons enter the atmosphere they create isotopes by reactions with the major components; the most important of these is carbon-14 (14C), which is created when secondary neutrons react with nitrogen. 14C, which has a half-life of 5,730 years, reacts with oxygen to form carbon dioxide which is taken up by plants; dating wood by its 14C content is the basis of radiocarbon dating. If wood of known age is available the process can be reversed. Measuring the 14C content and using the half-life allows estimation of the content when the wood was formed. The growth rings of trees show patterns, caused by various environmental factors: dendrochronology uses these growth rings of trees, compared across overlapping sequences, to establish accurate dates. Applying this method shows that atmospheric 14C does indeed vary with time, due to solar activity. This is the basis of the carbon dating calibration curve. Clearly, it can also be used to detect any peaks in production caused by solar flares, if those flares create enough energetic particles to produce a measurable increase in 14C.An examination of the calibration curve, which has a time resolution of five years, showed three intervals in the last 3,000 years in which 14C increased significantly. On the basis of this two Japanese cedar trees were examined with a resolution of a single year, and showed an increase of 1.2% in AD 774, some twenty times larger than anything expected from the normal solar variation. This peak steadily diminished over the next few years. The result was confirmed by studies of German oak, bristlecone pine from California, Siberian larch, and Kauri wood from New Zealand. All determinations agreed on both the time and amplitude of the effect. In addition, measurements of coral skeletons from the South China Sea showed substantial variations in 14C over a few months around the same time; however, the date could only be established to within a period of ±14 years around 783 AD.
Carbon-14 is not the only isotope that can be produced by energetic particles. Beryllium-10 (10Be) is also formed from nitrogen and oxygen, and deposited in polar ice. However, 10Be deposition can be strongly related to local weather and shows extreme geographic variability; it is also more difficult to assign dates. Nevertheless, a 10Be increase during the 770s was found in an ice core from the Antarctic, though the signal was less striking because of the lower time resolution (several years); another smaller increase was seen in Greenland. When data from two sites in North Greenland and one in the West Antarctic, all taken with a one-year resolution, were compared they all showed a strong signal: the time profile also matched well with the 14C results (within the uncertainty of dating for the 10Be data).[20] Chlorine-36 (36Cl) can be produced from argon and deposited in polar ice; because argon is a minor atmospheric constituent the abundance is low. The same ice cores which showed 10Be also provided increases of 36Cl, though with a resolution of five years a detailed match was impossible.
A second event in AD 993/4 has also been found from 14C in tree rings, but at a lower intensity. This event also produced measurable increases in 10Be and 36Cl in Greenland ice cores.
If these events are presumed to be produced by fast particles from large flares, it is not easy to estimate the particle energy in the flare or compare it with known events. The Carrington event does not appear in the 14C record, and neither did any other large particle event that has been directly observed. The flux of particles must be estimated by calculating production rates of radiocarbon, and then modelling the behaviour of the CO2 once it has entered the carbon cycle; the fraction of the created radiocarbon taken up by trees depends to some extent on that cycle. As an extra complication, the cosmogenic isotopes are preferentially created by energetic protons (several hundred MeV). The energetic particle spectrum of a solar flare varies considerably between events; one with a 'hard' spectrum, with more high-energy protons, will be more efficient at producing a 14C increase. The most powerful flare which also had a hard spectrum that has been observed instrumentally took place in February 1956 (the beginning of nuclear testing obscures any possible effects in the 14C record); it has been estimated that if a single flare were responsible for the AD 774/5 event it would need to be 25-50 times more powerful than this. A sunspot group may produce several flares over its lifetime, and the effects of such a sequence would be aggregated over the one-year period covered by a single 14C measurement; however, the total effect would still be ten times greater than anything observed in a similar period in modern times.
Solar flares are not the only possibility for producing the cosmogenic isotopes. A long or short gamma-ray burst has been proposed as being consistent with all the details of the AD 774/5 event if it was sufficiently close. However, as known presently, this explanation is very unlikely.
Historical records
A number of attempts have been made to find additional evidence supporting the superflare interpretation of the isotope peak around AD 774/5 by studying historical records. The Carrington event produced auroral displays as far south as Caribbean and Hawaii, corresponding to geomagnetic latitude of about 22°; if the event of 774/5 corresponded to an even more energetic flare there should have been a global auroral event.Usoskin et al. cited references to aurorae in Chinese chronicles for AD 770 (twice), 773 and 775. They also quote a “red cross” in the sky in AD 773/4 from the Anglo-Saxon Chronicle; “inflamed shields” or “shields burning with a red colour” seen in the sky over Germany in AD 776 recorded in the Royal Frankish Annals; “fire in heaven” seen in Ireland in AD 772; and an apparition in Germany in AD 773 interpreted as riders on white horses. Even if the dates do not precisely conform to the 14C increase this might suggest a period of high solar activity. Zhou et al.[24] add further details from the Chinese chronicles. On a date which they give as 17 January AD 775, there were more than ten bands of white lights “like the spread silk” stretching across eight Chinese constellations; the display lasted for several hours. The observations, made during the Tang dynasty, were made from the capital Xian; although geomagnetic latitudes change over time, this would correspond to the lower twenties.
There are a number of difficulties involved when trying to link the 14C results to historical chronicles. Tree ring dates may be in error because there is no discernible ring for a year (unusually cold weather), or two rings (a second growth during a warm autumn). If the cold weather were global, following a large volcanic eruption, it is conceivable that the effects could also be global: the apparent 14C date may not always match the chronicles.
For the isotope peak in AD 993/994 studied by Hayakawa et al. surveyed contemporary historical documents show clustering auroral observations in late 992, while their relationship with the isotope peak is still under discussion.
General solar activity in the past
Superflares seem to be associated with a general high level of magnetic activity. As well as looking for individual events, it is possible to examine the isotope records to find the activity level in the past and identify periods when it may have been much higher than now. Lunar rocks provide a record unaffected by geomagnetic shielding and transport processes. Both cosmic rays and solar particle events can create isotopes in rocks, and both are affected by solar activity. The cosmic rays are much more energetic and penetrate more deeply, and can be distinguished from the solar particles which affect the outer layers. Several different radioisotopes can be produced with very different half-lives; the concentration of each may be regarded as representing an average of particle flux over its half-life. Since fluxes must be converted into isotope concentrations by simulations there is a certain model-dependence here. The data are consistent with the view that the flux of energetic solar particles with energies above a few tens of MeV has not changed over periods ranging from five thousand to five million years. Of course, a period of intense activity over a time scale short with respect to the half-life would not be detected.14C measurements, even with low time resolution, can indicate the state of solar activity over the last 11,000 years until about 1900. Although radiocarbon dating has been applied as far back as 50,000 years, during the deglaciations at the start of the Holocene the biosphere and its carbon uptake changed dramatically making estimation before this impractical; after about 1900 the Suess effect makes interpretation difficult. 10Be concentrations in stratified polar ice cores provide an independent measure of activity. Both measures agree reasonably with each other and with the Zurich sunspot number of the last two centuries. As an additional check, it is possible to recover the isotope Titanium-44 (44Ti) from meteorites; this provides a measurement of activity that is not affected by changes in transport process or the geomagnetic field. Although it is limited to about the last two centuries, it is consistent with all but one of the 14C and 10Be reconstructions and confirms their validity. The energetic flare events discussed above are rare; on long time scales (significantly more than a year), the radiogenic particle flux is dominated by cosmic rays. The inner solar system is shielded by the general magnetic field of the sun, which is strongly dependent on the time within a cycle and the strength of the cycle. The result is that times of powerful activity show up as decreases in the concentrations of all these isotopes. Because cosmic rays are also influenced by the geomagnetic field, difficulties in reconstructing this field set a limit to the accuracy of the reconstructions.
The 14C reconstruction of activity over the last 11,000 years shows no period significantly higher than the present; in fact, the general level of activity in the second half of the 20th century was the highest since 9000 BC. In particular, the activity in the period around the AD 774 14C event (averaged over decades) was somewhat lower than the long-term average, while the AD 993 event coincided with a small minimum. A more detailed scrutiny of the period AD 731 to 825, combining several 14C datasets of one- and two-year resolution with auroral and sunspot accounts does show a general increase in solar activity (from a low level) after about AD 733, reaching its highest level after 757 and remaining high in the 760s and 770s; there were several aurorae around this time, and even a low-latitude aurora in China.
Effects of a hypothetical solar superflare
The effect of the sort of superflare apparently found on the original nine candidate stars would be catastrophic for the Earth and would leave traces on the Solar System; the event on S Fornacis for example involved an increase in the stars' luminosity by a factor of about twenty. Thomas Gold suggested that the glaze on the top surface of certain lunar rocks might be caused by a solar outburst involving a luminosity increase of over a hundred times for 10 to 100 seconds at some time in the last 30,000 years. Apart from the terrestrial effects, this would cause local ice melting followed by refreezing as far out as the moons of Jupiter. There is no evidence of superflares on this scale having occurred in the Solar System..
Even for much smaller superflares, at the lower end of the Kepler range, the effects would be serious. In 1859 the Carrington event caused failures in the telegraph system in Europe and North America. Possible consequences today would include:
- Damage to or loss of all artificial satellites
- Airline passengers on trans-polar flights would receive high radiation doses from the energetic particles (as would any astronauts or the crew of the International Space Station)
- Significant depletion of the ozone layer with increased risk of cataracts, sunburn and skin cancer, as well as damage to growing plants. The recovery time would be of the order of months to years. In the strongest cases there would be severe damage to the biosphere, especially to primary photosynthesis in the oceans
- Failure of the electricity distribution system (as in the March 1989 geomagnetic storm), possibly with damage to transformers and switching equipment
- Loss of power to the cooling systems of spent fuel rods stored at nuclear power stations
- Loss of most radio communication because of increased ionisation in the atmosphere
Superflares have also been suggested as a solution to the Faint young Sun paradox.
Can superflares occur on the Sun?
Since superflares can occur on stars apparently equivalent in every way to the Sun, it is natural to ask if they can occur on the Sun itself. An estimate based on the original Kepler photometric studies suggested a frequency on solar-type stars (early G-type and rotation period more than 10 days) of once every 800 years for an energy of 1034 erg and every 5000 years at 1035 erg. One-minute sampling provided statistics for less energetic flares and gave a frequency of one flare of energy 1033 erg every 5–600 years for a star rotating as slowly as the Sun; this would be rated as X100 on the solar flare scale. This is based on a straightforward comparison of the number of stars studied with the number of flares observed. An extrapolation of the empirical statistics for solar flares to an energy of 1035 erg suggests a frequency of one in 10,000 years.However, this does not match the known properties of superflare stars. Such stars are extremely rare in the Kepler data; one study showed only 279 such stars in 31,457 studied, a proportion below 1%; for older stars this fell to 0.25%. Also, about half of the stars which were active showed repeating flares: one had as many as 57 events in 500 days. Concentrating on solar-type stars, the most active averaged one flare every 100 days; the frequency of superflare occurrence in the most active Sun-like stars is 1000 times larger than that of the general average for such stars. This suggests that such behaviour is not present throughout a star's lifetime, but is confined to episodes of extraordinary activity. This is also suggested by the clear relation between the magnetic activity of a star and its superflare activity; in particular, superflare stars are much more active (based on starspot area) than the Sun.
There is no evidence for any flare greater than the Carrington event (about 1032 erg, or 1/10,000 of the largest superflares) in the last 200 years. Although larger events from the 14C record ca. 775 AD is unambiguously identified as a solar event, its association to the flare energy is unclear, and it is unlikely to exceed 1032 erg.
The more energetic superflares seem to be ruled out by energetic considerations for our sun, which suggest it is not capable of a flare of more than 1034 ergs. A calculation of the free energy in magnetic fields in active regions that could be released as flares gives a lower upper bound of around 3×1032 erg suggesting the most energetic a super flare can be is three times that of the Carrington event.
Some stars have a magnetic field 5 times that of Earth and rotate much faster and these could theoretically have a flare of up to 1034 ergs. This could explain some superflares at the lower end of the range. To go higher than this may require an anti-solar rotation curve - one in which the polar regions rotate faster than the equatorial regions.


.jpg)


