A strong polar vortex configuration in November 2013
A more typical weak polar vortex on January 5, 2014
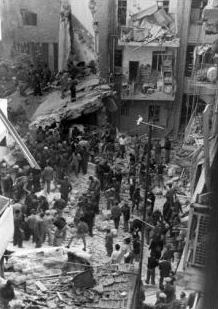
Low pressure area over Quebec, Maine, and New Brunswick, part of the northern polar vortex weakening, on the record-setting cold morning of January 21, 1985
A polar vortex is an upper-level low-pressure area lying near one of the Earth's poles. There are two polar vortices in the Earth's atmosphere, overlying the North and South Poles. Each polar vortex is a persistent, large-scale,
low-pressure zone less than 1,000 kilometers (620 miles) in diameter,
that rotates counter-clockwise at the North Pole and clockwise at the
South Pole (called a cyclone
in both cases), i.e., both polar vortices rotate eastward around the
poles. As with other cyclones, their rotation is driven by the Coriolis effect. The bases of the two polar vortices are located in the middle and upper troposphere and extend into the stratosphere. Beneath that lies a large mass of cold, dense Arctic air.
The interface between the cold dry air mass of the pole and the
warm moist air mass farther south defines the location of the polar
front. The polar front is centered, roughly at 60° latitude. A polar
vortex strengthens in the winter and weakens in the summer because of
its dependence on the temperature difference between the equator and the
poles.
The vortices weaken and strengthen from year to year. When the
vortex of the Arctic is strong, it is well defined, there is a single
vortex, and the Arctic air is well contained; when weaker, which it
generally is, it will break into two or more vortices; when very weak,
the flow of Arctic air becomes more disorganized, and masses of cold
Arctic air can push equatorward, bringing with them a rapid and sharp
temperature drop. When the polar vortex is strong, there is a single
vortex with a jet stream
that is "well constrained" near the polar front. When the northern
vortex weakens, it separates into two or more vortices, the strongest of
which are near Baffin Island, Canada, and the other over northeast Siberia.
The Antarctic vortex of the Southern Hemisphere is a single low-pressure zone that is found near the edge of the Ross ice shelf, near 160 west longitude. When the polar vortex is strong, the mid-latitude Westerlies
(winds at the surface level between 30° and 60° latitude from the west)
increase in strength and are persistent. When the polar vortex is weak,
high-pressure zones of the mid-latitudes may push poleward, moving the
polar vortex, jet stream,
and polar front equatorward. The jet stream is seen to "buckle" and
deviate south. This rapidly brings cold dry air into contact with the
warm, moist air of the mid-latitudes, resulting in a rapid and dramatic
change of weather known as a "cold snap".
Ozone depletion occurs within the polar vortices – particularly over the Southern Hemisphere – reaching a maximum depletion in the spring.
History
Polar vortex over the United Kingdom on December 17, 2010.
The polar vortex was first described as early as 1853. The phenomenon's sudden stratospheric warming (SSW) develops during the winter in the Northern Hemisphere and was discovered in 1952 with radiosonde observations at altitudes higher than 20 km.
The phenomenon was mentioned frequently in the news and weather media in the cold North American winter of 2013–2014, popularizing the term as an explanation of very cold temperatures.[6]
A deep freeze
that gripped much of the United States and Canada in late January 2019
has been blamed on a polar vortex. The US National Weather Service
warned that frostbite is possible within just 10 minutes of being
outside in such extreme temperatures, and hundreds of schools, colleges
and universities in the affected areas were closed. Around 21 people
died in US due to severe frostbite. States within the midwest region of the United States had windchills just above -50°F (-45°C), which is colder than the frozen tundra and Antarctica.
The Polar vortex has also thought to have had effects in Europe. For example, the 2013–14 United Kingdom winter floods were blamed on the Polar vortex bringing severe cold in the United States and Canada. Similarly, the severe, brutal cold in the United Kingdom in the winters of 2009/10 and 2010/11 were also blamed on the Polar vortex.
Identification
Polar
cyclones are low-pressure zones embedded within the polar air masses,
and exist year-round. The stratospheric polar vortex develops at
latitudes above the subtropical jet stream. Horizontally, most polar vortices have a radius of less than 1,000 kilometres (620 mi). Since polar vortices exist from the stratosphere downward into the mid-troposphere,
a variety of heights/pressure levels are used to mark its position. The
50 mb pressure surface is most often used to identify its stratospheric
location. At the level of the tropopause, the extent of closed contours of potential temperature
can be used to determine its strength. Others have used levels down to
the 500 hPa pressure level (about 5,460 metres (17,910 ft) above sea
level during the winter) to identify the polar vortex.
Duration and power
Polar vortex and weather impacts due to stratospheric warming
Polar vortices are weakest during summer and strongest during winter. Extratropical cyclones that migrate into higher latitudes when the polar vortex is weak can disrupt the single vortex creating smaller vortices (cold-core lows) within the polar air mass. Those individual vortices can persist for more than a month.
Volcanic eruptions in the tropics can lead to a stronger polar vortex during winter for as long as two years afterwards. The strength and position of the polar vortex shapes the flow pattern in a broad area about it. An index which is used in the northern hemisphere to gauge its magnitude is the Arctic oscillation.
When the Arctic vortex is at its strongest, there is a single
vortex, but normally, the Arctic vortex is elongated in shape, with two
cyclone centers, one over Baffin Island in Canada and the other over northeast Siberia.
When the Arctic pattern is at its weakest, subtropic air masses can
intrude poleward causing the Arctic air masses to move equatorward, as
during the Winter 1985 Arctic outbreak. The Antarctic polar vortex is more pronounced and persistent than the Arctic one. In the Arctic the distribution of land masses at high latitudes in the Northern Hemisphere gives rise to Rossby waves
which contribute to the breakdown of the polar vortex, whereas in the
Southern Hemisphere the vortex is less disturbed. The breakdown of the
polar vortex is an extreme event known as a sudden stratospheric warming, here the vortex completely breaks down and an associated warming of 30–50 °C (54–90 °F) over a few days can occur.
The waxing and waning of the polar vortex is driven by the
movement of mass and the transfer of heat in the polar region. In the
autumn, the circumpolar winds increase in speed and the polar vortex rises into the stratosphere.
The result is that the polar air forms a coherent rotating air mass:
the polar vortex. As winter approaches, the vortex core cools, the winds
decrease, and the vortex energy declines. Once late winter and early
spring approach the vortex is at its weakest. As a result, during late
winter, large fragments of the vortex air can be diverted into lower
latitudes by stronger weather systems intruding from those latitudes. In
the lowest level of the stratosphere, strong potential vorticity
gradients remain, and the majority of that air remains confined within
the polar air mass into December in the Southern Hemisphere and April in
the Northern Hemisphere, well after the breakup of the vortex in the
mid-stratosphere.
The breakup of the northern polar vortex occurs between mid March
to mid May. This event signifies the transition from winter to spring,
and has impacts on the hydrological cycle,
growing seasons of vegetation, and overall ecosystem productivity. The
timing of the transition also influences changes in sea ice, ozone, air
temperature, and cloudiness. Early and late polar breakup episodes have
occurred, due to variations in the stratospheric flow structure and
upward spreading of planetary waves from the troposphere.
As a result of increased waves into the vortex, the vortex experiences
more rapid warming than normal, resulting in an earlier breakup and
spring. When the breakup comes early, it is characterized by
with persistent of remnants of the vortex. When the breakup is late,
the remnants dissipate rapidly. When the breakup is early, there is one
warming period from late February to middle March. When the breakup is
late, there are two warming periods, one January, and one in March.
Zonal mean temperature, wind, and geopotential
height exert varying deviations from their normal values before and
after early breakups, while the deviations remain constant before and
after late breakups. Scientists are connecting a delay in the Arctic
vortex breakup with a reduction of planetary wave activities, few
stratospheric sudden warming events, and depletion of ozone.
Sudden stratospheric warming
events are associated with weaker polar vortices. This warming of
stratospheric air can reverse the circulation in the Arctic Polar Vortex
from counter-clockwise to clockwise. These changes aloft force changes in the troposphere below.
An example of an effect on the troposphere is the change in speed of
the Atlantic Ocean circulation pattern. A soft spot just south of
Greenland is where the initial step of downwelling
occurs, nicknamed the "Achilles Heel of the North Atlantic". Small
amounts of heating or cooling traveling from the polar vortex can
trigger or delay downwelling, altering the Gulf Stream Current
of the Atlantic, and the speed of other ocean currents. Since all other
oceans depend on the Atlantic Ocean's movement of heat energy, climates
across the planet can be dramatically affected. The weakening or
strengthening of the polar vortex can alter the sea circulation more
than a mile beneath the waves. Strengthening storm systems within the troposphere that cool the poles, intensify the polar vortex. La Niña–related climate anomalies significantly strengthen the polar vortex.
Intensification of the polar vortex produces changes in relative
humidity as downward intrusions of dry, stratospheric air enter the
vortex core. With a strengthening of the vortex comes a longwave
cooling due to a decrease in water vapor concentration near the vortex.
The decreased water content is a result of a lower tropopause within the vortex, which places dry stratospheric air above moist tropospheric air. Instability is caused when the vortex tube, the line of concentrated vorticity,
is displaced. When this occurs, the vortex rings become more unstable
and prone to shifting by planetary waves. The planetary wave activity in
both hemispheres varies year-to-year, producing a corresponding
response in the strength and temperature of the polar vortex.
The number of waves around the perimeter of the vortex are related to
the core size; as the vortex core decreases, the number of waves
increase.
The degree of the mixing of polar and mid-latitude air depends on the evolution and position of the polar night jet.
In general, the mixing is less inside the vortex than outside. Mixing
occurs with unstable planetary waves that are characteristic of the
middle and upper stratosphere in winter. Prior to vortex breakdown,
there is little transport of air out of the Arctic Polar Vortex due to
strong barriers above 420 km (261 miles). The polar night jet which
exists below this, is weak in the early winter. As a result, it does not
deviate any descending polar air, which then mixes with air in the
mid-latitudes. In the late winter, air parcels do not descend as much,
reducing mixing. After the vortex is broken up, the ex-vortex air is dispersed into the middle latitudes within a month.
Sometimes, a mass of the polar vortex breaks off before the end
of the final warming period. If large enough, the piece can move into
Canada and the Midwestern, Central, Southern, and Northeastern United
States. This diversion of the polar vortex can occur due to the
displacement of the polar jet stream; for example, the significant
northwestward direction of the polar jet stream in the western part of
the United States during the winters of 2013–2014, and 2014–2015. This
caused warm, dry conditions in the west, and cold, snowy conditions in
the north-central and northeast.
Occasionally, the high-pressure air mass, called the Greenland Block,
can cause the polar vortex to divert to the south, rather than follow
its normal path over the North Atlantic.
A nor'easter (also northeaster; see below) is a macro-scale extratropical cyclone
in the western North Atlantic Ocean. The name derives from the
direction of the winds that blow from the northeast. The original use
of the term in North America is associated with storms that impact the
upper north Atlantic coast of the United States and the Atlantic Provinces of Canada.
Typically, such storms originate as a low-pressure area that forms within 100 miles (160 km) of the shore between North Carolina and Massachusetts. The precipitation pattern is similar to that of other extratropical storms. Nor'easters are usually accompanied by very heavy rain or snow, and can cause severe coastal flooding, coastal erosion, hurricane-force winds, or blizzard conditions. Nor'easters are usually most intense during winter in New England and Atlantic Canada.
They thrive on converging air masses—the cold polar air mass and the
warmer air over the water—and are more severe in winter when the
difference in temperature between these air masses is greater.
Nor'easters tend to develop most often and most powerfully
between the months of November and March, although they can (much less
commonly) develop during other parts of the year as well. The
susceptible regions are generally impacted by nor'easters a few times
each winter.
Etymology and usage
Compass card (1607), featuring the spelling "Noreast"
The term nor'easter came to American English by way of British English. The earliest recorded uses of the contraction nor (for north) in combinations such as nor'-east and nor-nor-west, as reported by the Oxford English Dictionary, date to the late 16th century, as in John Davis's 1594 The Seaman's Secrets: "Noreast by North raiseth a degree in sayling 24 leagues." The spelling appears, for instance, on a compass card published in 1607. Thus, the manner of pronouncing from memory the 32 points of the compass, known in maritime training as "boxing the compass", is described by Ansted
with pronunciations "Nor'east (or west)," "Nor' Nor'-east (or west),"
"Nor'east b' east (or west)," and so forth. According to the OED, the
first recorded use of the term "nor'easter" occurs in 1836 in a
translation of Aristophanes.
The term "nor'easter" naturally developed from the historical spellings
and pronunciations of the compass points and the direction of wind or
sailing.
As noted in a January 2006 editorial by William Sisson, editor of Soundings magazine,
use of "nor'easter" to describe the storm system is common along the
U.S. East Coast. Yet it has been asserted by linguist Mark Liberman (see
below) that "nor'easter" as a contraction for "northeaster" has no
basis in regional New England dialect; the Boston accent would elide the "R": no'theastuh'.
He describes nor'easter as a "fake" word. However, this view neglects
the little-known etymology and the historical maritime usage described
above.
19th-century Downeast mariners pronounced the compass point "north northeast" as "no'nuth-east", and so on. For decades, Edgar Comee, of Brunswick, Maine,
waged a determined battle against use of the term "nor'easter" by the
press, which usage he considered "a pretentious and altogether
lamentable affectation" and "the odious, even loathsome, practice of
landlubbers who would be seen as salty as the sea itself". His efforts,
which included mailing hundreds of postcards, were profiled, just before
his death at the age of 88, in The New Yorker.
Despite the efforts of Comee and others, use of the term continues by the press. According to Boston Globe writer Jan Freeman,
"from 1975 to 1980, journalists used the nor’easter spelling only once
in five mentions of such storms; in the past year (2003), more than 80
percent of northeasters were spelled nor'easter".
University of Pennsylvania linguistics professor Mark Liberman
has pointed out that while the Oxford English Dictionary cites examples
dating back to 1837, these examples represent the contributions of a
handful of non-New England poets and writers. Liberman posits that
"nor'easter" may have originally been a literary affectation,
akin to "e'en" for "even" and "th'only" for "the only", which is an
indication in spelling that two syllables count for only one position in
metered verse, with no implications for actual pronunciation.
However, despite these assertions, the term can be found in the
writings of New Englanders, and was frequently used by the press in the
19th century.
The Hartford Times
reported on a storm striking New York in December 1839, and observed,
"We Yankees had a share of this same "noreaster," but it was quite
moderate in comparison to the one of the 15h inst."
Thomas Bailey Aldrich, in his semi-autobiographical work The Story of a Bad Boy (1870), wrote "We had had several slight flurries of hail and snow before, but this was a regular nor'easter".
In her story "In the Gray Goth" (1869) Elizabeth Stuart Phelps Ward wrote "...and there was snow in the sky now, setting in for a regular nor'easter".
John H. Tice, in A new system of meteorology, designed for schools and private students
(1878), wrote "During this battle, the dreaded, disagreeable and
destructive Northeaster rages over the New England, the Middle States,
and southward. No nor'easter ever occurs except when there is a high
barometer headed off and driven down upon Nova Scotia and Lower Canada."
Usage existed into the 20th century in the form of:
Current event description, as the Publication Committee of the New York Charity Organization Society wrote in Charities and the commons: a weekly journal of philanthropy and social advance, Volume 19 (1908): "In spite of a heavy "nor'easter," the worst that has visited the New England coast in years, the hall was crowded."
Historical reference, as used by Mary Rogers Bangs in Old Cape Cod
(1917): "In December of 1778, the Federal brig General Arnold, Magee
master and twelve Barnstable men among the crew, drove ashore on the
Plymouth flats during a furious nor'easter, the "Magee storm" that
mariners, for years after, used as a date to reckon from."
A "common contraction for "northeaster"", as listed in Ralph E. Huschke's Glossary of Meteorology (1959).
Geography and formation characteristics
Surface temperature of the sea off the east coast of North America. The corridor in yellow gives the position of the Gulf Stream
Formation
Nor'easters develop in response to the sharp contrast in the warm Gulf Stream
ocean current coming up from the tropical Atlantic and the cold air
masses coming down from Canada. When the very cold and dry air rushes
southward and meets up with the warm Gulf stream current, which is often
near 70 °F (21 °C) even in mid-winter, intense low pressure develops.
In the upper atmosphere, the strong winds of the jet stream remove and replace rising air from the Atlantic more rapidly than the Atlantic air is replaced at lower levels; this and the Coriolis force
help develop a strong storm. The storm tracks northeast along the East
Coast, normally from North Carolina to Long Island, then moves toward
the area east of Cape Cod. Counterclockwise winds around the low-pressure system
blow the moist air over land. The relatively warm, moist air meets cold
air coming southward from Canada. The low increases the surrounding
pressure difference, which causes the very different air masses to
collide at a faster speed. When the difference in temperature of the air
masses is larger, so is the storm's instability, turbulence, and thus
severity.
The nor'easters taking the East Coast track usually indicates the presence of a high-pressure area in the vicinity of Nova Scotia.
Sometimes a nor'easter will move slightly inland and bring rain to the
cities on the coastal plain (New York City, Philadelphia, Baltimore,
etc.) and snow in New England (Boston northward). It can move slightly
offshore, bringing a wet snow south of Boston to Richmond, Virginia, or
even parts of the Carolinas.
Such a storm will rapidly intensify, tracking northward and following
the topography of the East Coast, sometimes continuing to grow stronger
during its entire existence. A nor'easter usually reaches its peak
intensity while off the Canadian coast. The storm then reaches Arctic areas, and can reach intensities equal to that of a weak hurricane. It then meanders throughout the North Atlantic and can last for several weeks.
Characteristics
Nor'easters are usually formed by an area of vorticity
associated with an upper-level disturbance or from a kink in a frontal
surface that causes a surface low-pressure area to develop. Such storms
are very often formed from the merging of several weaker storms, a
"parent storm", and a polar jet stream mixing with the tropical jet
stream.
Until the nor'easter passes, thick, dark, low-level clouds often
block out the sun. Temperatures usually fall significantly due to the
presence of the cooler air from winds that typically come from a
northeasterly direction. During a single storm, the precipitation can
range from a torrential downpour to a fine mist. All precipitation types
can occur in a nor'easter. High wind gusts, which can reach hurricane
strength, are also associated with a nor'easter. On very rare occasions,
such as in the nor'easter in 1978, North American blizzard of 2006, and January 2018 North American blizzard, the center of the storm can take on the circular shape more typical of a hurricane and have a small "dry slot" near the center, which can be mistaken for an eye, although it is not an eye.
Difference from tropical cyclones
Often, people mistake nor'easters for tropical cyclones
and do not differentiate between the two weather systems. Nor'easters
differ from tropical cyclones in that nor'easters are cold-core
low-pressure systems, meaning that they thrive on drastic changes in
temperature of Canadian air and warm Atlantic waters. Tropical cyclones
are warm-core low-pressure systems, which means they thrive on purely
warm temperatures.
Difference from other extratropical storms
A nor'easter is formed in a strong extratropical cyclone, usually experiencing bombogenesis.
While this formation occurs in many places around the world,
nor'easters are unique for their combination of northeast winds and
moisture content of the swirling clouds. Nearly similar conditions
sometimes occur during winter in the Pacific Northeast (northern Japan
and northwards) with winds from NW-N. In Europe, similar weather systems
with such severity are hardly possible; the moisture content of the
clouds is usually not high enough to cause flooding or heavy snow,
though NE winds can be strong.
Geography
The eastern United States, from North Carolina to Maine, and Eastern Canada
can experience nor'easters, though most often they affect the areas
from New England northward. The effects of a nor'easter sometimes bring
high surf and strong winds as far south as coastal South Carolina. Nor'easters cause a significant amount of beach erosion in these areas, as well as flooding in the associated low-lying areas.
A water molecule,
a commonly used example of polarity. Two charges are present with a
negative charge in the middle (red shade), and a positive charge at the
ends (blue shade).
Polar molecules must contain polar bonds due to a difference in electronegativity between the bonded atoms. A polar molecule with two or more polar bonds must have a geometry which is asymmetric in at least one direction, so that the bond dipoles do not cancel each other.
In a molecule of hydrogen fluoride (HF), the more electronegative atom (fluorine)
is shown in yellow. Because the electrons spend more time by the
fluorine atom in the H−F bond, the red represents partially negatively
charged regions, while blue represents partially positively charged
regions.
Not all atoms attract electrons with the same force. The amount of "pull" an atom exerts on its electrons is called its electronegativity. Atoms with high electronegativities – such as fluorine, oxygen, and nitrogen – exert a greater pull on electrons than atoms with lower electronegativities such as alkali metals and alkaline earth metals.
In a bond, this leads to unequal sharing of electrons between the
atoms, as electrons will be drawn closer to the atom with the higher
electronegativity.
Because electrons have a negative charge, the unequal sharing of electrons within a bond leads to the formation of an electric dipole:
a separation of positive and negative electric charge. Because the
amount of charge separated in such dipoles is usually smaller than a fundamental charge, they are called partial charges, denoted as δ+ (delta plus) and δ− (delta minus). These symbols were introduced by Sir Christopher Ingold and Dr. Edith Hilda (Usherwood) Ingold in 1926. The bond dipole moment is calculated by multiplying the amount of charge separated and the distance between the charges.
Bonds
can fall between one of two extremes – being completely nonpolar or
completely polar. A completely nonpolar bond occurs when the
electronegativities are identical and therefore possess a difference of
zero. A completely polar bond is more correctly called an ionic bond,
and occurs when the difference between electronegativities is large
enough that one atom actually takes an electron from the other. The
terms "polar" and "nonpolar" are usually applied to covalent bonds,
that is, bonds where the polarity is not complete. To determine the
polarity of a covalent bond using numerical means, the difference
between the electronegativity of the atoms is used.
Bond polarity is typically divided into three groups that are
loosely based on the difference in electronegativity between the two
bonded atoms. According to the Pauling scale:
Nonpolar bonds generally occur when the difference in electronegativity between the two atoms is less than 0.5
Polar bonds generally occur when the difference in electronegativity between the two atoms is roughly between 0.5 and 2.0
Ionic bonds generally occur when the difference in electronegativity between the two atoms is greater than 2.0
Pauling based this classification scheme on the partial ionic character
of a bond, which is an approximate function of the difference in
electronegativity between the two bonded atoms. He estimated that a
difference of 1.7 corresponds to 50% ionic character, so that a greater
difference corresponds to a bond which is predominantly ionic.
As a quantum-mechanical description, Pauling proposed that the wave function for a polar molecule AB is a linear combination of wave functions for covalent and ionic molecules: ψ = aψ(A:B) + bψ(A+B−). The amount of covalent and ionic character depends on the values of the squared coefficients a2 and b2.
Polarity of molecules
While the molecules can be described as "polar covalent", "nonpolar
covalent", or "ionic", this is often a relative term, with one molecule
simply being more polar or more nonpolar than another. However, the following properties are typical of such molecules.
A molecule is composed of one or more chemical bonds between molecular orbitals of different atoms. A molecule may be polar either as a result of polar bonds due to differences in electronegativity
as described above, or as a result of an asymmetric arrangement of
nonpolar covalent bonds and non-bonding pairs of electrons known as a
full molecular orbital.
Polar molecules
The
water molecule is made up of oxygen and hydrogen, with respective
electronegativities of 3.44 and 2.20. The electronegativity difference
polarizes each H–O bond, shifting its electrons towards the oxygen
(illustrated by red arrows). These effects add as vectors to make the
overall molecule polar.
A polar molecule has a net dipole
as a result of the opposing charges (i.e. having partial positive and
partial negative charges) from polar bonds arranged asymmetrically. Water (H2O)
is an example of a polar molecule since it has a slight positive charge
on one side and a slight negative charge on the other. The dipoles do
not cancel out, resulting in a net dipole. Due to the polar nature of
the water molecule itself, other polar molecules are generally able to
dissolve in water. In liquid water, molecules possess a distribution of
dipole moments (range ≈ 1.9 - 3.1 D (Debye)) due to the variety of hydrogen-bonded environments. Other examples include sugars (like sucrose), which have many polar oxygen–hydrogen (−OH) groups and are overall highly polar.
If the bond dipole moments of the molecule do not cancel, the molecule is polar. For example, the water molecule (H2O) contains two polar O−H bonds in a bent (nonlinear) geometry. The bond dipole moments do not cancel, so that the molecule forms a molecular dipole
with its negative pole at the oxygen and its positive pole midway
between the two hydrogen atoms. In the figure each bond joins the
central O atom with a negative charge (red) to an H atom with a positive
charge (blue).
The hydrogen fluoride,
HF, molecule is polar by virtue of polar covalent bonds – in the
covalent bond electrons are displaced toward the more electronegative
fluorine atom.
The ammonia molecule, NH3, is polar as a result of its molecular geometry. The red represents partially negatively charged regions.
Ammonia, NH3,
molecule the three N−H bonds have only a slight polarity (toward the
more electronegative nitrogen atom). The molecule has two lone
electrons in an orbital, that points towards the fourth apex of the
approximate tetrahedron, (VSEPR).
This orbital is not participating in covalent bonding; it is
electron-rich, which results in a powerful dipole across the whole
ammonia molecule.
In ozone (O3)
molecules, the two O−O bonds are nonpolar (there is no
electronegativity difference between atoms of the same element).
However, the distribution of other electrons is uneven – since the
central atom has to share electrons with two other atoms, but each of
the outer atoms has to share electrons with only one other atom, the
central atom is more deprived of electrons than the others (the central
atom has a formal charge of +1, while the outer atoms each have a formal charge of −1⁄2). Since the molecule has a bent geometry, the result is a dipole across the whole ozone molecule.
When comparing a polar and nonpolar molecule with similar molar
masses, the polar molecule in general has a higher boiling point,
because the dipole–dipole interaction between polar molecules results in
stronger intermolecular attractions. One common form of polar
interaction is the hydrogen bond,
which is also known as the H-bond. For example, water forms H-bonds and
has a molar mass M = 18 and a boiling point of +100 °C, compared to
nonpolar methane with M = 16 and a boiling point of –161 °C.
Nonpolar molecules
A
molecule may be nonpolar either when there is an equal sharing of
electrons between the two atoms of a diatomic molecule or because of the
symmetrical arrangement of polar bonds in a more complex molecule. For
example, boron trifluoride (BF3) has a trigonal planar arrangement of three polar bonds at 120°. This results in no overall dipole in the molecule.
In a molecule of boron trifluoride, the trigonal planar arrangement of three polar bonds results in no overall dipole.
Carbon dioxide has two polar C-O bonds in a linear geometry.
Carbon dioxide (CO2) has two polar C=O bonds, but the geometry of CO2 is linear so that the two bond dipole moments cancel and there is no net molecular dipole moment; the molecule is nonpolar.
In methane, the bonds are arranged symmetrically (in a tetrahedral arrangement) so there is no overall dipole.
Examples of household nonpolar compounds include fats, oil, and petrol/gasoline. Most nonpolar molecules are water-insoluble (hydrophobic) at room temperature. Many nonpolar organic solvents, such as turpentine, are able to dissolve non-polar substances.
In the methane molecule (CH4)
the four C−H bonds are arranged tetrahedrally around the carbon atom.
Each bond has polarity (though not very strong). The bonds are arranged
symmetrically so there is no overall dipole in the molecule. The
diatomic oxygen molecule (O2) does not have polarity in the covalent bond because of equal electronegativity, hence there is no polarity in the molecule.
Amphiphilic molecules
Large molecules that have one end with polar groups attached and another end with nonpolar groups are described as amphiphiles or amphiphilic molecules. They are good surfactants
and can aid in the formation of stable emulsions, or blends, of water
and fats. Surfactants reduce the interfacial tension between oil and
water by adsorbing at the liquid–liquid interface.
This amphiphilic molecule has several polar groups (hydrophilic, water-loving) on the right side and a long nonpolar chain (lipophilic, fat-loving) at the left side. This gives it surfactant properties
A micelle – the lipophilic ends of the surfactant molecules dissolve in the oil, while the hydrophilic charged ends remain outside in the water phase, shielding the rest of the hydrophobic micelle. In this way, the small oil droplet becomes water-soluble.
Phospholipids are effective natural surfactants that have important biological functions
Cross section view of the structures that can be formed by phospholipids. They can form a micelle and are vital in forming cell membranes
Determining the point group
is a useful way to predict polarity of a molecule. In general, a
molecule will not possess dipole moment if the individual bond dipole
moments of the molecule cancel each other out. This is because dipole
moments are euclidean vector quantities with magnitude and direction, and a two equal vectors who oppose each other will cancel out.
Any molecule with a centre of inversion ("i") or a horizontal mirror plane ("σh") will not possess dipole moments.
Likewise, a molecule with more than one Cn axis of rotation will not possess a dipole moment because dipole moments cannot lie in more than one dimension. As a consequence of that constraint, all molecules with dihedral symmetry (Dn) will not have a dipole moment because, by definition, D point groups have two or multiple Cn axes.
Since C1, Cs,C∞h Cn and Cnvpoint groups do not have a centre of inversion, horizontal mirror planes or multiple Cn axis, molecules in one of those point groups will have dipole moment.
Electrical deflection of water
Contrary
to popular misconception, the electrical deflection of a stream of
water from a charged object is not based on polarity. The deflection
occurs because of electrically charged droplets in the stream, which the
charged object induces. A stream of water can also be deflected in a
uniform electrical field, which cannot exert force on polar molecules.
Additionally, after a stream of water is grounded, it can no longer be
deflected. Weak deflection is even possible for nonpolar liquids.
Tracks of North Atlantic tropical cyclones (1851–2012)
An Atlantic hurricane or tropical storm is a tropical cyclone that forms in the Atlantic Ocean, usually between the months of June and November. A hurricane differs from a cyclone or typhoon only on the basis of location. A hurricane is a storm that occurs in the Atlantic Ocean and northeastern Pacific Ocean, a typhoon occurs in the northwestern Pacific Ocean, and a cyclone occurs in the south Pacific or Indian Ocean.
Tropical cyclones can be categorized by intensity. Tropical storms have one-minute maximum sustained winds of at least 39 mph (34 knots, 17 m/s, 63 km/h), while hurricanes have one-minute maximum sustained winds exceeding 74 mph (64 knots, 33 m/s, 119 km/h). Most North Atlantic tropical storms and hurricanes form between June 1 and November 30. The United StatesNational Hurricane Center monitors the basin and issues reports, watches, and warnings about tropical weather systems for the North Atlantic Basin as one of the Regional Specialized Meteorological Centers for tropical cyclones, as defined by the World Meteorological Organization.
In recent times, tropical disturbances that reach tropical storm intensity are named from a predetermined list. Hurricanes that result in significant damage or casualties may have their names retired from the list at the request of the affected nations in order to prevent confusion should a subsequent storm be given the same name.
On average, in the North Atlantic basin (from 1966 to 2009) 11.3 named
storms occur each season, with an average of 6.2 becoming hurricanes
and 2.3 becoming major hurricanes (Category 3 or greater). The climatological peak of activity is around September 10 each season.
In March 2004, Catarina was the first hurricane-intensity tropical cyclone ever recorded in the Southern Atlantic Ocean. Since 2011, the Brazilian Navy Hydrographic Center
has started to use the same scale of the North Atlantic Ocean for
tropical cyclones in the South Atlantic Ocean and assign names to those
which reach 35 kn (65 km/h; 40 mph).
Steering factors
The
subtropical ridge (in the Pacific) shows up as a large area of black
(dryness) on this water vapor satellite image from September 2000
Tropical cyclones are steered by the surrounding flow throughout the depth of the troposphere (the atmosphere from the surface to about eight miles (12 km) high). Neil Frank, former director of the United StatesNational Hurricane Center,
used the analogies such as "a leaf carried along in a stream" or a
"brick moving through a river of air" to describe the way atmospheric
flow affects the path of a hurricane across the ocean. Specifically, air
flow around high pressure systems and toward low pressure areas influences hurricane tracks.
In the tropical latitudes, tropical storms and hurricanes generally move westward with a slight tendency toward the north, under the influence of the subtropical ridge, a high pressure system that usually extends east-west across the subtropics.
South of the subtropical ridge, surface easterly winds (blowing from
east to west) prevail. If the subtropical ridge is weakened by an upper
trough, a tropical cyclone may turn poleward and then recurve,
or curve back toward the northeast into the main belt of the
Westerlies. Poleward (north) of the subtropical ridge, westerly winds
prevail and generally steer tropical cyclones that reach northern
latitudes toward the east. The westerlies also steer extratropical cyclones with their cold and warm fronts from west to east.
Generally speaking, the intensity of a tropical cyclone is determined by either the storm's maximum sustained winds or lowest barometric pressure.
The following table lists the most intense Atlantic hurricanes in terms
of their lowest barometric pressure. In terms of wind speed, Hurricane Allen (in 1980)
was the strongest Atlantic tropical cyclone on record, with maximum
sustained winds of 190 mph (305 km/h). However, these measurements are
suspect since instrumentation used to document wind speeds at the time
would likely succumb to winds of such intensity. Nonetheless, their central pressures are low enough to rank them among the strongest recorded Atlantic hurricanes.
Owing to their intensity, the strongest Atlantic hurricanes have all attained Category 5 classification. Hurricane Opal, the strongest Category 4 hurricane recorded, intensified to reach a minimum pressure of 916 mbar (hPa; 27.05 inHg), a pressure typical of Category 5 hurricanes. Nonetheless, the pressure remains too high to list Opal as one of the ten strongest Atlantic tropical cyclones. Presently, Hurricane Wilma is the strongest Atlantic hurricane ever recorded, after reaching an intensity of 882 mbar (hPa; 26.05 inHg) in October 2005; this also made Wilma the strongest tropical cyclone worldwide outside of the West Pacific, where seven tropical cyclones have been recorded to intensify to lower pressures. However, this was later superseded by Hurricane Patricia in 2015 in the east Pacific, which had a pressure reading of 872 mbar. Preceding Wilma is Hurricane Gilbert, which had also held the record for most intense Atlantic hurricane for 17 years. The 1935 Labor Day hurricane,
with a pressure of 892 mbar (hPa; 26.34 inHg), is the third strongest
Atlantic hurricane and the strongest documented tropical cyclone prior
to 1950. Since the measurements taken during Wilma and Gilbert were documented using dropsonde, this pressure remains the lowest measured over land.
Hurricane Rita
is the fourth strongest Atlantic hurricane in terms of barometric
pressure and one of three tropical cyclones from 2005 on the list, with
the others being Wilma and Katrina at first and seventh respectively. However, with a barometric pressure of 895 mbar (hPa; 26.43 inHg), Rita is the strongest tropical cyclone ever recorded in the Gulf of Mexico. Mitch and Dean share intensities for the eighth strongest Atlantic hurricane at 905 mbar (hPa; 26.73 inHg). The tenth place for most intense Atlantic tropical cyclone is Hurricane Maria listed to have deepened to a pressure as low as 908 mbar (hPa; 26.81 inHg).
Many of the strongest recorded tropical cyclones weakened prior to their eventual landfall
or demise. However, three of the storms remained intense enough at
landfall to be considered some of the strongest landfalling hurricanes –
three of the eleven hurricanes on the list constitute the three most
intense Atlantic landfalls in recorded history. The 1935 Labor Day
hurricane made landfall at peak intensity, making it the most intense
Atlantic landfall. Though it weakened slightly before its eventual
landfall on the Yucatán Peninsula,
Hurricane Gilbert maintained a pressure of 900 mbar (hPa; 26.58 inHg)
at landfall, as did Camille, making their landfalls tied as the second
strongest. Similarly, Hurricane Dean made landfall on the peninsula,
though it did so at peak intensity and with a higher barometric
pressure; its landfall marked the fourth strongest in Atlantic hurricane
history.
Climatology
Total and Average Number of Tropical Storms by Month (1851–2017)
Month
Total
Average per year
January — April
7
<0 .05="" font="">
May
22
0.1
June
92
0.5
July
120
0.7
August
389
2.3
September
584
3.5
October
341
2.0
November
91
0.5
December
17
0.1
Source: NOAA FAQ
Climatology
does serve to characterize the general properties of an average season
and can be used as one of many other tools for making forecasts. Most
storms form in warm waters several hundred miles north of the equator near the Intertropical convergence zone from tropical waves. The Coriolis force is usually too weak to initiate sufficient rotation near the equator. Storms frequently form in the warm waters of the Gulf of Mexico, the Caribbean Sea, and the tropical Atlantic Ocean as far east as the Cape Verde Islands, the origin of strong and long-lasting Cape Verde-type hurricanes. Systems may also strengthen over the Gulf Stream off the coast of the eastern United States, wherever water temperatures exceed 26.5 °C (79.7 °F).
Although most storms are found within tropical latitudes,
occasionally storms will form further north and east from disturbances
other than tropical waves such as cold fronts and upper-level lows. These are known as baroclinically induced tropical cyclones. There is a strong correlation between Atlantic hurricane activity in the tropics and the presence of an El Niño or La Niña in the Pacific Ocean.
El Niño events increase the wind shear over the Atlantic, producing a
less-favorable environment for formation and decreasing tropical
activity in the Atlantic basin. Conversely, La Niña causes an increase
in activity due to a decrease in wind shear.
According to the Azores High hypothesis by Kam-biu Liu, an anti-phase pattern is expected to exist between the Gulf of Mexico coast and the North American Atlantic coast.
During the quiescent periods (3000–1400 BC, and 1000 AD to present), a
more northeasterly position of the Azores High would result in more
hurricanes being steered toward the Atlantic coast. During the
hyperactive period (1400 BC to 1000 AD), more hurricanes were steered
towards the Gulf coast as the Azores High was shifted to a more
southwesterly position near the Caribbean.
Such a displacement of the Azores High is consistent with paleoclimatic
evidence that shows an abrupt onset of a drier climate in Haiti around 3200 14C years BP, and a change towards more humid conditions in the Great Plains during the late-Holocene as more moisture was pumped up the Mississippi Valley
through the Gulf coast. Preliminary data from the northern Atlantic
coast seem to support the Azores High hypothesis. A 3000-year proxy
record from a coastal lake in Cape Cod
suggests that hurricane activity has increased significantly during the
past 500–1000 years, just as the Gulf coast was amid a quiescent period
of the last millennium.
Seasonal variation
Climatologically speaking, approximately 97 percent of tropical cyclones that form in the North Atlantic develop
between the dates of June 1 and November 30 – dates which delimit the
modern-day Atlantic hurricane season. Though the beginning of the annual
hurricane season has historically remained the same, the official end
of the hurricane season has shifted from its initial date of October 31.
Regardless, on average once every few years a tropical cyclone develops
outside the limits of the season;
as of January 2016 there have been 68 tropical cyclones in the
off-season, with the most recent being Subtropical Storm Andrea in 2019. The first tropical cyclone of the 1938 Atlantic hurricane season, which formed on January 3, became the earliest forming tropical storm and hurricane after reanalysis concluded on the storm in December 2012.
Hurricane Able in 1951 was initially thought to be the earliest forming major hurricane – a tropical cyclone with winds exceeding 115 mph (185 km/h) – however following post-storm analysis it was determined that Able only reached Category 1 strength which made Hurricane Alma of 1966 the new record holder; as it became a major hurricane on June 8. Though it developed within the bounds of the Atlantic hurricane season, Hurricane Audrey in 1957 became the earliest developing Category 4 hurricane on record after it reached the intensity on June 27.
However, reanalysis from 1956 to 1960 by NOAA downgraded Audrey to a
Category 3, making Hurricane Dennis of 2005 the earliest Category 4 on
record on July 8, 2005. The earliest-forming Category 5 hurricane, Emily, reached the highest intensity on the Saffir–Simpson hurricane wind scale on July 17, 2005.
Though the official end of the Atlantic hurricane season occurs
on November 30, the dates of October 31 and November 15 have also
historically marked the official end date for the hurricane season. December, the only month of the year after the hurricane season, has featured the cyclogenesis of fourteen tropical cyclones. Tropical Storm Zeta in 2005 was the latest tropical cyclone to attain tropical storm intensity as it did so on December 30. However, the second Hurricane Alice in 1954
was the latest forming tropical cyclone to attain hurricane intensity.
Both Zeta and Alice were the only two storms to exist in two calendar
years – the former from 1954 to 1955 and the latter from 2005 to 2006. No storms have been recorded to exceed Category 1 hurricane intensity in December. In 1999, Hurricane Lenny
reached Category 4 intensity on November 17 as it took an unprecedented
west to east track across the Caribbean; its intensity made it the
latest developing Category 4 hurricane, though this was well within the
bounds of the hurricane season. Hurricane Hattie (October 27 – November 1, 1961) was initially thought to have been the latest forming Category 5 hurricane ever documented, though reanalysis indicated that a devastating hurricane in 1932 reached such an intensity at a later date.
Consequently, this made the hurricane the latest developing tropical
cyclone to reach all four Saffir–Simpson hurricane wind scale
classifications past Category 1 intensity.
June
Typical locations and tracks of tropical systems in June; blue is likely, green more likely, and orange most likely
The beginning of the hurricane season is most closely related to the timing of increases in sea surface temperatures, convective instability, and other thermodynamic factors.
Although June marks the beginning of the hurricane season, generally
little activity occurs during the month with an average of 1 tropical cyclone every 2 years. Tropical systems usually form in the Gulf of Mexico or off the east coast of the United States.
Since 1851, a total of 81 tropical storms and hurricanes formed
in the month of June. During this period, two of these systems developed
in the deep tropics east of the Lesser Antilles. Since 1870, three major hurricanes have formed during June, most notably Hurricane Audrey in 1957.
Audrey attained an intensity greater than that of any Atlantic tropical
cyclone during June or July until Hurricanes Dennis and Emily of 2005. The easternmost forming storm during June, Tropical Storm Ana in 1979, formed at 45°W.
July
Typical locations and tracks in July
Not much tropical activity occurs during the month of July, but the majority of hurricane seasons see the formation of one tropical cyclone
during July. From an average of Atlantic tropical cyclone seasons from
1944 to 1996, the first tropical storm in half of the seasons occurred
by 11 July, and a second formed by 8 August.
Formation usually occurs in the eastern Caribbean Sea around the Lesser Antilles, in the northern and eastern parts of the Gulf of Mexico, in the vicinity of the northern Bahamas, and off the coast of The Carolinas and Virginia over the Gulf Stream. Storms travel westward through the Caribbean and then either move towards the north and curve near the eastern coast of the United States or stay on a north-westward track and enter the Gulf of Mexico.
Since 1851, a total of 105 tropical storms have formed during the month of July. Since 1870, ten of these storms reached major hurricane intensity. Only Hurricane Emily of 2005,
the strongest July tropical cyclone in the Atlantic basin, attained
Category 5 hurricane status during July, making it the earliest Category
5 hurricane on record. The easternmost forming storm and longest lived during the month of July, Hurricane Bertha in 2008, formed at 22.9°W and lasted 17 days.
August
Typical locations and tracks in August
Decrease in wind shear from July to August contributes to a significant increase of tropical activity.
An average of 2.8 Atlantic tropical storms develop annually in August.
On average, four named tropical storms, including one hurricane, occur
by August 30, and the first intense hurricane develops by 4 September.
September
Typical locations and tracks in September
The peak of the hurricane season occurs in September and corresponds with low wind shear and the warmest sea surface temperatures.
The month of September sees an average of 3 storms a year. By 24
September, the average Atlantic season features 7 named tropical storms,
including 4 hurricanes. In addition, two major hurricanes occur on
average by 28 September. Relatively few tropical cyclones make landfall
at these intensities.
October
Typical locations and tracks in October.
The favorable conditions found during September begin to decay in
October. The main reason for the decrease in activity is increasing wind shear, although sea surface temperatures are also cooler than in September. Activity falls markedly with 1.8 cyclones developing on average despite a climatological secondary peak around 20 October.
By 21 October, the average season features 9 named storms with 5
hurricanes. A third major hurricane occurs after 28 September in half of
all Atlantic tropical cyclone seasons.
In contrast to mid-season activity, the mean locus of formation shifts
westward to the Caribbean and Gulf of Mexico, reversing the eastward
progression of June through August.
November
Typical locations and tracks in November.
Wind shear from westerlies increases substantially through November, generally preventing cyclone formation.
On average, one tropical storm forms during every other November. On
rare occasions, a major hurricane occurs. The few intense hurricanes in
November include Hurricane "Cuba" in late October and early November 1932 (the strongest November hurricane on record peaking as a Category 5 hurricane), Hurricane Lenny in mid-November 1999, Hurricane Kate in late November 1985 which was the latest major hurricane formation on record until Hurricane Otto (a category 3 storm) of the 2016 hurricane season. Hurricane Paloma was a very potent category 4 storm that made landfall in Cuba in early November 2008.
December to May
Probability of a tropical cyclone of tropical storm or hurricane strength at a specific date, expressed as systems per 100 years
Although the hurricane season is defined as beginning on June 1 and
ending on November 30, there have been several off-season storms.
Since 1870, there have been 32 off-season cyclones, 18 of which
occurred in May. In the same time span, nine storms formed in December,
two in April, and one each in January, February and March. During four years (1887, 1953, 2003, and 2007), tropical cyclones formed in the North Atlantic Ocean both during or before May and during December. In 1887, four storms occurred outside the season, the most in a single year. High vertical wind shear and low sea surface temperatures generally preclude tropical cyclone formation during the off-season.
Tropical cyclones have formed in all months.
Four tropical cyclones existed during the month of January, two of
which formed during late December: the second Hurricane Alice in
1954/1955, and Tropical Storm Zeta in 2005/2006. The only two hurricanes to form in January are a Category 1 hurricane in the 1938 season, and Hurricane Alex in the 2016 season. A subtropical storm in January also began the 1978 Atlantic hurricane season. No major hurricanes have occurred in the off-season.
Extremes
Hurricane Katrina was the costliest and one of the five deadliest hurricanes in the history of the United States.
Hurricane Harvey was also the costliest hurricane in the history of the United States, causing historic and catastrophic flooding in Texas.
The season in which the most tropical storms formed on record was the 2005 Atlantic hurricane season (28). That season was also the one in which the most hurricanes formed on record (15).
The least active season on record since 1946 (when the database is considered more reliable) was the 1983 Atlantic hurricane season, with four tropical storms, two hurricanes, and one major hurricane. Overall, the 1914 Atlantic hurricane season remains the least active, with only one documented storm.
The most intense hurricane (by barometric pressure) on record in the North Atlantic basin was Hurricane Wilma (2005) (882 mbar).
The largest hurricane (in gale diameter) on record to form in the North Atlantic was Hurricane Sandy (2012) with a gale diameter of 1,100 miles (1,800 km).
The longest-lasting hurricane was the 1899 San Ciriaco hurricane, which lasted for 27 days and 18 hours as a tropical cyclone.
The longest-tracked hurricane was Hurricane Faith, which traveled for 6,850 miles (11,020 km) as a tropical cyclone. Faith is also the northernmost moving tropical cyclone in the Atlantic basin.
The deadliest hurricane to make landfall on the continental United States was the Galveston Hurricane in 1900 which may have killed up to 12,000 people.
The most damaging hurricane was both Hurricane Katrina and Hurricane Harvey of the 2005 and 2017 seasons, respectively, both of which caused $125 billion in damages in their respective years. However, when adjusted for inflation, Katrina is the costliest with $161 billion.
The quickest forming hurricane was Hurricane Humberto
in 2007. It was a minimal hurricane that formed and intensified faster
than any other tropical cyclone on record before landfall. Developing on
September 12, 2007, in the northwestern Gulf of Mexico, the cyclone
rapidly strengthened and struck High Island, Texas, with winds of about
90 mph (150 km/h) early on September 13.
While the number of storms in the Atlantic has increased since 1995,
there is no obvious global trend. The annual number of tropical cyclones
worldwide remains about 87 ± 10. However, the ability of climatologists
to make long-term data analysis in certain basins is limited by the
lack of reliable historical data in some basins, primarily in the
Southern Hemisphere. In spite of that, there is some evidence that the intensity of hurricanes is increasing. In 2006, Kerry Emanuel
stated, "Records of hurricane activity worldwide show an upswing of
both the maximum wind speed in and the duration of hurricanes. The
energy released by the average hurricane (again considering all
hurricanes worldwide) seems to have increased by around 70% in the past
30 years or so, corresponding to about a 15% increase in the maximum
wind speed and a 60% increase in storm lifetime."
At the time, Emanuel theorized that increased heat from global warming
was driving this trend, however, some argue that Emanuel's own research
in 2008 refuted this theory. Others contend that the trend does not
exist at all, but instead is a figment created by faulty readings from
primitive 1970s-era measurement equipment.
Vecchi and Knutson (2008) found a weakly positive, although not
statistically-significant trend in the number of North Atlantic tropical
cyclones for 1878–2006, but also a surprisingly strong decrease in
cyclone duration over this period.
On May 15, 2014, the journal Nature
published a peer-reviewed submission from October 2013 by James P.
Kossin, Kerry A. Emanuel, and Gabriel A. Vecchi that suggests that a
poleward migration exists for the paths of maximum intensity of tropical
cyclone activity in the Atlantic.
The focus of the report is on the latitude at which recent tropical
cyclones in the Atlantic are reaching maximum intensity. Their data
indicates that during the past thirty years, the peak intensity of these
storms has shifted poleward in both hemispheres at a rate of
approximately 60 km per decade, amounting to approximately one degree of
latitude per decade.
Atlantic storms are becoming more destructive financially, since five of the ten most expensive storms in United States history have occurred since 1990. According to the World Meteorological Organization,
“recent increase in societal impact from tropical cyclones has largely
been caused by rising concentrations of population and infrastructure in
coastal regions.” Pielke et al.
(2008) normalized mainland U.S. hurricane damage from 1900–2005 to 2005
values and found no remaining trend of increasing absolute damage. The
1970s and 1980s were notable because of the extremely low amounts of
damage compared to other decades. The decade 1996–2005 has the second
most damage among the past 11 decades, with only the decade 1926–1935
surpassing its costs. The most damaging single storm is the 1926 Miami hurricane, with $157 billion of normalized damage.
Often in part because of the threat of hurricanes, many coastal
regions had sparse population between major ports until the advent of
automobile tourism; therefore, the most severe portions of hurricanes
striking the coast may have gone unmeasured in some instances. The
combined effects of ship destruction and remote landfall severely limit
the number of intense hurricanes in the official record before the era
of hurricane reconnaissance aircraft and satellite meteorology. Although
the record shows a distinct increase in the number and strength of
intense hurricanes, therefore, experts regard the early data as suspect. Christopher Landseaet al.
estimated an undercount bias of zero to six tropical cyclones per year
between 1851 and 1885 and zero to four per year between 1886 and 1910.
These undercounts roughly take into account the typical size of tropical
cyclones, the density of shipping tracks over the Atlantic basin, and
the amount of populated coastline.
The number and strength of Atlantic hurricanes may undergo a 50–70 year cycle, also known as the Atlantic Multidecadal Oscillation. Nyberg et al.
reconstructed Atlantic major hurricane activity back to the early
eighteenth century and found five periods averaging 3–5 major hurricanes
per year and lasting 40–60 years, and six other averaging 1.5–2.5 major
hurricanes per year and lasting 10–20 years. These periods are
associated with the Atlantic multidecadal oscillation. Throughout, a
decadal oscillation related to solar irradiance was responsible for
enhancing/dampening the number of major hurricanes by 1–2 per year.
Although more uncommon since 1995, few above-normal hurricane seasons occurred during 1970–94.
Destructive hurricanes struck frequently from 1926–60, including many
major New England hurricanes. Twenty-one Atlantic tropical storms formed
in 1933, a record only recently exceeded in 2005,
which saw 28 storms. Tropical hurricanes occurred infrequently during
the seasons of 1900–25; however, many intense storms formed during
1870–99. During the 1887 season,
19 tropical storms formed, of which a record 4 occurred after November 1
and 11 strengthened into hurricanes. Few hurricanes occurred in the
1840s to 1860s; however, many struck in the early 19th century,
including an 1821 storm that made a direct hit on New York City. Some historical weather experts say these storms may have been as high as Category 4 in strength.
These active hurricane seasons predated satellite coverage of the
Atlantic basin. Before the satellite era began in 1960, tropical storms
or hurricanes went undetected unless a reconnaissance aircraft
encountered one, a ship reported a voyage through the storm, or a storm
landed in a populated area.
The official record, therefore, could miss storms in which no ship
experienced gale-force winds, recognized it as a tropical storm (as
opposed to a high-latitude extra-tropical cyclone, a tropical wave, or a
brief squall), returned to port, and reported the experience.
Proxy records based on paleotempestological research have revealed that major hurricane activity along the Gulf of Mexico coast varies on timescales of centuries to millennia.
Few major hurricanes struck the Gulf coast during 3000–1400 BC and
again during the most recent millennium. These quiescent intervals were
separated by a hyperactive period during 1400 BC and 1000 AD, when the
Gulf coast was struck frequently by catastrophic hurricanes and their
landfall probabilities increased by 3–5 times. This millennial-scale
variability has been attributed to long-term shifts in the position of
the Azores High, which may also be linked to changes in the strength of the North Atlantic Oscillation.
According to the Azores High hypothesis, an anti-phase pattern is
expected to exist between the Gulf of Mexico coast and the Atlantic
coast. During the quiescent periods, a more northeasterly position of
the Azores High would result in more hurricanes being steered towards
the Atlantic coast. During the hyperactive period, more hurricanes were
steered towards the Gulf coast as the Azores High was shifted to a more
southwesterly position near the Caribbean. Such a displacement of the
Azores High is consistent with paleoclimatic evidence that shows an
abrupt onset of a drier climate in Haiti around 3200 14C years BP, and a change towards more humid conditions in the Great Plains during the late-Holocene as more moisture was pumped up the Mississippi Valley
through the Gulf coast. Preliminary data from the northern Atlantic
coast seem to support the Azores High hypothesis. A 3,000-year proxy
record from a coastal lake in Cape Cod
suggests that hurricane activity increased significantly during the
past 500–1000 years, just as the Gulf Coast was amid a quiescent period
during the last millennium. Evidence also shows that the average
latitude of hurricane impacts has been steadily shifting northward,
towards the Eastern Seaboard over the past few centuries. This change has been sped up in modern times due to the Arctic Ocean heating up especially much from fossil fuel-caused global warming.