Search This Blog

Sunday, November 22, 2020

Resilience in the built environment

From Wikipedia, the free encyclopedia

Resilience in the Built Environment is the built environment's capability to keep adapting to existing and emerging threats such as severe wind storms or earthquakes and creating robustness and redundancy in building design. New implications of changing conditions on the efficiency of different approaches to design and planning can be addressed in the following term.

Design systems react differently to shock events. The following graph represents ways in which systems respond and possibly adapt based on their resilience.

Origin of the term resilience

According to the dictionary, resilience means "the ability to recover from difficulties or disturbance." The root of the term resilience is found in the Latin term 'resilio' which means to go back to a state or to spring back.  In the 1640s the root term provided a resilience in the field of the mechanics of materials as "the ability of a material to absorb energy when it is elastically deformed and to release that energy upon unloading". By 1824, the term had developed to encompass the meaning of ‘elasticity’.

19th century resilience

Thomas Tredgold was the first to introduce the concept of resilience in 1818 in England. The term was used to describe a property in the strength of timber, as beams were bent and deformed to support heavy load. Tredgold found the timber durable and did not burn readily, despite being planted in bad soil conditions and exposed climates. Resilience was then refined by Mallett in 1856 in relation to the capacity of specific materials to withstand specific disturbances. These definitions can be used in engineering resilience due to the application of a single material that has a stable equilibrium regime rather than the complex adaptive stability of larger systems.

20th century resilience

In the 1970s, researchers studied resilience in relation to child psychology and the exposure to certain risks. Resilience was used to describe people who have “the ability to recover from adversity.” One of the many researchers was Professor Sir Michael Rutter, who was concerned with a combination of risk experiences and their relative outcomes.

In his paper Resilience and Stability of Ecological systems (1973), Holling first explored the topic of resilience through its application to the field of ecology. Ecological resilience was defined as a “measure of the persistence of systems and of their ability to absorb change and disturbance and still maintain the same relationships between state variables.”  Holling found that such a framework can be applied to other forms of resilience. The application to ecosystems was later used to draw into other manners of human, cultural and social applications.The random events described by Holling are not only climatic, but instability to neutral systems can occur through the impact of fires, the changes in forest community or the process of fishing. Stability, on the other hand, is the ability of a system to return to an equilibrium state after a temporary disturbance. Multiple state systems and conditions rather than objects should be studied as the world is a heterogeneous space with various biological, physical and chemical characteristics.  Unlike material and engineering resilience, Ecological and social resilience focus on the redundancy and persistence of multi-equilibrium states to maintain existence of function.

Engineering resilience

Four Rs of Resilience

Engineering resilience refers to the functionality of a system in relation to hazard mitigation. Within this framework, resilience is calculated based on the time it takes a system to return to a single state equilibrium. Researchers at the MCEER (Multi-Hazard Earthquake Engineering research center) have identified four properties of resilience: Robustness, resourcefulness, redundancy and rapidity. 

  • Robustness: the ability of systems to withstand a certain level of stress without suffering loss of function.
  • Resourcefulness: the ability to identify problems and resources when threats may disrupt the system.
  • Redundancy: the ability to have various paths in a system by which forces can be transferred to enable continued function
  • Rapidity: the ability to meet priorities and goals in time to prevent losses and future disruptions.

Social-ecological resilience

also known as adaptive resilience, social-ecological resilience is a new concept that shifts the focus to combining the social, ecological and technical domains of resilience. The adaptive model focuses on the transformable quality of the stable state of a system. In adaptive buildings, both short term and long term resilience are addressed to ensure that the system can withstand disturbances with social and physical capacities. Buildings operate at multiple scale and conditions, therefore it is important to recognize that constant changes in architecture are expected. Laboy and Fannon recognize that the resilience model is shifting, and have applied the MCEER four properties of resilience to the planning, designing and operating phases of architecture.  Rather than using four properties to describe resilience, Laboy and Fannon suggest a 6R model that adds Recovery for the operation phase of a building and Risk Avoidance for the planning phase of the building. In the planning phase of a building, site selection, building placement and site conditions are crucial for the risk avoidance. Early planning can help prepare and design for the built environment based on forces that we understand and perceive. In the operation phase of the building, a disturbance does not mark the end of resilience, but should propose a recovery plan for future adaptations. Disturbances should we be used as a learning opportunity to assess mistakes and outcomes, and reconfigure for future needs.

Applications

Resilience in International Building Code

The international building code provides minimum requirements for buildings using performative based standards. The most recent International Building Code (IBC)was released in 2018 by the International Code Council (ICC), focusing on standards that protect public health, safety and welfare, without restricting use of certain building methods. The code addresses several categories, which are updated every three years to incorporate new technologies and changes. Building codes are fundamental to the resilience of communities and their buildings, as “Resilience in the built environment starts with strong, regularly adopted and properly administered building codes”  Benefits occur due to the adoption of codes as the National Institute of Building Sciences (NIBS) found that the adoption of the International Building Code provides an 11$ benefit for every 1$ invested. 

The International Code Council is focused on assuming the community’s buildings support the resilience of communities ahead of disasters.  The process presented by the ICC includes understanding the risks, identifying strategies for the risks, and implementing those strategies. Risks vary based on communities, geographies and other factors. The American Institute of Architects created a list of shocks and stresses that are related to certain community characteristics. Shocks are natural forms of hazards (floods, earthquakes), while stresses are more chronic events that can develop over a longer period of time (affordability, drought). It is important to understand the application of resilient design on both shocks and stresses as buildings can play a part in contributing to their resolution. Even though the IBC is a model code, it is adopted by various state and governments to regulate specific building areas. Most of the approaches to minimizing risks are organized around building use and occupancy. In addition, the safety of a structure is determined by material usage, frames, and structure requirements can provide a high level of protection for occupants. Specific requirements and strategies are provided for each shock or stress such as with tsunamis, fires and earthquakes. 

U.S Resiliency Council

The U.S Resiliency Council (USRC), a non-profit organization, created the USRC Rating system which describes the expected impacts of a natural disaster on new and existing buildings. The rating considers the building prior to its use through its structure, Mechanical-Electrical systems and material usage. Currently, the program is in its pilot stage, focusing primarily on earthquake preparedness and resilience. For earthquake hazards, the rating relies heavily on the requirements set by the Building codes for design. Buildings can obtain one of the Two types of USRC rating systems:

USRC Verified Rating System

The verified Rating system is used for marketing and publicity purposes using badges. The rating is easy to understand, credible and transparent at is awarded by professionals. The USRC building rating system rates buildings with stars ranging from one to five stars based on the dimensions used in their systems. The three dimensions that the USRC uses are Safety, Damage and Recovery. Safety describes the prevention of potential harm for people after an event. Damage describes the estimated repair required due to replacements and losses. Recovery is calculated based on the time it takes for the building to regain function after a shock.  The following types of Rating certification can be achieved:

  • USRC Platinum: less than 5% of expected damage
  • USRC Gold: less than 10% of expected damage
  • USRC Silver: less than 20% of expected damage
  • USRC Certified: less than 40% of expected damage

Earthquake Building rating system can be obtained through hazard evaluation and seismic testing. In addition to the technical review provided by the USRC, A CRP seismic analysis applies for a USRC rating with the required documentation.  The USRC is planning on creating similar standards for other natural hazards such as floods, storms and winds.

USRC Transaction Rating System

Transaction rating system provides a building with a report for risk exposure, possibly investments and benefits. This rating remains confidential with the USRC and is not used to publicize or market the building.

Disadvantages of the USRC rating system

Due to the current focus on seismic interventions, the USRC does not take into consideration several parts of a building. The USRC building rating system does not take into consideration any changes to the design of the building that might occur after the rating is awarded. Therefore, changes that might impede the resilience of a building would not affect the rating that the building was awarded. In addition, changes in the uses of the building after certification might include the use of hazardous materials would not affect the rating certification of the building. The damage rating does not include damage caused by pipe breakage, building upgrades and damage to furnishings. The recovery rating does not include fully restoring all building function and all damages but only a certain amount.

The 100 Resilient Cities Program

In 2013, The 100 Resilient Cities Program was initiated by the Rockefeller foundation, with the goal to help cities become more resilient to physical, social and economic shocks and stresses. The program helps facilitate the resilience plans in cities around the world through access to tools, funding and global network partners such as ARUP and the AIA. Of 1,000 cities that applied to join the program, only 100 cities were selected with challenges ranging from aging populations, cyber attacks, severe storms and drug abuse.

There are many cities that are members of the program, but in the article, Building up resilience in cities worldwide, Spaans and Waterhot focus on the city of Rotterdam to compare the city’s resilience before and after the participation in the program. The authors found that the program broadens the scope and improved the Resilience plan of Rotterdam by including access to water, data, clean air, cyber robustness, and safe water. The program addresses other social stresses that can weaken the resilience of cities such as violence and unemployment. Therefore, cities are able to reflect on their current situation and plan to adapt to new shocks and stresses.  The findings of the article can support the understanding of resiliency at a larger urban scale that requires an integrated approach with coordination across multiple government scales, time scales and fields. In addition to integrating resiliency into building code and building certification programs, the 100 resilience Cities program provides other support opportunities that can help increase awareness through non-profit organizations. 

After more than six years of growth and change, the existing 100 Resilient Cities organization concluded on July 31, 2019.

RELi Rating System

RELi is a design criteria used to develop resilience in multiple scales of the built environment such as buildings, neighborhoods and infrastructure. It was developed by the Institute for Market Transformation to Sustainability (MTS) to help designers plan for hazards. RELi is very similar to LEED but with a focus on resilience. RELi is now owned by the U.S Green Building Council (USGBC) and available to projects seeking LEED certification. The first version of RELi was released in 2014, it is currently still in the pilot phase, with no points allocated for specific credits. RELi accreditation is not required, and the use of the credit information is voluntary.  Therefore, the current point system is still to be determined and does not have a tangible value. RELi provides a credit catalog that is used a s a reference guide for building design and expands on the RELi definition of resilience as follows:

Resilient Design pursues Buildings + Communities that are shock resistant, healthy, adaptable and regenerative through a combination of diversity, foresight and the capacity for self-organization and learning. A Resilient Society can withstand shocks and rebuild  itself when necessary. It requires humans to embrace their capacity to anticipate, plan and adapt for the future.

RELi Credit Catalog

The RELi Catalog considers multiple scales of intervention with requirements for a panoramic approach, risk adaptation & mitigation for acute events and a comprehensive adaptation & mitigation for the present and future. RELi's framework highly focuses on social issues for community resilience such as providing community spaces and organisations. RELi also combines specific hazard designs such as flood preparedness with general strategies for energy and water efficiency. The following categories are used to organize the RELi credit list:

  • Panoramic approach to Planning, design, Maintenance and Operations
  • Hazard Preparedness
  • Hazard adaptation and mitigation
  • Community cohesion, social and economic vitality
  • Productivity, health and diversity
  • Energy, water, food
  • Materials and artifacts
  • Applied creativity, innovation and exploration

The RELI Program complements and expands on other popular rating systems such as LEED, Envision, and Living Building Challenge. The menu format of the catalog allows users to easily navigate the credits and recognize the goals achieved by RELI. References to other rating systems that have been used can help increase awareness on RELi and its credibility of its use. The reference for each credit is listed in the catalog for ease of access. 

LEED Pilot Credits

In 2018, three new LEED pilot credits were released to increase awareness on specific natural and man-made disasters. The pilot credits are found in the Integrative Process category and are applicable to all Building Design and Construction rating systems. 

  • The first credit IPpc98: Assessment and Planning for Resilience, includes a prerequisite for a hazard assessment of the site. It is crucial to take into account the site conditions and how they change with variations in the climate. Projects can either choose to do a climate-related risk plan or can complete planning forms presented by the Red Cross.
  • The second credit IPpc99: Assessment and Planning for Resilience, requires projects to prioritize three top hazards based on the assessments made in the first credit. specific mitigation strategies for each hazard have to be identified and implemented. Reference to other resilience programs such as the USRC should be made to support the choice of hazards.
  • The third credit IPpc100: Passive Survivability and Functionality During Emergencies, focuses on maintaining livable and functional conditions during a disturbance. Projects can demonstrate the ability to provide emergency power for high priority functions, can maintain livable temperatures for a certain period of time, and provide access to water. For thermal resistance, reference to thermal modeling of the comfort tool's psychrometric chart should be made to support the thermal qualities of the building during a certain time. As for emergency power, backup power must last based on the critical loads and needs of the building use type. 

LEED credits overlap with RELi rating system credits, the USGBC has been refining RELi to better synthesize with the LEED resilient design pilot credits.

Design based on climate change

It is important to assess current climate data and design in preparation of changes or threats to the environment. Resilience plans and passive design strategies can differ based on climates that are too hot. Here are general climate responsive design strategies based on three different climatic conditions:

Too Wet

  • Use of Natural solutions: mangroves and other shoreline plants can act as barriers to flooding.
  • Creating a Dike system: in areas with extreme floods, dikes can be integrated into the urban landscape to protect buildings.
  • Using permeable paving: porous pavement surfaces absorb runoff in parking lots, roads and sidewalks.
  • Rain Harvesting methods: collect and store rainwater for domestic or landscape purposes.

Too Dry

  • Use of drought-tolerant plants: save water usage in landscaping methods
  • Filtration of wastewater: recycling wastewater for landscaping or toilet usage.
  • Use of courtyard layout: minimize the area affected by solar radiation and use water and plants for evaporative cooling.

Too Hot

  • Use of vegetation: Trees can help cool the environment by reducing the urban heat island effect through evapotranspiration.
  • Use of passive solar-design strategies: operable windows and thermal mass can cool the building down naturally.
  • Window Shading strategies: control the amount of sunlight that enters the building to minimize heat gains during the day.
  • Reduce or shade external adjacent thermal masses that will re-radiate into the building (e.g. pavers)

Design based on hazards

Hazard assessment

Determining and assessing vulnerabilities to the built environment based on specific locations is crucial for creating a resilience plan. Disasters lead to a wide range of consequences such as damaged buildings, ecosystems and human losses. For example, earthquakes that took place in the Wenchuan County in 2008, lead to major landslides which relocated entire city district such as Old Beichuan.  Here are some natural hazards and potential strategies for resilience assessment.

Fire
  • use of fire rated materials
  • provide fire-resistant stairwells for evacuation
  • universal escape methods to also help those with disabilities.
Hurricanes

There are multiple strategies for protecting structures against hurricanes, based on wind and rain loads.

  • Openings should be protected form flying debris
  • Structures should be elevated from possible water intrusion and flooding
  • Building enclosures should be sealed with specific nailing patterns
  • use of materials such as metal, tile or masonry to resist wind loads. 
Earthquakes

Earthquakes can also result in the structural damage and collapse of buildings due to high stresses on building frames.

  • Secure appliances such as heaters and furniture to prevent injury and fires
  • expansion joints should be used in building structure to respond to seismic shaking.
  • create flexible systems with base isolation to minimize impact
  • provide earthquake preparedness kit with necessary resources during event

Resilience and sustainability

It is difficult to discuss the concepts of resilience and sustainability in comparison due to the various scholarly definitions that have been used in the field over the years. Many policies and academic publications on both topics either provide their own definitions of both concepts or lack a clear definition of the type of resilience they seek. Even though sustainability is a well established term, there are generic interpretations of the concept and its focus. Sanchez et al proposed a new characterization of the term ‘sustainable resilience’ which expands the social-ecological resilience to include more sustained and long-term approaches. Sustainable resilience focuses not only on the outcomes, but also on the processes and policy structures in the implementation. 

Both concepts share essential assumptions and goals such as passive survivability and persistence of a system operation over time and in response to disturbances. There is also a shared focus on climate change mitigation as they both appear in larger frameworks such as Building Code and building certification programs. Holling and Walker argue that “a resilient sociol-ecological system is synonymous with a region that is ecological, economically and socially sustainable.” Other scholars such as Perrings state that “a development strategy is not sustainable if it is not resilient.” Therefore, the two concepts are intertwined and cannot be successful individually as they are dependent on one another. For example, in RELi and in LEED and other building certifications, providing access to safe water and an energy source is crucial before, during and after a disturbance.

Some scholars argue that resilience and sustainability tactics target different goals. Paula Melton argues that resilience focuses on the design for unpredictable, while sustainability focuses on the climate responsive designs. Some forms of resilience such as adaptive resilience focus on designs that can adapt and change based on a shock event, on the other hand, sustainable design focuses on systems that are efficient and optimized. 

Attribution of recent climate change

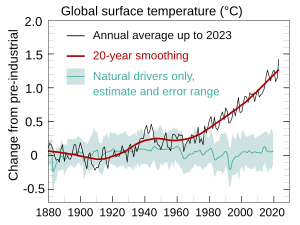
Observed temperature from NASA vs the 1850–1900 average used by the IPCC as a pre-industrial baseline. The primary driver for increased global temperatures in the industrial era is human activity, with natural forces adding variability.

Attribution of recent climate change is the effort to scientifically ascertain mechanisms responsible for recent global warming and related climate changes on Earth. The effort has focused on changes observed during the period of instrumental temperature record, particularly in the last 50 years. This is the period when human activity has grown fastest and observations of the atmosphere above the surface have become available. According to the Intergovernmental Panel on Climate Change (IPCC), it is "extremely likely" that human influence was the dominant cause of global warming between 1951 and 2010. Likely human contribution is 93%–123% of the observed 1951–2010 temperature change.

Some of the main human activities that contribute to global warming are:

Probability density function (PDF) of fraction of surface temperature trends since 1950 attributable to human activity, based on IPCC AR5 10.5

In addition to human activities, some natural mechanisms can also cause climate change, including for example, climate oscillations, changes in solar activity, and volcanic activity.

Multiple lines of evidence support attribution of recent climate change to human activities:

  • A physical understanding of the climate system: greenhouse gas concentrations have increased and their warming properties are well-established.
  • Historical estimates of past climate changes suggest that the recent changes in global surface temperature are unusual.
  • Computer-based climate models are unable to replicate the observed warming unless human greenhouse gas emissions are included.
  • Natural forces alone (such as solar and volcanic activity) cannot explain the observed warming.

The IPCC's attribution of recent global warming to human activities is a view shared by the scientific community, and is also supported by 196 other scientific organizations worldwide.

Background

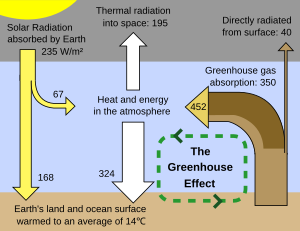
Energy flows between space, the atmosphere, and Earth's surface. Current greenhouse gas levels are causing a radiative imbalance of about 0.9 W/m2.

Factors affecting Earth's climate can be broken down into feedbacks and forcings. A forcing is something that is imposed externally on the climate system. External forcings include natural phenomena such as volcanic eruptions and variations in the sun's output. Human activities can also impose forcings, for example, through changing the composition of the atmosphere.

Radiative forcing is a measure of how various factors alter the energy balance of the Earth's atmosphere. A positive radiative forcing will tend to increase the energy of the Earth-atmosphere system, leading to a warming of the system. Between the start of the Industrial Revolution in 1750, and the year 2005, the increase in the atmospheric concentration of carbon dioxide (chemical formula: CO
2
) led to a positive radiative forcing, averaged over the Earth's surface area, of about 1.66 watts per square metre (abbreviated W m−2).

Climate feedbacks can either amplify or dampen the response of the climate to a given forcing. There are many feedback mechanisms in the climate system that can either amplify (a positive feedback) or diminish (a negative feedback) the effects of a change in climate forcing.

The climate system will vary in response to changes in forcings. The climate system will show internal variability both in the presence and absence of forcings imposed on it, (see images opposite). This internal variability is a result of complex interactions between components of the climate system, such as the coupling between the atmosphere and ocean (see also the later section on Internal climate variability and global warming). An example of internal variability is the El Niño–Southern Oscillation.

Detection vs. attribution

In detection and attribution, natural factors include changes in the Sun's output and volcanic eruptions, as well as natural modes of variability such as El Niño and La Niña. Human factors include the emissions of heat-trapping "greenhouse" gases and particulates as well as clearing of forests and other land-use changes. Figure source: NOAA NCDC.

Detection and attribution of climate signals, as well as its common-sense meaning, has a more precise definition within the climate change literature, as expressed by the IPCC. Detection of a climate signal does not always imply significant attribution. The IPCC's Fourth Assessment Report says "it is extremely likely that human activities have exerted a substantial net warming influence on climate since 1750," where "extremely likely" indicates a probability greater than 95%. Detection of a signal requires demonstrating that an observed change is statistically significantly different from that which can be explained by natural internal variability.

Attribution requires demonstrating that a signal is:

  • unlikely to be due entirely to internal variability;
  • consistent with the estimated responses to the given combination of anthropogenic and natural forcing
  • not consistent with alternative, physically plausible explanations of recent climate change that exclude important elements of the given combination of forcings.

Key attributions

Greenhouse gases

Radiative forcing of different contributors to climate change in 2011, as reported in the fifth IPCC assessment report.

Carbon dioxide is the primary greenhouse gas that is contributing to recent climate change. CO
2
is absorbed and emitted naturally as part of the carbon cycle, through animal and plant respiration, volcanic eruptions, and ocean-atmosphere exchange. Human activities, such as the burning of fossil fuels and changes in land use (see below), release large amounts of carbon to the atmosphere, causing CO
2
concentrations in the atmosphere to rise.

The high-accuracy measurements of atmospheric CO
2
concentration, initiated by Charles David Keeling in 1958, constitute the master time series documenting the changing composition of the atmosphere. These data have iconic status in climate change science as evidence of the effect of human activities on the chemical composition of the global atmosphere.

In May 2019, the concentration of CO
2
in the atmosphere reached 415 ppm. The last time when it reached this level was 2.6–5.3 million years ago. Without human intervention, it would be 280 ppm.

Along with CO
2
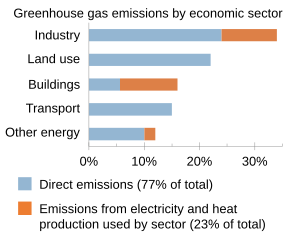
, methane and to a lesser extent nitrous oxide are also major forcing contributors to the greenhouse effect. The Kyoto Protocol lists these together with hydrofluorocarbon (HFCs), perfluorocarbons (PFCs), and sulfur hexafluoride (SF6), which are entirely artificial gases, as contributors to radiative forcing. The chart at right attributes anthropogenic greenhouse gas emissions to eight main economic sectors, of which the largest contributors are power stations (many of which burn coal or other fossil fuels), industrial processes, transportation fuels (generally fossil fuels), and agricultural by-products (mainly methane from enteric fermentation and nitrous oxide from fertilizer use).

Water vapor

Water vapor is the most abundant greenhouse gas and is the largest contributor to the natural greenhouse effect, despite having a short atmospheric lifetime (about 10 days). Some human activities can influence local water vapor levels. However, on a global scale, the concentration of water vapor is controlled by temperature, which influences overall rates of evaporation and precipitation. Therefore, the global concentration of water vapor is not substantially affected by direct human emissions.

Land use

Climate change is attributed to land use for two main reasons. Between 1750 and 2007, about two-thirds of anthropogenic CO
2
emissions were produced from burning fossil fuels, and about one-third of emissions from changes in land use, primarily deforestation. Deforestation both reduces the amount of carbon dioxide absorbed by deforested regions and releases greenhouse gases directly, together with aerosols, through biomass burning that frequently accompanies it.

Some of the causes of climate change are, generally, not connected with it directly in the media coverage. For example, the harm done by humans to the populations of Elephants and Monkeys contributes to deforestation therefore to climate change.

A second reason that climate change has been attributed to land use is that the terrestrial albedo is often altered by use, which leads to radiative forcing. This effect is more significant locally than globally.

Livestock and land use

Worldwide, livestock production occupies 70% of all land used for agriculture, or 30% of the ice-free land surface of the Earth. More than 18% of anthropogenic greenhouse gas emissions are attributed to livestock and livestock-related activities such as deforestation and increasingly fuel-intensive farming practices. Specific attributions to the livestock sector include:

Aerosols

With virtual certainty, scientific consensus has attributed various forms of climate change, chiefly cooling effects, to aerosols, which are small particles or droplets suspended in the atmosphere. Key sources to which anthropogenic aerosols are attributed include:

Attribution of 20th-century climate change

The Keeling Curve shows the long-term increase of atmospheric carbon dioxide (CO
2
) concentrations from 1958–2018. Monthly CO
2
measurements display seasonal oscillations in an upward trend. Each year's maximum occurs during the Northern Hemisphere's late spring.
 
CO
2
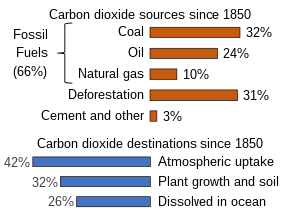
sources and sinks since 1880. While there is little debate that excess carbon dioxide in the industrial era has mostly come from burning fossil fuels, the future strength of land and ocean carbon sinks is an area of study.
 
Contribution to climate change broken down by economic sectors, according to the IPCC AR5 report.

Over the past 150 years human activities have released increasing quantities of greenhouse gases into the atmosphere. This has led to increases in mean global temperature, or global warming. Other human effects are relevant—for example, sulphate aerosols are believed to have a cooling effect. Natural factors also contribute. According to the historical temperature record of the last century, the Earth's near-surface air temperature has risen around 0.74 ± 0.18 °Celsius (1.3 ± 0.32 °Fahrenheit).

A historically important question in climate change research has regarded the relative importance of human activity and non-anthropogenic causes during the period of instrumental record. In the 1995 Second Assessment Report (SAR), the IPCC made the widely quoted statement that "The balance of evidence suggests a discernible human influence on global climate". The phrase "balance of evidence" suggested the (English) common-law standard of proof required in civil as opposed to criminal courts: not as high as "beyond reasonable doubt". In 2001 the Third Assessment Report (TAR) refined this, saying "There is new and stronger evidence that most of the warming observed over the last 50 years is attributable to human activities". The 2007 Fourth Assessment Report (AR4) strengthened this finding:

  • "Anthropogenic warming of the climate system is widespread and can be detected in temperature observations taken at the surface, in the free atmosphere and in the oceans. Evidence of the effect of external influences, both anthropogenic and natural, on the climate system has continued to accumulate since the TAR."

Other findings of the IPCC Fourth Assessment Report include:

  • "It is extremely unlikely (<5%) that the global pattern of warming during the past half century can be explained without external forcing (i.e., it is inconsistent with being the result of internal variability), and very unlikely that it is due to known natural external causes alone. The warming occurred in both the ocean and the atmosphere and took place at a time when natural external forcing factors would likely have produced cooling."
  • "From new estimates of the combined anthropogenic forcing due to greenhouse gases, aerosols, and land surface changes, it is extremely likely (>95%) that human activities have exerted a substantial net warming influence on climate since 1750."
  • "It is virtually certain that anthropogenic aerosols produce a net negative radiative forcing (cooling influence) with a greater magnitude in the Northern Hemisphere than in the Southern Hemisphere."

Over the past five decades there has been a global warming of approximately 0.65 °C (1.17 °F) at the Earth's surface (see historical temperature r

In paleoanthropology, the recent African origin of modern humans, also called the "Out of Africa" theory (OOA), recent single-origin hypothesis (RSOH), replacement hypothesis, or recent African origin model (RAO), is the dominant model of the geographic origin and early migration of anatomically modern humans (Homo sapiens). It follows the early expansions of hominins out of Africa, accomplished by Homo erectus and then Homo neanderthalensis.

The model proposes a "single origin" of Homo sapiens in the taxonomic sense, precluding parallel evolution of traits considered anatomically modern in other regions, but not precluding multiple admixture between H. sapiens and archaic humans in Europe and Asia. H. sapiens most likely developed in the Horn of Africa between 300,000 and 200,000 years ago. The "recent African origin" model proposes that all modern non-African populations are substantially descended from populations of H. sapiens that left Africa after that time.

There were at least several "out-of-Africa" dispersals of modern humans, possibly beginning as early as 270,000 years ago, including 215,000 years ago to at least Greece, and certainly via northern Africa about 130,000 to 115,000 years ago. These early waves appear to have mostly died out or retreated by 80,000 years ago.

The most significant "recent" wave took place about 70,000–50,000 years ago, via the so-called "Southern Route", spreading rapidly along the coast of Asia and reaching Australia by around 65,000–50,000 years ago, (though some researchers question the earlier Australian dates and place the arrival of humans there at 50,000 years ago at earliest, while others have suggested that these first settlers of Australia may represent an older wave before the more significant out of Africa migration and thus not necessarily be ancestral to the region's later inhabitants) while Europe was populated by an early offshoot which settled the Near East and Europe less than 55,000 years ago.

In the 2010s, studies in population genetics uncovered evidence of interbreeding that occurred between H. sapiens and archaic humans in Eurasia, Oceania and Africa, indicating that modern population groups, while mostly derived from early H. sapiens, are to a lesser extent also descended from regional variants of archaic humans.

ecord). Among the possible factors that could produce changes in global mean temperature are internal variability of the climate system, external forcing, an increase in concentration of greenhouse gases, or any combination of these. Current studies indicate that the increase in greenhouse gases, most notably CO
2
, is mostly responsible for the observed warming. Evidence for this conclusion includes:

  • Estimates of internal variability from climate models, and reconstructions of past temperatures, indicate that the warming is unlikely to be entirely natural.
  • Climate models forced by natural factors and increased greenhouse gases and aerosols reproduce the observed global temperature changes; those forced by natural factors alone do not.
  • "Fingerprint" methods (see below) indicate that the pattern of change is closer to that expected from greenhouse gas-forced change than from natural change.
  • The plateau in warming from the 1940s to 1960s can be attributed largely to sulphate aerosol cooling.

Details on attribution

Recent scientific assessments find that most of the warming of the Earth's surface over the past 50 years has been caused by human activities (see also the section on scientific literature and opinion). This conclusion rests on multiple lines of evidence. Like the warming "signal" that has gradually emerged from the "noise" of natural climate variability, the scientific evidence for a human influence on global climate has accumulated over the past several decades, from many hundreds of studies. No single study is a "smoking gun." Nor has any single study or combination of studies undermined the large body of evidence supporting the conclusion that human activity is the primary driver of recent warming.

The first line of evidence is based on a physical understanding of how greenhouse gases trap heat, how the climate system responds to increases in greenhouse gases, and how other human and natural factors influence climate. The second line of evidence is from indirect estimates of climate changes over the last 1,000 to 2,000 years. These records are obtained from living things and their remains (like tree rings and corals) and from physical quantities (like the ratio between lighter and heavier isotopes of oxygen in ice cores), which change in measurable ways as climate changes. The lesson from these data is that global surface temperatures over the last several decades are clearly unusual, in that they were higher than at any time during at least the past 400 years. For the Northern Hemisphere, the recent temperature rise is clearly unusual in at least the last 1,000 years (see graph opposite).

The third line of evidence is based on the broad, qualitative consistency between observed changes in climate and the computer model simulations of how climate would be expected to change in response to human activities. For example, when climate models are run with historical increases in greenhouse gases, they show gradual warming of the Earth and ocean surface, increases in ocean heat content and the temperature of the lower atmosphere, a rise in global sea level, retreat of sea ice and snow cover, cooling of the stratosphere, an increase in the amount of atmospheric water vapor, and changes in large-scale precipitation and pressure patterns. These and other aspects of modelled climate change are in agreement with observations.

"Fingerprint" studies

Top panel: Observed global average temperature change (1870— ).
Bottom panel: Data from the Fourth National Climate Assessment is merged for display on the same scale to emphasize relative strengths of forces affecting temperature change. Human-caused forces have increasingly dominated.

Finally, there is extensive statistical evidence from so-called "fingerprint" studies. Each factor that affects climate produces a unique pattern of climate response, much as each person has a unique fingerprint. Fingerprint studies exploit these unique signatures, and allow detailed comparisons of modelled and observed climate change patterns. Scientists rely on such studies to attribute observed changes in climate to a particular cause or set of causes. In the real world, the climate changes that have occurred since the start of the Industrial Revolution are due to a complex mixture of human and natural causes. The importance of each individual influence in this mixture changes over time. Of course, there are not multiple Earths, which would allow an experimenter to change one factor at a time on each Earth, thus helping to isolate different fingerprints. Therefore, climate models are used to study how individual factors affect climate. For example, a single factor (like greenhouse gases) or a set of factors can be varied, and the response of the modelled climate system to these individual or combined changes can thus be studied.

These projections have been confirmed by observations (shown above). For example, when climate model simulations of the last century include all of the major influences on climate, both human-induced and natural, they can reproduce many important features of observed climate change patterns. When human influences are removed from the model experiments, results suggest that the surface of the Earth would actually have cooled slightly over the last 50 years. The clear message from fingerprint studies is that the observed warming over the last half-century cannot be explained by natural factors, and is instead caused primarily by human factors.

Another fingerprint of human effects on climate has been identified by looking at a slice through the layers of the atmosphere, and studying the pattern of temperature changes from the surface up through the stratosphere (see the section on solar activity). The earliest fingerprint work focused on changes in surface and atmospheric temperature. Scientists then applied fingerprint methods to a whole range of climate variables, identifying human-caused climate signals in the heat content of the oceans, the height of the tropopause (the boundary between the troposphere and stratosphere, which has shifted upward by hundreds of feet in recent decades), the geographical patterns of precipitation, drought, surface pressure, and the runoff from major river basins.

Studies published after the appearance of the IPCC Fourth Assessment Report in 2007 have also found human fingerprints in the increased levels of atmospheric moisture (both close to the surface and over the full extent of the atmosphere), in the decline of Arctic sea ice extent, and in the patterns of changes in Arctic and Antarctic surface temperatures.

The message from this entire body of work is that the climate system is telling a consistent story of increasingly dominant human influence – the changes in temperature, ice extent, moisture, and circulation patterns fit together in a physically consistent way, like pieces in a complex puzzle.

Increasingly, this type of fingerprint work is shifting its emphasis. As noted, clear and compelling scientific evidence supports the case for a pronounced human influence on global climate. Much of the recent attention is now on climate changes at continental and regional scales, and on variables that can have large impacts on societies. For example, scientists have established causal links between human activities and the changes in snowpack, maximum and minimum (diurnal) temperature, and the seasonal timing of runoff over mountainous regions of the western United States. Human activity is likely to have made a substantial contribution to ocean surface temperature changes in hurricane formation regions. Researchers are also looking beyond the physical climate system, and are beginning to tie changes in the distribution and seasonal behaviour of plant and animal species to human-caused changes in temperature and precipitation.

For over a decade, one aspect of the climate change story seemed to show a significant difference between models and observations. In the tropics, all models predicted that with a rise in greenhouse gases, the troposphere would be expected to warm more rapidly than the surface. Observations from weather balloons, satellites, and surface thermometers seemed to show the opposite behaviour (more rapid warming of the surface than the troposphere). This issue was a stumbling block in understanding the causes of climate change. It is now largely resolved. Research showed that there were large uncertainties in the satellite and weather balloon data. When uncertainties in models and observations are properly accounted for, newer observational data sets (with better treatment of known problems) are in agreement with climate model results.

This does not mean, however, that all remaining differences between models and observations have been resolved. The observed changes in some climate variables, such as Arctic sea ice, some aspects of precipitation, and patterns of surface pressure, appear to be proceeding much more rapidly than models have projected. The reasons for these differences are not well understood. Nevertheless, the bottom-line conclusion from climate fingerprinting is that most of the observed changes studied to date are consistent with each other, and are also consistent with our scientific understanding of how the climate system would be expected to respond to the increase in heat-trapping gases resulting from human activities.

Extreme weather events

refer to caption
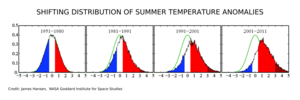
Frequency of occurrence (vertical axis) of local June–July–August temperature anomalies (relative to 1951–1980 mean) for Northern Hemisphere land in units of local standard deviation (horizontal axis). According to Hansen et al. (2012), the distribution of anomalies has shifted to the right as a consequence of global warming, meaning that unusually hot summers have become more common. This is analogous to the rolling of a dice: cool summers now cover only half of one side of a six-sided die, white covers one side, red covers four sides, and an extremely hot (red-brown) anomaly covers half of one side.

One of the subjects discussed in the literature is whether or not extreme weather events can be attributed to human activities. Seneviratne et al. (2012) stated that attributing individual extreme weather events to human activities was challenging. They were, however, more confident over attributing changes in long-term trends of extreme weather. For example, Seneviratne et al. (2012) concluded that human activities had likely led to a warming of extreme daily minimum and maximum temperatures at the global scale.

Another way of viewing the problem is to consider the effects of human-induced climate change on the probability of future extreme weather events. Stott et al. (2003), for example, considered whether or not human activities had increased the risk of severe heat waves in Europe, like the one experienced in 2003. Their conclusion was that human activities had very likely more than doubled the risk of heat waves of this magnitude.

An analogy can be made between an athlete on steroids and human-induced climate change. In the same way that an athlete's performance may increase from using steroids, human-induced climate change increases the risk of some extreme weather events.

Hansen et al. (2012) suggested that human activities have greatly increased the risk of summertime heat waves. According to their analysis, the land area of the Earth affected by very hot summer temperature anomalies has greatly increased over time (refer to graphs on the left). In the base period 1951–1980, these anomalies covered a few tenths of 1% of the global land area. In recent years, this has increased to around 10% of the global land area. With high confidence, Hansen et al. (2012) attributed the 2010 Moscow and 2011 Texas heat waves to human-induced global warming.

An earlier study by Dole et al. (2011) concluded that the 2010 Moscow heatwave was mostly due to natural weather variability. While not directly citing Dole et al. (2011), Hansen et al. (2012) rejected this type of explanation. Hansen et al. (2012) stated that a combination of natural weather variability and human-induced global warming was responsible for the Moscow and Texas heat waves.

Scientific literature and opinion

There are a number of examples of published and informal support for the consensus view. As mentioned earlier, the IPCC has concluded that most of the observed increase in globally averaged temperatures since the mid-20th century is "very likely" due to human activities. The IPCC's conclusions are consistent with those of several reports produced by the US National Research Council. A report published in 2009 by the U.S. Global Change Research Program concluded that "[global] warming is unequivocal and primarily human-induced." A number of scientific organizations have issued statements that support the consensus view. Two examples include:

Detection and attribution studies

Refer to caption
This image shows three examples of internal climate variability measured between 1950 and 2012: the El Niño–Southern oscillation, the Arctic oscillation, and the North Atlantic oscillation.

The IPCC Fourth Assessment Report (2007), concluded that attribution was possible for a number of observed changes in the climate (see effects of global warming). However, attribution was found to be more difficult when assessing changes over smaller regions (less than continental scale) and over short time periods (less than 50 years). Over larger regions, averaging reduces natural variability of the climate, making detection and attribution easier.

  • In 1996, in a paper in Nature titled "A search for human influences on the thermal structure of the atmosphere", Benjamin D. Santer et al. wrote: "The observed spatial patterns of temperature change in the free atmosphere from 1963 to 1987 are similar to those predicted by state-of-the-art climate models incorporating various combinations of changes in carbon dioxide, anthropogenic sulphate aerosol and stratospheric ozone concentrations. The degree of pattern similarity between models and observations increases through this period. It is likely that this trend is partially due to human activities, although many uncertainties remain, particularly relating to estimates of natural variability."
  • A 2002 paper in the Journal of Geophysical Research says "Our analysis suggests that the early twentieth century warming can best be explained by a combination of warming due to increases in greenhouse gases and natural forcing, some cooling due to other anthropogenic forcings, and a substantial, but not implausible, contribution from internal variability. In the second half of the century we find that the warming is largely caused by changes in greenhouse gases, with changes in sulphates and, perhaps, volcanic aerosol offsetting approximately one third of the warming."
  • A 2005 review of detection and attribution studies by the International Ad hoc Detection and Attribution Group found that "natural drivers such as solar variability and volcanic activity are at most partially responsible for the large-scale temperature changes observed over the past century, and that a large fraction of the warming over the last 50 yr can be attributed to greenhouse gas increases. Thus, the recent research supports and strengthens the IPCC Third Assessment Report conclusion that 'most of the global warming over the past 50 years is likely due to the increase in greenhouse gases.'"
  • Barnett and colleagues (2005) say that the observed warming of the oceans "cannot be explained by natural internal climate variability or solar and volcanic forcing, but is well simulated by two anthropogenically forced climate models," concluding that "it is of human origin, a conclusion robust to observational sampling and model differences".
  • Two papers in the journal Science in August 2005 resolve the problem, evident at the time of the TAR, of tropospheric temperature trends (see also the section on "fingerprint" studies) . The UAH version of the record contained errors, and there is evidence of spurious cooling trends in the radiosonde record, particularly in the tropics. See satellite temperature measurements for details; and the 2006 US CCSP report.
  • Multiple independent reconstructions of the temperature record of the past 1000 years confirm that the late 20th century is probably the warmest period in that time (see the preceding section -details on attribution).

Reviews of scientific opinion

  • An essay in Science surveyed 928 abstracts related to climate change, and concluded that most journal reports accepted the consensus. This is discussed further in scientific consensus on climate change.
  • A 2010 paper in the Proceedings of the National Academy of Sciences found that among a pool of roughly 1,000 researchers who work directly on climate issues and publish the most frequently on the subject, 97% agree that anthropogenic climate change is happening.
  • A 2011 paper from George Mason University published in the International Journal of Public Opinion Research, "The Structure of Scientific Opinion on Climate Change," collected the opinions of scientists in the earth, space, atmospheric, oceanic or hydrological sciences. The 489 survey respondents—representing nearly half of all those eligible according to the survey's specific standards – work in academia, government, and industry, and are members of prominent professional organizations. The study found that 97% of the 489 scientists surveyed agreed that global temperatures have risen over the past century. Moreover, 84% agreed that "human-induced greenhouse warming" is now occurring." Only 5% disagreed with the idea that human activity is a significant cause of global warming.

As described above, a small minority of scientists do disagree with the consensus. For example, Willie Soon and Richard Lindzen say that there is insufficient proof for anthropogenic attribution. Generally this position requires new physical mechanisms to explain the observed warming.

Solar activity

The graph shows the solar irradiance without a long-term trend. The 11-year solar cycle is also visible. The temperature, in contrast, shows an upward trend.
Solar irradiance (yellow) plotted together with temperature (red) over 1880 to 2018.
 
Modeled simulation of the effect of various factors (including GHGs, Solar irradiance) singly and in combination, showing in particular that solar activity produces a small and nearly uniform warming, unlike what is observed.

Solar sunspot maximum occurs when the magnetic field of the Sun collapses and reverse as part of its average 11-year solar cycle (22 years for complete North to North restoration).

The role of the Sun in recent climate change has been looked at by climate scientists. Since 1978, output from the Sun has been measured by satellites significantly more accurately than was previously possible from the surface. These measurements indicate that the Sun's total solar irradiance has not increased since 1978, so the warming during the past 30 years cannot be directly attributed to an increase in total solar energy reaching the Earth (see graph above, left). In the three decades since 1978, the combination of solar and volcanic activity probably had a slight cooling influence on the climate.

Climate models have been used to examine the role of the Sun in recent climate change. Models are unable to reproduce the rapid warming observed in recent decades when they only take into account variations in total solar irradiance and volcanic activity. Models are, however, able to simulate the observed 20th century changes in temperature when they include all of the most important external forcings, including human influences and natural forcings. As has already been stated, Hegerl et al. (2007) concluded that greenhouse gas forcing had "very likely" caused most of the observed global warming since the mid-20th century. In making this conclusion, Hegerl et al. (2007) allowed for the possibility that climate models had been underestimated the effect of solar forcing.

The role of solar activity in climate change has also been calculated over longer time periods using "proxy" datasets, such as tree rings. Models indicate that solar and volcanic forcings can explain periods of relative warmth and cold between AD 1000 and 1900, but human-induced forcings are needed to reproduce the late-20th century warming.

Another line of evidence against the sun having caused recent climate change comes from looking at how temperatures at different levels in the Earth's atmosphere have changed. Models and observations (see figure above, middle) show that greenhouse gas results in warming of the lower atmosphere at the surface (called the troposphere) but cooling of the upper atmosphere (called the stratosphere). Depletion of the ozone layer by chemical refrigerants has also resulted in a cooling effect in the stratosphere. If the Sun was responsible for observed warming, warming of the troposphere at the surface and warming at the top of the stratosphere would be expected as increase solar activity would replenish ozone and oxides of nitrogen. The stratosphere has a reverse temperature gradient than the troposphere so as the temperature of the troposphere cools with altitude, the stratosphere rises with altitude. Hadley cells are the mechanism by which equatorial generated ozone in the tropics (highest area of UV irradiance in the stratosphere) is moved poleward. Global climate models suggest that climate change may widen the Hadley cells and push the jetstream northward thereby expanding the tropics region and resulting in warmer, dryer conditions in those areas overall.

Non-consensus views

Habibullo Abdussamatov (2004), head of space research at St. Petersburg's Pulkovo Astronomical Observatory in Russia, has argued that the sun is responsible for recently observed climate change. Journalists for news sources canada.com (Solomon, 2007b), National Geographic News (Ravilious, 2007), and LiveScience (Than, 2007) reported on the story of warming on Mars. In these articles, Abdussamatov was quoted. He stated that warming on Mars was evidence that global warming on Earth was being caused by changes in the sun.

Ravilious (2007) quoted two scientists who disagreed with Abdussamatov: Amato Evan, a climate scientist at the University of Wisconsin–Madison, in the US, and Colin Wilson, a planetary physicist at Oxford University in the UK. According to Wilson, "Wobbles in the orbit of Mars are the main cause of its climate change in the current era" (see also orbital forcing). Than (2007) quoted Charles Long, a climate physicist at Pacific Northwest National Laboratories in the US, who disagreed with Abdussamatov.

Than (2007) pointed to the view of Benny Peiser, a social anthropologist at Liverpool John Moores University in the UK. In his newsletter, Peiser had cited a blog that had commented on warming observed on several planetary bodies in the Solar system. These included Neptune's moon Triton, Jupiter, Pluto and Mars. In an e-mail interview with Than (2007), Peiser stated that:

"I think it is an intriguing coincidence that warming trends have been observed on a number of very diverse planetary bodies in our solar system, (...) Perhaps this is just a fluke."

Than (2007) provided alternative explanations of why warming had occurred on Triton, Pluto, Jupiter and Mars.

The US Environmental Protection Agency (US EPA, 2009) responded to public comments on climate change attribution. A number of commenters had argued that recent climate change could be attributed to changes in solar irradiance. According to the US EPA (2009), this attribution was not supported by the bulk of the scientific literature. Citing the work of the IPCC (2007), the US EPA pointed to the low contribution of solar irradiance to radiative forcing since the start of the Industrial Revolution in 1750. Over this time period (1750 to 2005), the estimated contribution of solar irradiance to radiative forcing was 5% the value of the combined radiative forcing due to increases in the atmospheric concentrations of carbon dioxide, methane and nitrous oxide (see graph opposite).

Effect of cosmic rays

Henrik Svensmark has suggested that the magnetic activity of the sun deflects cosmic rays, and that this may influence the generation of cloud condensation nuclei, and thereby have an effect on the climate. The website ScienceDaily reported on a 2009 study that looked at how past changes in climate have been affected by the Earth's magnetic field. Geophysicist Mads Faurschou Knudsen, who co-authored the study, stated that the study's results supported Svensmark's theory. The authors of the study also acknowledged that CO
2
plays an important role in climate change.

Consensus view on cosmic rays

The view that cosmic rays could provide the mechanism by which changes in solar activity affect climate is not supported by the literature. Solomon et al. (2007) state:

[..] the cosmic ray time series does not appear to correspond to global total cloud cover after 1991 or to global low-level cloud cover after 1994. Together with the lack of a proven physical mechanism and the plausibility of other causal factors affecting changes in cloud cover, this makes the association between galactic cosmic ray-induced changes in aerosol and cloud formation controversial

Studies by Lockwood and Fröhlich (2007) and Sloan and Wolfendale (2008) found no relation between warming in recent decades and cosmic rays. Pierce and Adams (2009) used a model to simulate the effect of cosmic rays on cloud properties. They concluded that the hypothesized effect of cosmic rays was too small to explain recent climate change. Pierce and Adams (2009) noted that their findings did not rule out a possible connection between cosmic rays and climate change, and recommended further research.

Erlykin et al. (2009) found that the evidence showed that connections between solar variation and climate were more likely to be mediated by direct variation of insolation rather than cosmic rays, and concluded: "Hence within our assumptions, the effect of varying solar activity, either by direct solar irradiance or by varying cosmic ray rates, must be less than 0.07 °C since 1956, i.e. less than 14% of the observed global warming." Carslaw (2009) and Pittock (2009) review the recent and historical literature in this field and continue to find that the link between cosmic rays and climate is tenuous, though they encourage continued research. US EPA (2009) commented on research by Duplissy et al. (2009):

The CLOUD experiments at CERN are interesting research but do not provide conclusive evidence that cosmic rays can serve as a major source of cloud seeding. Preliminary results from the experiment (Duplissy et al., 2009) suggest that though there was some evidence of ion mediated nucleation, for most of the nucleation events observed the contribution of ion processes appeared to be minor. These experiments also showed the difficulty in maintaining sufficiently clean conditions and stable temperatures to prevent spurious aerosol bursts. There is no indication that the earlier Svensmark experiments could even have matched the controlled conditions of the CERN experiment. We find that the Svensmark results on cloud seeding have not yet been shown to be robust or sufficient to materially alter the conclusions of the assessment literature, especially given the abundance of recent literature that is skeptical of the cosmic ray-climate linkage.

Mandatory Palestine

From Wikipedia, the free encyclopedia https://en.wikipedia.org/wiki/Mandatory_Palestine   Palestine 1920–...