Search This Blog

Tuesday, September 2, 2014

Are lower pesticide residues a good reason to buy organic? Probably not.

Are lower pesticide residues a good reason to buy organic? Probably not.

The views expressed are those of the author and are not necessarily those of Scientific American.


A lot of organic supporters are up in arms about the recent Stanford study that found no nutritional benefit to organic foods. Stanford missed the point, they say—it’s not about what organic foods have in them, it’s what they don’t. After all, avoidance of pesticide residues is the #1 reason why people buy organic foods.

Yes, conventional foods have more synthetic pesticide residues than organic ones, on average. And yes, pesticides are dangerous chemicals. But does the science support paying significantly more for organic foods just to avoid synthetic pesticides? No.

A Pesticide Is A Pesticide

I’m not saying that pesticides, herbicides, and insect repellants aren’t toxic. I certainly wouldn’t recommend drinking cocktails laced with insect-repelling chemicals, for without a doubt, they can be bad for you. Pesticide exposure has been linked to all kinds of diseases and conditions, from neurodegenerative diseases like Parkinson’s to cancer. What we do know, though, is that natural isn’t synonymous with harmless. As a 2003 review of food safety concluded, “what should be made clear to consumers is that ‘organic’ does not equal ‘safe’.”

I’ve said it before and I’ll say it again: there is nothing safe about the chemicals used in organic agriculture. Period. This shouldn’t be that shocking – after all, a pesticide is a pesticide. “Virtually all chemicals can be shown to be dangerous at high doses,” explain scientists, “and this includes the thousands of natural chemicals that are consumed every day in food but most particularly in fruit and vegetables.”

There’s a reason we have an abundance of natural pesticides: plants and animals produce tens of thousands of chemicals to try and deter insects and herbivores from eating them. Most of these haven’t been tested for their toxic potential, as the Reduced Risk Program of the US Environmental Protection Agency (EPA) applies to synthetic pesticides only. As more research is done into their toxicity, however, we find they are just as bad as synthetic pesticides, sometimes worse. Many natural pesticides have been found to be potential – or serious – health risks, including those used commonly in organic farming.

In head-to-head comparisons, natural pesticides don’t fare any better than synthetic ones. When I compared the organic chemicals copper sulfate and pyrethrum to the top synthetics, chlorpyrifos and chlorothalonil, I found that not only were the organic ones more acutely toxic, studies have found that they are more chronically toxic as well, and have higher negative impacts on non-target species.


My results match with other scientific comparisons. In their recommendations to Parliament in 1999, the Committee on European Communities noted that copper sulfate, in particular, was far more dangerous than the synthetic alternative. A review of their findings can be seen in the table on the right (from a recent review paper). Similarly, head to head comparisons have found that organic pesticides aren’t better for the environment, either.

Organic pesticides pose the same health risks as non-organic ones. No matter what anyone tells you, organic pesticides don’t just disappear. Rotenone is notorious for its lack of degradation, and copper sticks around for a long, long time. Studies have shown that copper sulfate, pyrethrins, and rotenone all can be detected on plants after harvest—for copper sulfate and rotenone, those levels exceeded safe limits. One study found such significant rotenone residues in olives and olive oil to warrant “serious doubts…about the safety and healthiness of oils extracted from drupes treated with rotenone.” Just like with certain synthetic pesticides, organic pesticide exposure has health implications—a study in Texas found that rotenone exposure correlated to a significantly higher risk of Parkinson’s disease. The increased risk due to Rotenone was five times higher than the risk posed by the synthetic alternative, chlorpyrifos. Similarly, the FDA has known for a while that chronic exposure to copper sulfate can lead to anemia and liver disease.

So why do we keep hearing that organic foods have fewer pesticide residues? Well, because they have lower levels of synthetic pesticide residues. Most of our data on pesticide residues in food comes from surveys like the USDA’s Pesticide Data Program (PDP). But the while the PDP has been looking at the residues of over 300 pesticides in foods for decades, rotenone and copper sulfate aren’t among the usual pesticides tested for—maybe, because for several organic pesticides, fast, reliable methods for detecting them were only developed recently. And, since there isn’t any public data on the use of organic pesticides in organic farming (like there is for conventional farms), we’re left guessing what levels of organic pesticides are on and in organic foods.

So, if you’re going to worry about pesticides, worry about all of them, organic and synthetic. But, really, should you worry at all?

You Are What You Eat? Maybe Not.

We know, quite assuredly, that conventionally produced foods do contain higher levels of synthetic chemicals. But do these residues matter?

While study after study can find pesticide residues on foods, they are almost always well below safety standards. Almost all pesticides detected on foods by the USDA and independent scientific studies are at levels below 1% of the Acceptable Daily Intake (ADI) set by government regulators. This level isn’t random – the ADI is based on animal exposure studies in a wide variety of species. First, scientists give animals different amounts of pesticides on a daily basis throughout their lifetimes and monitor those animals for toxic effects. Through this, they determine the highest dose at which no effects can be found. The ADI is then typically set 100 times lower than that level. So a typical human exposure that is 1% of the ADI is equivalent to an exposure 10,000 times lower than levels that are safe in animal models.

Systematic reviews of dietary pesticide exposure all come to the same conclusion: that typical dietary exposure to pesticide residues in foods poses minimal risks to humans. As the book Health Benefits of Organic Food explains, “while there is some evidence that consuming organic produce will lead to lower exposure of pesticides compared to the consumption of conventional produce, there is no evidence of effect at contemporary concentrations.” Or, as a recent review states, “from a practical standpoint, the marginal benefits of reducing human exposure to pesticides in the diet through increased consumption of organic produce appear to be insignificant.”

Reviews of the negative health effects of pesticides find that dangerous exposure levels don’t come from food. Instead, non-dietary routes make for the vast majority of toxin exposures, in particular the use of pesticides around the home and workplace. A review of the worldwide disease burden caused by chemicals found that 70% can be attributed to air pollution, with acute poisonings and occupational exposures coming in second and third. Similarly, studies have found that indoor air concentrations of pesticides, not the amount on foodstuffs, correlate strongly to the amount of residues found in pregnant women (and even still, there was no strong correlation between exposure and health effects). Similarly, other studies have found that exposures to toxic pyrethroids come primarily from the environment. Children on organic diets routeinely had pyrethroids in their systems, and the organic group actually had higher levels of several pyrethroid metabolites than the conventional one. In other words, you have more to fear from your home than from your food.

Your home probably contains more pesticides than you ever imagined. Plastics and paints often contain fungicides to prevent mold—fungi that, by the way, can kill you. Your walls, carpets and floors also contain pesticides. Cleaning products and disenfectants contains pesticides and fungicides so they can do their job. Ever used an exterminator to get rid of mice, termites, fleas or cockroaches? That stuff can linger for months. Step outside your house, and just about everything you touch has come in contact with a pesticide. Insecticides are used in processing, manufacturing, and packaging, not to mention that even grocery stores use pesticides to keep insects and rodents at bay. These chemicals are all around you, every day, fighting off the pests that destroy our buildings and our food. It’s not surprising that most pesticide exposures doesn’t come from your food.

That said, there are some studies that have found a link between diet and exposure to specific pesticides, particularly synthetic organophosphorus pesticides. Lu et al. found that switching children from a conventional food diet to an entirely organic one dropped the urinary levels of specific metabolites for malathion and chlorpyrifos to nondetectable levels in a matter of days. But, it’s important to note that even the levels they detected during the conventional diet are three orders of magnitude lower than the levels needed in animal experiments to cause neurodevelopmental or other adverse health effects.

While it might seem that decreasing exposure to pesticides in any way could only be good for you, toxicologists would differ. Contrary to what you might think, lower exposure isn’t necessarily better. It’s what’s known as hormesis, or a hormetic dose response curve. There is evidence that exposure to most chemicals at doses significantly below danger thresholds, even pesticides, is beneficial when compared to no exposure at all. Why? Perhaps because it kick starts our immune system. Or, perhaps, because pesticides activate beneficial biological pathways. For most chemicals, we simply don’t know. What we do know is that data collected from 5000 dose response measurements (abstracted from over 20,000 studies) found that low doses of many supposedly toxic chemicals, metals, pesticides and fungicides either reduced cancer rates below controls or increased longevity or growth in a variety of animals. So while high acute and chronic exposures are bad, the levels we see in food that are well below danger thresholds may even be good for us. This isn’t as surprising as you might think—just look at most pharmaceuticals. People take low doses of aspirin daily to improve their heart health, but at high chronic doses, it can cause anything from vomiting to seizures and even death. Similarly, a glass of red wine every day might be good for you. But ten glasses a day? Definitely not.

No Need To Fear

To date, there is no scientific evidence that eating an organic diet leads to better health.

What of all those studies I just mentioned linking pesticides to disorders? Well, exactly none of them looked at pesticides from dietary intake and health in people. Instead, they involve people with high occupational exposure (like farmers who spray pesticides) or household exposure (from gardening, etc). Judging the safety of dietary pesticide intake by high exposures is like judging the health impacts of red wine based on alcoholics. A systematic review of the literature found only three studies to date have looked at clinical outcomes of eating organic – and none found any difference between an organic and conventional diet. My question is: if organic foods are so much healthier, why aren’t there any studies that show people on an organic diet are healthier than people eating conventionally grown produce instead?

More to the point, if conventional pesticide residues on food (and not other, high exposure routes) are leading to rampant disease, we should be able to find evidence of the connection in longitudinal epidemiological studies—but we don’t. The epidemiological evidence for the danger of pesticide residues simply isn’t there.

If dietary exposure to pesticides was a significant factor in cancer rates, we would expect to see that people who eat more conventionally grown fruits and vegetable have higher rates of cancer. But instead, we see the opposite. People who eat more fruits and vegetables have significantly lower incidences of cancers, and those who eat the most are two times less likely to develop cancer than those who eat the least. While high doses of pesticides over time have been linked to cancer in lab animals and in vitro studies, “epidemiological studies do not support the idea that synthetic pesticide residues are important for human cancer.” Even the exposure to the persistent and villainized pesticide DDT has not been consistently linked to cancer. As a recent review of the literature summarized, “no hard evidence currently exists that toxic hazards such as pesticides have had a major impact on total cancer incidence and mortality, and this is especially true for diet-related exposures.”

The closest we have to studying the effects of diet on health are studies looking at farmers. However, farmers in general have high occupational pesticide exposures, and thus it’s impossible to tease out occupational versus dietary exposure. Even still, in this high-risk group, studies simply don’t find health differences between organic and conventional farmers. A UK study found that conventional farmers were just as healthy as organic ones, though the organic ones were happier. Similarly, while test-tube studies of high levels of pesticides are known to cause reproductive disorders, a comparison of sperm quality from organic and conventional farmers was unable to connect dietary intake of over 40 different pesticides to any kind of reproductive impairment. Instead, the two groups showed no statistical difference in their sperm quality.

In a review of the evidence for choosing organic food, Christine Williams said it simply: “There are virtually no studies of any size that have evaluated the effects of organic v. conventionally-grown foods.” Thus, she explains, “conclusions cannot be drawn regarding potentially beneficial or adverse nutritional consequences, to the consumer, of increased consumption of organic food.”

“There is currently no evidence to support or refute claims that organic food is safer and thus, healthier, than conventional food, or vice versa. Assertions of such kind are inappropriate and not justified,” explain scientists. Neither organic nor conventional food is dangerous to eat, they say, and the constant attention to safety is unwarranted. Worse, it does more harm than good. The scientists chastise the media and industry alike for scaremongering tactics, saying that “the selective and partial presentation of evidence serves no useful purpose and does not promote public health. Rather, it raises fears about unsafe food.”

Furthermore, the focus on pesticides is misleading, as pesticide residues are the lowest food hazard when it comes to human health (as the figure from the paper on the right shows). They conclude that as far as the scientific evidence is concerned, “it seems that other factors, if any, rather than safety aspects speak in favor of organic food.”

If you don’t want to listen to those people or me, listen to the toxicologists, who study this stuff for a living. When probed about the risk that different toxins pose, over 85% rejected the notion that organic or “natural” products are safer than others. They felt that smoking, sun exposure and mercury were of much higher concern than pesticides. Over 90% agreed that the media does a terrible job of reporting the about toxic substances, mostly by overstating the risks. They slammed down hard on non-governmental organizations, too, for overstating risk.

What’s in a Name?

There’s good reason we can’t detect differences between organic and conventional diets: the labels don’t mean that much. Sure, organic farms have to follow a certain set of USDA guidelines, but farm to farm variability is huge for both conventional and organic practices. As a review of organic practices concluded: “variation within organic and conventional farming systems is likely as large as differences between the two systems.”

The false dichotomy between conventional and organic isn’t just misleading, it’s dangerous. Our constant attention to natural versus synthetic only causes fear and distrust, when in actuality, our food has never been safer. Eating less fruits and vegetables due to fear of pesticides or the high price of organics does far more harm to our health than any of the pesticide residues on our food.

Let me be clear about one thing: I’m all for reducing pesticide use. But we can’t forget that pesticides are used for a reason, too. We have been reaping the rewards of pesticide use for decades. Higher yields due to less crop destruction. Safer food because of reduced fungal and bacterial contamination. Lower prices as a result of increased supply and longer shelf life. Protection from pests that carry deadly diseases. Invasive species control, saving billions of dollars in damages—and the list goes on. Yes, we need to manage the way we use pesticides, scrutinize the chemicals involved and monitor their effects to ensure safety, and Big Ag (conventional and organic) needs to be kept in check. But without a doubt, our lives have been vastly improved by the chemicals we so quickly villainize.

If we want to achieve the balance between sustainability, production outputs, and health benefits, we have to stop focusing on brand names. Instead of emphasizing labels, we need to look at different farming practices and the chemicals involved and judge them independently of whether they fall under organic standards.

In the meantime, buy fresh, locally farmed produce, whether it’s organic or not; if you can talk to the farmers, you’ll know exactly what is and isn’t on your food. Wash it well, and you’ll get rid of most of whatever pesticides are on there, organic or synthetic. And eat lots and lots of fruits and vegetables—if there is anything that will improve your health, it’s that.

Before you say otherwise and get mad at me for mentioning it, rotenone is currently a USDA approved organic pesticide. It was temporarily banned, but reapproved in 2010. Before it was banned, it was the most commonly used organic pesticide, and now—well, without public data on pesticide use on organic farms, we have no idea how much it is being used today.
Food picture from FreeFoto.Com

Christie Wilcox  
About the Author: Christie Wilcox is a science writer and blogger who moonlights as a PhD student in Cell and Molecular Biology at the University of Hawaii. Follow on Google+. Follow on Twitter @NerdyChristie.
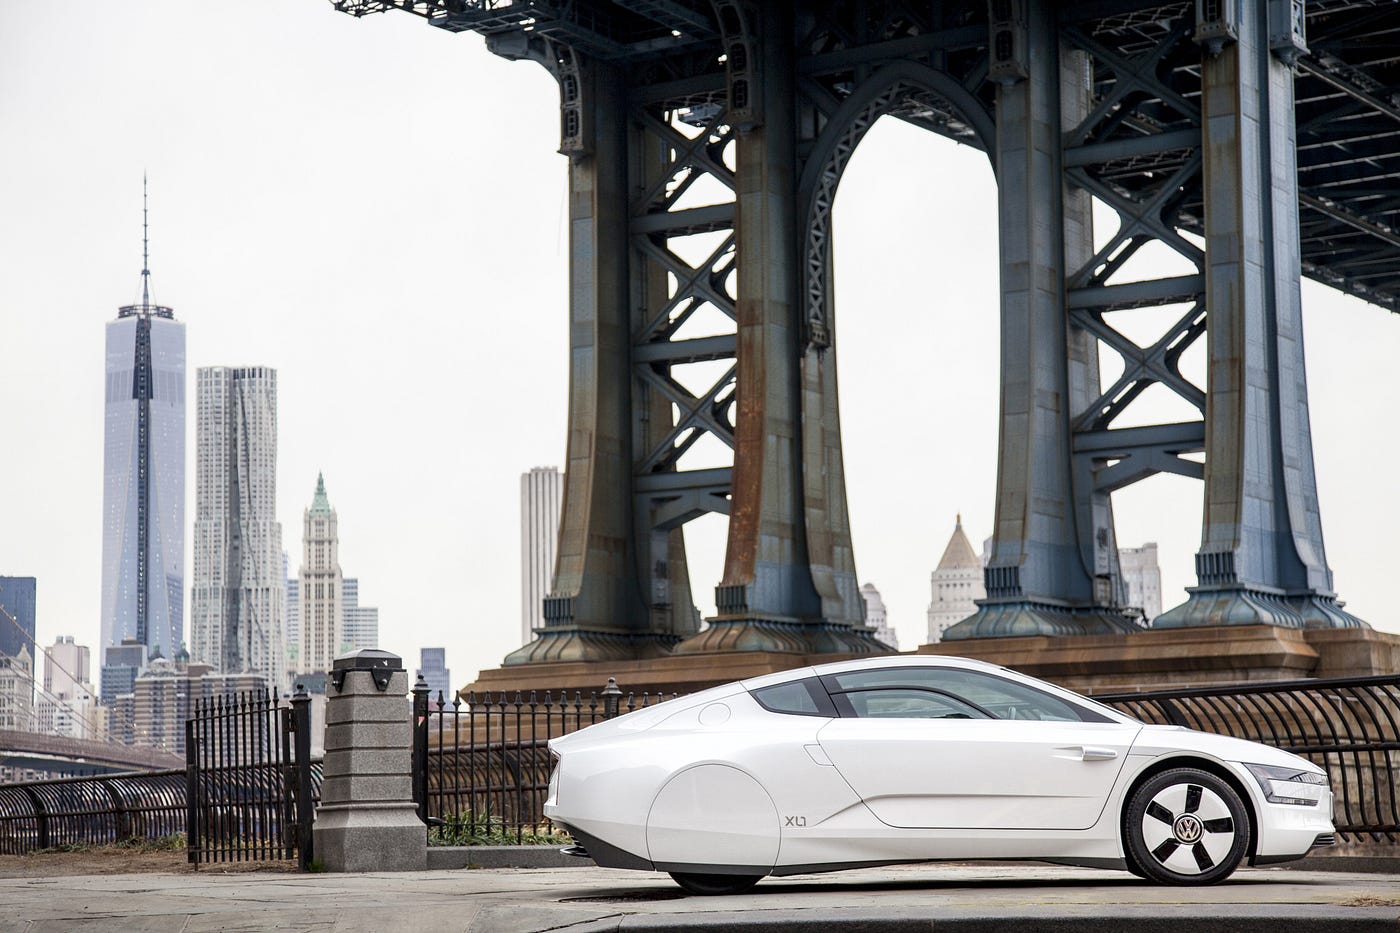

The Hypercar Lives: Meet VW’s XL1

The Hypercar Lives: Meet VW’s XL1

RMI followers and auto buffs often ask, ‘What happened to the hypercar?’ With the release of VW’s impressively fuel-efficient and strikingly similiar XL1, the world now has an answer.

Original link:  https://medium.com/solutions-journal-summer-2014/the-hypercar-lives-meet-vws-xl1-97603e97612f

Image copyright Volkswagen of America
When VW released the European fuel economy ratings for its new, limited-production XL1 passenger car last summer, you could almost hear the automotive world’s collective jaw drop. The XL1 came in at a staggering 313 miles per Imperial gallon of diesel. That’s the efficiency equivalent of more than 230 miles per U.S. gallon of gasoline. At a time when the 2014 model of the best-selling vehicle in the United States for more than three decades — Ford’s F-150 pickup truck — gets an EPA-rated 23 mpg highway, and the average for all model year 2013 light-duty vehicles sold in the U.S. was just 24.6 mpg, VW had moved the decimal point an entire place to the right.

Engineering leadership and platform fitness

The XL1 is named for its engineering goal: develop a production car that can drive 100 kilometers on 1 liter of fuel (235 miles per U.S. gallon). That was the charge in 1999 to VW engineers by the company’s visionary then-chairman, Ferdinand Piëch, who is Ferdinand Porsche’s grandson and chair of VW’s supervisory board today. “We built the Bugatti and now the XL1,” says Mark Gillies, manager of product and technology communications for VW of America. “Both use extreme technology to achieve almost opposite ends of the [performance] spectrum.”

The XL1’s tiny 2.6-gallon diesel-fuel tank can fuel average driving for more than 310 miles, thanks to a combination of strategies that RMI collectively calls platform fitness. That’s the key to the Hypercar concept developed by RMI chief scientist Amory Lovins in 1991 and evolved by RMI’s Hypercar Center through the 1990s. Hypercars integrate ultralight weight, superior aerodynamics, low-rolling-resistance tires, and a downsized and superefficient electrified powertrain. For example, VW’s XL1 weighs just 1,753 pounds. How? “We used mixed lightweight materials to bring out their best performance in their respective places in the vehicle,” explains Dr. Volker Kaese, VW’s project manager for the XL1. High-temperature-tolerant steel is used in the powertrain. Lighter, more flexible aluminum forms the chassis and crush zones. Polycarbonate side panels save weight and allow sleeker shapes. And the passenger cell is a carbon-fiber monocoque.

Then there’s the XL1’s astonishing aerodynamic drag coefficient. Lower is better, and the XL1’s 0.189 is the best ever in a production car. By comparison, a sleek and streamlined 2014 Corvette Stingray has a drag coefficient of 0.29 and Ford’s popular F-150 is around 0.40. The XL1 shaves drag everywhere it can, covering the rear wheels and replacing protruding side-view mirrors with low-profile, rear-facing cameras displayed on a dashboard screen.

Even before the first XL1 rolled off the production line, some were quick to point out the striking parallels between the Hypercar concept specs of the early 1990s and the real-world specs of today’s production XL1. “The XL1 is a hypercar in the way that might make Amory Lovins smile,” wrote High Gear Media’s Bengt Halvorson, in a piece that ran in the Washington Post. “That’s a nod to one of the creators of the original 1990s Hypercar project from Rocky Mountain Institute.” Similarly, automotive writer David Herron in Torque News noted, “the VW XL1 is the embodiment of the hypercar concept developed by Amory Lovins years ago.”

Besides Lovins himself, no one knows this better than Michael Brylawski. Currently the founder and CEO of Vision Fleet Capital, which works on clean vehicle adoption, he cofounded RMI’s sustainable transportation practice and later led strategy for RMI spinoffs Hypercar, Inc., its successor Fiberforge Corporation, and Bright Automotive. “When I saw the XL1 from VW, the specs looked quite similar to where Amory was predicting well over 20 years ago that vehicle design could go,” he explains. “The XL1 is the purest form of the Hypercar [on the market today]. The similarities are exceptional.”

From Hypercar concept to VW reality

RMI’s Hypercar started in 1990 with a $50,000 seed grant from the Nathan Cummings Foundation to “get Amory to think about cars.” The resulting paper, “Advanced Light Vehicle Concepts,” shocked the National Research Council’s auto-efficiency symposium, says Lovins. Don Runkle, then GM’s head of advanced engineering, took Lovins to lunch, and on a handshake, launched a fruitful two-year process of mutual education.

To say that Lovins, RMI, and Hypercar made a splash in the auto world would be an understatement. The British magazine Car named Lovins the 22nd most powerful person in the global automotive industry (and the only outsider). The Hypercar concept won the ISATA Nissan Prize and a World Technology Award — followed by another to Hypercar, Inc. In 1993, after two years’ validation with the industry, RMI put the Hypercar concept into the public domain so nobody could patent it and to encourage competition leveraging its ideas, while RMI’s for-profit spinoffs sought to commercialize technologies outside automakers’ comfort zone and raise the competitive pressure.

By the first half of the 2000s, you could read about the Hypercar everywhere from Automobile magazine to the Wall Street Journal to Environmental Health Perspectives. But a true Hypercar had yet to leap from the drawing board to the streets. “The roadmap was right, but the distance underestimated,” Brylawski says today.

Covering the rear wheels and eliminating protruding side-view mirors contributed to the XL1's astonishing aerodynamics. Image copyright Volkswagen of America

Indeed, many of Lovins’s predictions have come to pass. Two decades ago he claimed regenerative braking could yield 70 percent efficiency when automakers balked at the idea of exceeding 30. 

Today’s electric vehicles, including the Chevy Volt and Tesla Model S, respectively get 70+ and 80 percent. Meanwhile, the XL1’s specs are an eerily close match with Lovins’s early Hypercar predictions for achievable rolling resistance, aerodynamic drag, and more. (Unfortunately, estimates of fuel economy can’t be directly compared between the Hypercar and XL1 due to differences in their number of seats, U.S. vs. European test cycles, and changes in modeling and test cycle protocols, but both are far into triple digits.)

So if the Hypercar concept is now emergent reality, why aren’t more Hypercars on the road? “There’s a lot of hard work that goes between the idea and the execution,” says Brylawski. And that’s where VW’s XL1 is really notable. It combines an electrified hybrid powertrain, lightweight carbon fiber and other materials, and low aerodynamic drag and rolling resistance, bringing the Hypercar and other 1990s concepts like it — such as GM’s 1991 Ultralite — from drawing board to driver’s seat. Lovins, for his part, is thrilled — he would love to be VW’s first U.S. XL1 customer, he says.

The fuel-efficient road ahead

For all the similarities between Hypercar and XL1, there is at least one major point of departure: cost. The Hypercar was always meant to be competitively priced, but with a sticker price of $150,000, VW’s XL1 certainly is not. Its production run is just 250 copies — a niche, novelty vehicle for aficionados. “It’s something of a one-off,” says VW’s Gillies. “The market is effectively limited for [such an expensive] small economy car.”

But a high-volume car was never VW’s goal. The XL1 was a proof of concept, says Gillies, to “show the production feasibility; that VW has the vision and drive to get it through to production. It’s one thing to do a concept, but another to show you could actually build the thing.” Its innovations will doubtless inform other models.

A diesel-electric hybrid powertrain, combined with a mixed-material approach that shaves weight without sacrificing performance, enables XL1's impressive fuel economy. Image copyright Volkswagen of America

Despite XL1’s eye-popping mpg rating, VW might have left some efficiency on the table. Lovins notes that Toyota’s 2007 1/X concept car, also a plug-in hybrid, had four seats and the interior volume of a Prius, but weighed only 926 pounds, so even a production-ready version would probably weigh less than the two-seat XL1. “We’re seeing a lot of partially executed solutions,” says Jerry Weiland, the GM veteran who leads RMI’s transportation practice. “Different automakers have done bits and pieces [of the Hypercar concept], but no one has put the whole thing together.”

Equally surprisingly, the XL1 may actually take efficiency further than needed. RMI senior associate Jonathan Walker explains: “VW had a different goal than we do. Their goal was to make a 235-mpg car. In my opinion, you don’t need that,” he says. “RMI’s goal is get off carbon and oil. A 100 mpg car gets you there.” RMI’s Reinventing Fire analysis, he notes, can fuel its efficient vehicles, some at just half XL1’s efficiency, with any mixture of electricity, hydrogen, and advanced biofuels but no oil. “The added capital and cost of going for XL1 levels of efficiency is not worth it,” Walker says. “You start getting diminishing returns.” In other words, more modest but still radically improved fuel efficiency can yield an affordable Hypercar that doesn’t carry an XL1 price tag.

Runkle’s theory of economic gravity

“Amory gets full credit for putting these concepts on the table more than 20 years ago,” says Weiland. “But by now, the automakers have developed and productionized what they saw fit. If they’re not doing something, there’s probably a somewhat rational reason.” One of those reasons is federal fuel economy standards. Until recently, U.S. consumers haven’t been especially concerned about mpg in their car-buying decisions, so automakers have mostly done just enough to meet corporate average fuel economy (CAFE) requirements.

As Walker notes, those requirements, recently stiffened to 54.5 mpg for an automaker’s fleet by 2025, still might not move the needle. Many automakers can make more money paying modest penalties and selling gas-guzzlers than they can complying. Also, more-efficient hybrids and electric vehicles help automakers’ fleets meet the CAFE average standard while still including inefficient SUVs and pickup trucks.

But if CAFE standards are insufficient, that puts the ball squarely back in the court of economics. And Don Runkle has something to say about that.

Runkle is now executive chairman of EcoMotors, a firm pioneering superefficient internal combustion engines (which Lovins thinks could weigh far less than the XL1’s plug-in diesel-electric hybrid). Before EcoMotors, Runkle spent 30 years with GM, leading the Ultralite and other early-1990s Hypercar-esque concepts. “I was always involved in some attempt at extraordinary performance levels,” he says. “Sometimes it was outright speed or acceleration or fuel efficiency. You’re pushing the envelope. In terms of high performance — whether it’s acceleration or top speed — you’re always trying to make sure you had the structural integrity you needed at the lowest mass you could handle” — simultaneously boosting efficiency.

Like the Hypercar, his Ultralite team similarly pursued lightweighting, rolling resistance, aerodynamics, and a downsized powertrain to develop a sporty, 100-mpg, four-seat concept car. At some point, though, Runkle argues that eking out more mpg comes at a cost. If cost is no object, almost any level of performance — fuel economy or otherwise — is possible. But cost is an object. He calls it his theory of economic gravity.

“In a nutshell, it’s not hard to get high fuel economy. That’s a matter of physics,” he explains. “What’s hard is to get a technology that saves more than it costs. That’s economic gravity, where there’s a natural incentive.” Automakers more or less all have a spreadsheet, Runkle says, showing incremental efficiency gain vs. cost for a big portfolio of technology options — electric steering, lightweighting with carbon fiber, LED lights, lower-friction tires. Engineers start with the cheapest options and work their way down the list until they’ve met legal mpg requirements, he says.

“It’s always good to do the Hypercars, the Ultralites,” says Runkle. “They push the envelope. They help clarify the problem and show the promise. Then you can focus more on trying to solve the cost issues.”

A Hypercar for the masses

There is, of course, a very RMI way around the a la carte approach of Runkle’s spreadsheet: whole-systems thinking. “That’s the challenge if you’re only looking at single components versus a systems approach,” says Brylawski. “It’s challenging running a multi-billion-dollar, multi-million-unit auto company without some specializing,” Brylawski continues. “That’s a barrier to more holistic approaches” like VW’s XL1 and BMW’s i3, not to mention RMI’s Revolution concept, an early 2000s SUV designed by Hypercar, Inc. and two Tier Ones.

“What Amory and RMI showed [with Hypercar] is that change is hard but you can end up in a better place. But why change unless you have to?” That’s the rub. Inertia is strong. “The extreme retooling required, metaphorical and literal, hasn’t been compelling enough for automakers,” argues Brylawski. “Not until recently have you had a global regulatory and fuel price environment that makes it worthwhile” — and the threat, proven by Tesla, of outcompeting incumbents by making better autos that people will buy because they’re superior, not just because they’re more efficient.

Now, with automakers like VW leading the charge, and with manufacturing methods like RMI’s Fiberforge spinoff (whose technology was sold last year to German Tier One pressmaker Dieffenbacher), that could be changing. “Fast forward to today,” Brylawski points out. “BMW has a car made largely from carbon fiber. Toyota has a fuel cell car coming out. VW’s XL1 gets hundreds of miles per gallon. We’re seeing a whole host of interesting solutions that read pretty closely out of Amory and RMI’s playbook from the early 1990s.”

Moreover, from VW’s Jetta to Toyota’s Prius, automakers are offering multiple efficient and electrified powertrain options: TDI clean diesel, hybrid, plug-in hybrid electric, all-electric, and extended-range electrics like the Chevy Volt. “It comes back to platform physics. That makes sense to do first,” continues Brylawski. “The combination of platform fitness and electrification is like peanut butter and chocolate creating a Reese’s cup. It’s Amory’s holistic view, and that’s where VW and BMW are ahead of the curve.”

“I think XL1 will stimulate both VW and its competitors — as will BMW’s i3 and i8 — to develop families of diverse vehicles that increasingly converge with our original Hypercar goals,” says Lovins, reflecting on the Hypercar’s influence. “Our early-1990s expectations are now matched by reality in such key areas as mass, drag, tire rolling resistance, braking energy regeneration, and — even exceeding my early hopes — the weight, cost, and performance of electric powertrains. Such advanced vehicles are not only for the select, higher-price markets in which they’re initially being introduced in Germany, but also ultimately for mass markets.”

“It takes a long time, but once you get these things into the market, things start to accrete,” concludes Brylawski. “The Prius outsells every SUV in America. Back in 2000 that was unimaginable.” We’re already, in fact, seeing signs of further traction. Earlier this year BMW increased production on its i3 by 43 percent to meet higher-than-expected consumer demand, and is on track for total annual sales, at U.S. prices starting around $40,000, to be nearly double initial forecasts.

From VW’s pioneering XL1 to BMW’s i3 to even the aluminum-infused, lighter-weight-but-still-built-Ford-tough F-150, Hypercar’s innovative concepts live on.

Written by Peter Bronski, editorial director of RMI. Follow Peter on Twitter.

This article is from the Summer 2014 issue of Rocky Mountain Institute’s Solution Journal. To read more from back issues of Solutions Journal, please visit the RMI website.

Neptune

Neptune

From Wikipedia, the free encyclopedia

Neptune Astronomical symbol for Neptune.
Neptune from Voyager 2.
Neptune from Voyager 2 with Great Dark Spot at left and Small Dark Spot at lower right. White clouds are composed of methane ice; overall blue coloration is due at least in part to methane absorption of red light.
Discovery
Discovered by
Discovery date 23 September 1846[1]
Designations
Pronunciation Listeni/ˈnɛptjn/[2]
Adjectives Neptunian
Orbital characteristics[7][a]
Epoch J2000
Aphelion 4537580900 km
30.331855 AU
Perihelion 4459504400 km
29.809946 AU
4498542600 km
30.070900 AU
Eccentricity 0.00867797
60190.03 d[3]
164.8 years
89666 Neptune solar days[4]
367.49 days[5]
Average orbital speed
5.43 km/s[5]
259.885588°
Inclination 1.767975° to Ecliptic
6.43° to Sun’s equator
0.72° to Invariable plane[6]
131.782974°
273.219414°
Known satellites 14
Physical characteristics
Mean radius
24622±19 km[8][b]
Equatorial radius
24764±15 km[8][b]
3.883 Earths
Polar radius
24341±30 km[8][b]
3.829 Earths
Flattening 0.0171±0.0013
7.6183×10⁹ km2[3][b]
14.98 Earths
Volume 6.254×10¹³ km3[5][b]
57.74 Earths
Mass 1.0243×1026 kg[5]
17.147 Earths
5.15×10⁻⁵ Suns
Mean density
1.638 g/cm3[5][b]
11.15 m/s2[5][b]
1.14 g
23.5 km/s[5][b]
Sidereal rotation period
0.6713 day[5]
16 h 6 min 36 s
Equatorial rotation velocity
2.68 km/s
9660 km/h
28.32°[5]
North pole right ascension
19h 57m 20s[8]
299.3°
North pole declination
42.950°[8]
Albedo 0.290 (bond)
0.41 (geom.)[5]
Surface temp. min mean max
1 bar level
72 K (−201 °C)[5]
0.1 bar (10 kPa)
55 K[5]
8.02 to 7.78[5][9]
2.2–2.4″[5][9]
Atmosphere[5]
19.7 ± 0.6 km
Composition 80 ± 3.2% hydrogen (H2)
19 ± 3.2% helium (He)
1.5 ± 0.5% methane (CH4)
~0.019% hydrogen deuteride (HD)
~0.00015% ethane (C2H6)
Ices:
ammonia (NH3)
water (H2O)
ammonium hydrosulfide (NH4SH)
methane ice (?) (CH4•5.75H2O)
Neptune is the eighth and farthest planet from the Sun in the Solar System. It is the fourth-largest planet by diameter and the third-largest by mass. Among the gaseous planets in the Solar System, Neptune is the most dense. Neptune is 17 times the mass of Earth and is slightly more massive than its near-twin Uranus, which is 15 times the mass of Earth but not as dense.[c] Neptune orbits the Sun at an average distance of 30.1 astronomical units. Named after the Roman god of the sea, its astronomical symbol is ♆, a stylised version of the god Neptune's trident.

Neptune was the first planet found by mathematical prediction rather than by empirical observation. Unexpected changes in the orbit of Uranus led Alexis Bouvard to deduce that its orbit was subject to gravitational perturbation by an unknown planet. Neptune was subsequently observed on 23 September 1846[1] by Johann Galle within a degree of the position predicted by Urbain Le Verrier, and its largest moon, Triton, was discovered shortly thereafter, though none of the planet's remaining 13 moons were located telescopically until the 20th century. Neptune has been visited by one spacecraft, Voyager 2, which flew by the planet on 25 August 1989.

Neptune is similar in composition to Uranus, and both have compositions which differ from those of the larger gas giants, Jupiter, and Saturn. Neptune's atmosphere, while similar to Jupiter's and Saturn's in that it is composed primarily of hydrogen and helium, along with traces of hydrocarbons and possibly nitrogen, contains a higher proportion of "ices" such as water, ammonia, and methane. Astronomers sometimes categorise Uranus and Neptune as "ice giants" in order to emphasise these distinctions.[10] The interior of Neptune, like that of Uranus, is primarily composed of ices and rock.[11] It is possible that the core has a solid surface, but the temperature would be thousands of degrees and the atmospheric pressure crushing.[12] Traces of methane in the outermost regions in part account for the planet's blue appearance.[13]

In contrast to the hazy, relatively featureless atmosphere of Uranus, Neptune's atmosphere is notable for its active and visible weather patterns. For example, at the time of the 1989 Voyager 2 flyby, the planet's southern hemisphere possessed a Great Dark Spot comparable to the Great Red Spot on Jupiter. These weather patterns are driven by the strongest sustained winds of any planet in the Solar System, with recorded wind speeds as high as 2,100 kilometres per hour (1,300 mph).[14] Because of its great distance from the Sun, Neptune's outer atmosphere is one of the coldest places in the Solar System, with temperatures at its cloud tops approaching 55 K (−218 °C). Temperatures at the planet's centre are approximately 5,400 K (5,000 °C).[15][16] Neptune has a faint and fragmented ring system (labeled 'arcs'), which may have been detected during the 1960s but was only indisputably confirmed in 1989 by Voyager 2.[17]

History

Discovery

Galileo's drawings show that he first observed Neptune on 28 December 1612, and again on 27 January 1613. On both occasions, Galileo mistook Neptune for a fixed star when it appeared very close—in conjunction—to Jupiter in the night sky;[18] hence, he is not credited with Neptune's discovery. During the period of his first observation in December 1612, Neptune was stationary in the sky because it had just turned retrograde that very day. This apparent backward motion is created when the orbit of the Earth takes it past an outer planet. Since Neptune was only beginning its yearly retrograde cycle, the motion of the planet was far too slight to be detected with Galileo's small telescope.[19] In July 2009, University of Melbourne physicist David Jamieson announced new evidence suggesting that Galileo was at least aware that the star he had observed had moved relative to the fixed stars.[20]
In 1821, Alexis Bouvard published astronomical tables of the orbit of Neptune's neighbour Uranus.[21] Subsequent observations revealed substantial deviations from the tables, leading Bouvard to hypothesize that an unknown body was perturbing the orbit through gravitational interaction.[22] In 1843, John Couch Adams began work on the orbit of Uranus using the data he had. Via Cambridge Observatory director James Challis, he requested extra data from Sir George Airy, the Astronomer Royal, who supplied it in February 1844. Adams continued to work in 1845–46 and produced several different estimates of a new planet.[23][24]

In 1845–46, Urbain Le Verrier, independently of Adams, developed his own calculations but also experienced difficulties in stimulating any enthusiasm in his compatriots. In June 1846, upon seeing Le Verrier's first published estimate of the planet's longitude and its similarity to Adams's estimate, Airy persuaded Challis to search for the planet. Challis vainly scoured the sky throughout August and September.[22][25]

Meantime, Le Verrier by letter urged Berlin Observatory astronomer Johann Gottfried Galle to search with the observatory's refractor. Heinrich d'Arrest, a student at the observatory, suggested to Galle that they could compare a recently drawn chart of the sky in the region of Le Verrier's predicted location with the current sky to seek the displacement characteristic of a planet, as opposed to a fixed star. The very evening of the day of receipt of Le Verrier's letter on 23 September 1846, Neptune was discovered within 1° of where Le Verrier had predicted it to be, and about 12° from Adams' prediction. Challis later realised that he had observed the planet twice in August (Neptune had been observed on 8 and 12 August, but because Challis lacked an up-to-date star-map it was not recognised as a planet), failing to identify it owing to his casual approach to the work.[22][26]

In the wake of the discovery, there was much nationalistic rivalry between the French and the British over who had priority and deserved credit for the discovery. Eventually an international consensus emerged that both Le Verrier and Adams jointly deserved credit. Since 1966 Dennis Rawlins has questioned the credibility of Adams's claim to co-discovery and the issue was re-evaluated by historians with the return in 1998 of the "Neptune papers" (historical documents) to the Royal Observatory, Greenwich.[27] After reviewing the documents, they suggest that "Adams does not deserve equal credit with Le Verrier for the discovery of Neptune. That credit belongs only to the person who succeeded both in predicting the planet's place and in convincing astronomers to search for it."[28]

Naming

Shortly after its discovery, Neptune was referred to simply as "the planet exterior to Uranus" or as "Le Verrier's planet". The first suggestion for a name came from Galle, who proposed the name Janus. In England, Challis put forward the name Oceanus.[29]

Claiming the right to name his discovery, Le Verrier quickly proposed the name Neptune for this new planet, while falsely stating that this had been officially approved by the French Bureau des Longitudes.[30] In October, he sought to name the planet Le Verrier, after himself, and he had loyal support in this from the observatory director, François Arago. This suggestion met with stiff resistance outside France.[31] French almanacs quickly reintroduced the name Herschel for Uranus, after that planet's discoverer Sir William Herschel, and Leverrier for the new planet.[32]

Struve came out in favour of the name Neptune on 29 December 1846, to the Saint Petersburg Academy of Sciences.[33] Soon Neptune became the internationally accepted name. In Roman mythology, Neptune was the god of the sea, identified with the Greek Poseidon. The demand for a mythological name seemed to be in keeping with the nomenclature of the other planets, all of which, except for Earth, were named for deities in Greek and Roman mythology.[34]

Most languages today, even in countries that have no direct link to Greco-Roman culture, use some variant of the name "Neptune" for the planet; in Chinese, Japanese and Korean, the planet's name was literally translated as "sea king star" (海王星), since Neptune was the god of the sea.[35] In modern Greek, though, the planet is called Poseidon (Ποσειδώνας: Poseidonas), the Greek counterpart to Neptune.[36]

Status

From its discovery in 1846 until the subsequent discovery of Pluto in 1930, Neptune was the farthest known planet. Upon Pluto's discovery Neptune became the penultimate planet, save for a 20-year period between 1979 and 1999 when Pluto's elliptical orbit brought it closer to the Sun than Neptune.[37] The discovery of the Kuiper belt in 1992 led many astronomers to debate whether Pluto should be considered a planet in its own right or part of the belt's larger structure.[38][39] In 2006, the International Astronomical Union defined the word "planet" for the first time, reclassifying Pluto as a "dwarf planet" and making Neptune once again the last planet in the Solar System.[40]

Composition and structure

A size comparison of Neptune and Earth

With a mass of 1.0243×1026 kg,[5] Neptune is an intermediate body between Earth and the larger gas giants: its mass is 17 times that of Earth but just 1/19th that of Jupiter.[c] Its surface gravity is surpassed only by Jupiter.[41] Neptune's equatorial radius of 24,764 km[8] is nearly four times that of Earth. Neptune and Uranus are often considered a subclass of gas giant termed "ice giants", due to their smaller size and higher concentrations of volatiles relative to Jupiter and Saturn.[42] In the search for extrasolar planets Neptune has been used as a metonym: discovered bodies of similar mass are often referred to as "Neptunes",[43] just as astronomers refer to various extra-solar bodies as "Jupiters".

Internal structure

Neptune's internal structure resembles that of Uranus. Its atmosphere forms about 5% to 10% of its mass and extends perhaps 10% to 20% of the way towards the core, where it reaches pressures of about 10 GPa, or about 100,000 times that of Earth's atmosphere. Increasing concentrations of methane, ammonia and water are found in the lower regions of the atmosphere.[15]
The internal structure of Neptune:
1. Upper atmosphere, top clouds
2. Atmosphere consisting of hydrogen, helium and methane gas
3. Mantle consisting of water, ammonia and methane ices
4. Core consisting of rock (silicates and nickel–iron)

The mantle is equivalent to 10 to 15 Earth masses and is rich in water, ammonia and methane.[1] As is customary in planetary science, this mixture is referred to as icy even though it is a hot, highly dense fluid. This fluid, which has a high electrical conductivity, is sometimes called a water–ammonia ocean.[44] The mantle may consist of a layer of ionic water where the water molecules break down into a soup of hydrogen and oxygen ions, and deeper down superionic water in which the oxygen crystallises but the hydrogen ions float around freely within the oxygen lattice.[45] At a depth of 7000 km, the conditions may be such that methane decomposes into diamond crystals that rain downwards like hailstones.[46] Very-high-pressure experiments at the Lawrence Livermore National Laboratory suggest that the base of the mantle may comprise an ocean of liquid diamond, with floating solid 'diamond-bergs'.[47][48]

The core of Neptune is composed of iron, nickel and silicates, with an interior model giving a mass about 1.2 times that of Earth.[49] The pressure at the centre is 7 Mbar (700 GPa), about twice as high as that at the centre of Earth, and the temperature may be 5,400 K.[15][16]

Atmosphere

Combined colour and near-infrared image of Neptune, showing bands of methane in its atmosphere, and four of its moons, Proteus, Larissa, Galatea, and Despina.

At high altitudes, Neptune's atmosphere is 80% hydrogen and 19% helium.[15] A trace amount of methane is also present. Prominent absorption bands of methane occur at wavelengths above 600 nm, in the red and infrared portion of the spectrum. As with Uranus, this absorption of red light by the atmospheric methane is part of what gives Neptune its blue hue,[50] although Neptune's vivid azure differs from Uranus's milder cyan. Since Neptune's atmospheric methane content is similar to that of Uranus, some unknown atmospheric constituent is thought to contribute to Neptune's colour.[13]

Neptune's atmosphere is subdivided into two main regions; the lower troposphere, where temperature decreases with altitude, and the stratosphere, where temperature increases with altitude. The boundary between the two, the tropopause, occurs at a pressure of 0.1 bars (10 kPa).[10] The stratosphere then gives way to the thermosphere at a pressure lower than 10−5 to 10−4 microbars (1 to 10 Pa).[10] The thermosphere gradually transitions to the exosphere.
Bands of high-altitude clouds cast shadows on Neptune's lower cloud deck

Models suggest that Neptune's troposphere is banded by clouds of varying compositions depending on altitude. The upper-level clouds occur at pressures below one bar, where the temperature is suitable for methane to condense. For pressures between one and five bars (100 and 500 kPa), clouds of ammonia and hydrogen sulfide are believed to form. Above a pressure of five bars, the clouds may consist of ammonia, ammonium sulfide, hydrogen sulfide and water. Deeper clouds of water ice should be found at pressures of about 50 bars (5.0 MPa), where the temperature reaches 273 K (0 °C). Underneath, clouds of ammonia and hydrogen sulfide may be found.[51]

High-altitude clouds on Neptune have been observed casting shadows on the opaque cloud deck below. There are also high-altitude cloud bands that wrap around the planet at constant latitude. These circumferential bands have widths of 50–150 km and lie about 50–110 km above the cloud deck.[52] These altitudes are in the layer where weather occurs, the troposphere. Weather does not occur in the higher stratosphere or thermosphere. Unlike Uranus, Neptune's composition has a higher volume of ocean, whereas Uranus has a smaller mantle.[53]

Neptune's spectra suggest that its lower stratosphere is hazy due to condensation of products of ultraviolet photolysis of methane, such as ethane and acetylene.[10][15] The stratosphere is also home to trace amounts of carbon monoxide and hydrogen cyanide.[10][54] The stratosphere of Neptune is warmer than that of Uranus due to the elevated concentration of hydrocarbons.[10]

For reasons that remain obscure, the planet's thermosphere is at an anomalously high temperature of about 750 K.[55][56] The planet is too far from the Sun for this heat to be generated by ultraviolet radiation. One candidate for a heating mechanism is atmospheric interaction with ions in the planet's magnetic field. Other candidates are gravity waves from the interior that dissipate in the atmosphere. The thermosphere contains traces of carbon dioxide and water, which may have been deposited from external sources such as meteorites and dust.[51][54]

Magnetosphere

Neptune also resembles Uranus in its magnetosphere, with a magnetic field strongly tilted relative to its rotational axis at 47° and offset at least 0.55 radii, or about 13500 km from the planet's physical centre. Before Voyager 2's arrival at Neptune, it was hypothesised that Uranus's tilted magnetosphere was the result of its sideways rotation. In comparing the magnetic fields of the two planets, scientists now think the extreme orientation may be characteristic of flows in the planets' interiors. This field may be generated by convective fluid motions in a thin spherical shell of electrically conducting liquids (probably a combination of ammonia, methane and water)[51] resulting in a dynamo action.[57]

The dipole component of the magnetic field at the magnetic equator of Neptune is about 14 microteslas (0.14 G).[58] The dipole magnetic moment of Neptune is about 2.2 × 1017 T·m3 (14 μT·RN3, where RN is the radius of Neptune). Neptune's magnetic field has a complex geometry that includes relatively large contributions from non-dipolar components, including a strong quadrupole moment that may exceed the dipole moment in strength. By contrast, Earth, Jupiter and Saturn have only relatively small quadrupole moments, and their fields are less tilted from the polar axis. The large quadrupole moment of Neptune may be the result of offset from the planet's centre and geometrical constraints of the field's dynamo generator.[59][60]

Neptune's bow shock, where the magnetosphere begins to slow the solar wind, occurs at a distance of 34.9 times the radius of the planet. The magnetopause, where the pressure of the magnetosphere counterbalances the solar wind, lies at a distance of 23–26.5 times the radius of Neptune. The tail of the magnetosphere extends out to at least 72 times the radius of Neptune, and very likely much farther.[59]

Planetary rings

Neptune's rings, taken by Voyager 2

Neptune has a planetary ring system, though one much less substantial than that of Saturn. The rings may consist of ice particles coated with silicates or carbon-based material, which most likely gives them a reddish hue.[61] The three main rings are the narrow Adams Ring, 63,000 km from the centre of Neptune, the Le Verrier Ring, at 53,000 km, and the broader, fainter Galle Ring, at 42,000 km. A faint outward extension to the Le Verrier Ring has been named Lassell; it is bounded at its outer edge by the Arago Ring at 57,000 km.[62]

The first of these planetary rings was discovered in 1968 by a team led by Edward Guinan,[17][63] but it was later thought that this ring might be incomplete.[64] Evidence that the rings might have gaps first arose during a stellar occultation in 1984 when the rings obscured a star on immersion but not on emersion.[65] Images by Voyager 2 in 1989 settled the issue by showing several faint rings. These rings have a clumpy structure,[66] the cause of which is not currently understood but which may be due to the gravitational interaction with small moons in orbit near them.[67]

The outermost ring, Adams, contains five prominent arcs now named Courage, Liberté, Egalité 1, Egalité 2 and Fraternité (Courage, Liberty, Equality and Fraternity).[68] The existence of arcs was difficult to explain because the laws of motion would predict that arcs would spread out into a uniform ring over very short timescales. Astronomers now believe that the arcs are corralled into their current form by the gravitational effects of Galatea, a moon just inward from the ring.[69][70]

Earth-based observations announced in 2005 appeared to show that Neptune's rings are much more unstable than previously thought. Images taken from the W. M. Keck Observatory in 2002 and 2003 show considerable decay in the rings when compared to images by Voyager 2. In particular, it seems that the Liberté arc might disappear in as little as one century.[71]

Climate

One difference between Neptune and Uranus is the typical level of meteorological activity. When the Voyager 2 spacecraft flew by Uranus in 1986, that planet was visually quite bland. In contrast Neptune exhibited notable weather phenomena during the 1989 Voyager 2 fly-by.[72]
The Great Dark Spot (top), Scooter (middle white cloud),[73] and the Small Dark Spot (bottom), with contrast exaggerated.

Neptune's weather is characterised by extremely dynamic storm systems, with winds reaching speeds of almost 600 m/s (1340 mph)—nearly attaining supersonic flow.[14] More typically, by tracking the motion of persistent clouds, wind speeds have been shown to vary from 20 m/s in the easterly direction to 325 m/s westward.[74] At the cloud tops, the prevailing winds range in speed from 400 m/s along the equator to 250 m/s at the poles.[51] Most of the winds on Neptune move in a direction opposite the planet's rotation.[75] The general pattern of winds showed prograde rotation at high latitudes vs. retrograde rotation at lower latitudes. The difference in flow direction is believed to be a "skin effect" and not due to any deeper atmospheric processes.[10] At 70° S latitude, a high-speed jet travels at a speed of 300 m/s.[10]

The abundance of methane, ethane and ethyne at Neptune's equator is 10–100 times greater than at the poles. This is interpreted as evidence for upwelling at the equator and subsidence near the poles.[10][clarification needed]

In 2007, it was discovered that the upper troposphere of Neptune's south pole was about 10 K warmer than the rest of Neptune, which averages approximately 73 K (−200 °C).[76] The warmth differential is enough to let methane, which elsewhere lies frozen in Neptune's upper atmosphere, leak out as gas through the south pole and into space. The relative "hot spot" is due to Neptune's axial tilt, which has exposed the south pole to the Sun for the last quarter of Neptune's year, or roughly 40 Earth years. As Neptune slowly moves towards the opposite side of the Sun, the south pole will be darkened and the north pole illuminated, causing the methane release to shift to the north pole.[77]

Because of seasonal changes, the cloud bands in the southern hemisphere of Neptune have been observed to increase in size and albedo. This trend was first seen in 1980 and is expected to last until about 2020. The long orbital period of Neptune results in seasons lasting forty years.[78]

Storms

The Great Dark Spot, as imaged by Voyager 2

In 1989, the Great Dark Spot, an anti-cyclonic storm system spanning 13000×6600 km,[72] was discovered by NASA's Voyager 2 spacecraft. The storm resembled the Great Red Spot of Jupiter. Some five years later, on 2 November 1994, the Hubble Space Telescope did not see the Great Dark Spot on the planet. Instead, a new storm similar to the Great Dark Spot was found in the planet's northern hemisphere.[79]

The Scooter is another storm, a white cloud group farther south than the Great Dark Spot. Its nickname is due to the fact that when first detected in the months before the 1989 Voyager 2 encounter it moved faster than the Great Dark Spot.[75] Subsequent images revealed even faster clouds. The Small Dark Spot is a southern cyclonic storm, the second-most-intense storm observed during the 1989 encounter. It initially was completely dark, but as Voyager 2 approached the planet, a bright core developed and can be seen in most of the highest-resolution images.[80]

Neptune's dark spots are thought to occur in the troposphere at lower altitudes than the brighter cloud features,[81] so they appear as holes in the upper cloud decks. As they are stable features that can persist for several months, they are thought to be vortex structures.[52] Often associated with dark spots are brighter, persistent methane clouds that form around the tropopause layer.[82] The persistence of companion clouds shows that some former dark spots may continue to exist as cyclones even though they are no longer visible as a dark feature. Dark spots may dissipate when they migrate too close to the equator or possibly through some other unknown mechanism.[83]

Internal heating

Four images taken a few hours apart with the NASA/ESA Hubble Space Telescope's Wide Field Camera 3[84]

Neptune's more varied weather when compared to Uranus is believed to be due in part to its higher internal heating. Although Neptune lies half again as far from the Sun as Uranus, and receives only 40% its amount of sunlight,[10] the two planets' surface temperatures are roughly equal.[85] The upper regions of Neptune's troposphere reach a low temperature of 51.8 K (−221.3 °C). At a depth where the atmospheric pressure equals 1 bar (100 kPa), the temperature is 72.00 K (−201.15 °C).[86] Deeper inside the layers of gas, the temperature rises steadily. As with Uranus, the source of this heating is unknown, but the discrepancy is larger: Uranus only radiates 1.1 times as much energy as it receives from the Sun;[87] while Neptune radiates about 2.61 times as much energy as it receives from the Sun.[88] Neptune is the farthest planet from the Sun, yet its internal energy is sufficient to drive the fastest planetary winds seen in the Solar System. Depending on the thermal properties of its interior, the heat left over from Neptune's formation may be sufficient to explain its current heat flow, though it is more difficult to simultaneously explain Uranus's lack of internal heat while preserving the apparent similarity between the two planets.[89]

Orbit and rotation

Neptune (red arc) completes one revolution around the Sun (center) for every 164.79 orbits of the Earth. The light blue object represents Uranus.

The average distance between Neptune and the Sun is 4.50 billion km (about 30.1 AU), and it completes an orbit on average every 164.79 years, subject to a variability of around ±0.1 years. The perihelion distance is 29.81 au;the aphelion distance is 30.33 au. [90]

On 11 July 2011, Neptune completed its first full barycentric orbit since its discovery in 1846,[91][92] although it did not appear at its exact discovery position in our sky, because the Earth was in a different location in its 365.26-day orbit. Because of the motion of the Sun in relation to the barycentre of the Solar System, on 11 July Neptune was also not at its exact discovery position in relation to the Sun; if the more common heliocentric coordinate system is used, the discovery longitude was reached on 12 July 2011.[3][93][94]

The elliptical orbit of Neptune is inclined 1.77° compared to the Earth.

The axial tilt of Neptune is 28.32°,[95] which is similar to the tilts of Earth (23°) and Mars (25°). As a result, this planet experiences similar seasonal changes. The long orbital period of Neptune means that the seasons last for forty Earth years.[78] Its sidereal rotation period (day) is roughly 16.11 hours.[3] Since its axial tilt is comparable to the Earth's, the variation in the length of its day over the course of its long year is not any more extreme.

Because Neptune is not a solid body, its atmosphere undergoes differential rotation. The wide equatorial zone rotates with a period of about 18 hours, which is slower than the 16.1-hour rotation of the planet's magnetic field. By contrast, the reverse is true for the polar regions where the rotation period is 12 hours. This differential rotation is the most pronounced of any planet in the Solar System,[96] and it results in strong latitudinal wind shear.[52]

Orbital resonances

A diagram showing the major orbital resonances in the Kuiper belt caused by Neptune: the highlighted regions are the 2:3 resonance (plutinos), the nonresonant "classical belt" (cubewanos), and the 1:2 resonance (twotinos).

Neptune's orbit has a profound impact on the region directly beyond it, known as the Kuiper belt. The Kuiper belt is a ring of small icy worlds, similar to the asteroid belt but far larger, extending from Neptune's orbit at 30 AU out to about 55 AU from the Sun.[97] Much in the same way that Jupiter's gravity dominates the asteroid belt, shaping its structure, so Neptune's gravity dominates the Kuiper belt. Over the age of the Solar System, certain regions of the Kuiper belt became destabilised by Neptune's gravity, creating gaps in the Kuiper belt's structure. The region between 40 and 42 AU is an example.[98]

There do exist orbits within these empty regions where objects can survive for the age of the Solar System. These resonances occur when Neptune's orbital period is a precise fraction of that of the object, such as 1:2, or 3:4. If, say, an object orbits the Sun once for every two Neptune orbits, it will only complete half an orbit by the time Neptune returns to its original position. The most heavily populated resonance in the Kuiper belt, with over 200 known objects,[99] is the 2:3 resonance. Objects in this resonance complete 2 orbits for every 3 of Neptune, and are known as plutinos because the largest of the known Kuiper belt objects, Pluto, is among them.[100] Although Pluto crosses Neptune's orbit regularly, the 2:3 resonance ensures they can never collide.[101] The 3:4, 3:5, 4:7 and 2:5 resonances are less populated.[102]

Neptune possesses a number of trojan objects occupying the Sun-Neptune L4 Lagrangian point—a gravitationally stable region leading it in its orbit.[103] Neptune trojans can be viewed as being in a 1:1 resonance with Neptune. Some Neptune trojans are remarkably stable in their orbits, and are likely to have formed alongside Neptune rather than being captured. The first and so far only object identified as associated with Neptune's trailing L5 Lagrangian point is 2008 LC18.[104] Neptune also has a temporary quasi-satellite, (309239) 2007 RW10.[105] The object has been a quasi-satellite of Neptune for about 12,500 years and it will remain in that dynamical state for another 12,500 years. It is likely a captured object.[105]

Formation and migration

A simulation showing the outer planets and Kuiper belt: a) before Jupiter and Saturn reached a 2:1 resonance; b) after inward scattering of Kuiper belt objects following the orbital shift of Neptune; c) after ejection of scattered Kuiper belt bodies by Jupiter

The formation of the ice giants, Neptune and Uranus, has proven difficult to model precisely. Current models suggest that the matter density in the outer regions of the Solar System was too low to account for the formation of such large bodies from the traditionally accepted method of core accretion, and various hypotheses have been advanced to explain their creation. One is that the ice giants were not created by core accretion but from instabilities within the original protoplanetary disc and later had their atmospheres blasted away by radiation from a nearby massive OB star.[42]

An alternative concept is that they formed closer to the Sun, where the matter density was higher, and then subsequently migrated to their current orbits after the removal of the gaseous protoplanetary disc.[106] This hypothesis of migration after formation is currently favoured, due to its ability to better explain the occupancy of the populations of small objects observed in the trans-Neptunian region.[107] The current most widely accepted[108][109][110] explanation of the details of this hypothesis is known as the Nice model, which explores the effect of a migrating Neptune and the other giant planets on the structure of the Kuiper belt.

Moons

Natural-colour view of Neptune with Proteus (top), Larissa (lower right) and Despina (left), from the Hubble Space Telescope

Neptune has 14 known moons.[5][111] The largest by far, comprising more than 99.5% of the mass in orbit around Neptune[d] and the only one massive enough to be spheroidal, is Triton, discovered by William Lassell just 17 days after the discovery of Neptune itself. Unlike all other large planetary moons in the Solar System, Triton has a retrograde orbit, indicating that it was captured rather than forming in place; it was probably once a dwarf planet in the Kuiper belt.[112] It is close enough to Neptune to be locked into a synchronous rotation, and it is slowly spiralling inward because of tidal acceleration. It will eventually be torn apart, in about 3.6 billion years, when it reaches the Roche limit.[113] In 1989, Triton was the coldest object that had yet been measured in the solar system,[114] with estimated temperatures of 38 K (−235 °C).[115]

Neptune's second known satellite (by order of discovery), the irregular moon Nereid, has one of the most eccentric orbits of any satellite in the solar system. The eccentricity of 0.7512 gives it an apoapsis that is seven times its periapsis distance from Neptune.[e]
Neptune's moon Proteus

From July to September 1989, Voyager 2 discovered six new Neptunian moons.[59] Of these, the irregularly shaped Proteus is notable for being as large as a body of its density can be without being pulled into a spherical shape by its own gravity.[116] Although the second-most-massive Neptunian moon, it is only 0.25% the mass of Triton. Neptune's innermost four moons—Naiad, Thalassa, Despina and Galatea—orbit close enough to be within Neptune's rings. The next-farthest out, Larissa, was originally discovered in 1981 when it had occulted a star. This occultation had been attributed to ring arcs, but when Voyager 2 observed Neptune in 1989, it was found to have been caused by the moon. Five new irregular moons discovered between 2002 and 2003 were announced in 2004.[117][118] A new moon and the smallest yet, S/2004 N 1, was found in 2013. Since Neptune was the Roman god of the sea, the planet's moons have been named after lesser sea gods.[34]

Observation

Neptune is never visible to the naked eye, having a brightness between magnitudes +7.7 and +8.0,[5][9] which can be outshone by Jupiter's Galilean moons, the dwarf planet Ceres and the asteroids 4 Vesta, 2 Pallas, 7 Iris, 3 Juno and 6 Hebe.[119] A telescope or strong binoculars will resolve Neptune as a small blue disk, similar in appearance to Uranus.[120]

Because of the distance of Neptune from the Earth, the angular diameter of the planet only ranges from 2.2 to 2.4 arcseconds,[5][9] the smallest of the Solar System planets. Its small apparent size has made it challenging to study visually. Most telescopic data was fairly limited until the advent of Hubble Space Telescope and large ground-based telescopes with adaptive optics.[121][122]

From the Earth, Neptune goes through apparent retrograde motion every 367 days, resulting in a looping motion against the background stars during each opposition. These loops carried it close to the 1846 discovery coordinates in April and July 2010 and again in October and November 2011.[94]

Observation of Neptune in the radio-frequency band shows that the planet is a source of both continuous emission and irregular bursts. Both sources are believed to originate from the planet's rotating magnetic field.[51] In the infrared part of the spectrum, Neptune's storms appear bright against the cooler background, allowing the size and shape of these features to be readily tracked.[123]

Exploration

A Voyager 2 mosaic of Triton

Voyager 2's closest approach to Neptune occurred on 25 August 1989. Because this was the last major planet the spacecraft could visit, it was decided to make a close flyby of the moon Triton, regardless of the consequences to the trajectory, similarly to what was done for Voyager 1's encounter with Saturn and its moon Titan. The images relayed back to Earth from Voyager 2 became the basis of a 1989 PBS all-night program, Neptune All Night.[124]

During the encounter, signals from the spacecraft required 246 minutes to reach Earth. Hence, for the most part, the Voyager 2 mission relied on preloaded commands for the Neptune encounter. The spacecraft performed a near-encounter with the moon Nereid before it came within 4400 km of Neptune's atmosphere on 25 August, then passed close to the planet's largest moon Triton later the same day.[125]

The spacecraft verified the existence of a magnetic field surrounding the planet and discovered that the field was offset from the centre and tilted in a manner similar to the field around Uranus. The question of the planet's rotation period was settled using measurements of radio emissions. Voyager 2 also showed that Neptune had a surprisingly active weather system. Six new moons were discovered, and the planet was shown to have more than one ring.[59][125]

In 2003, there was a proposal in NASA's "Vision Missions Studies" for a "Neptune Orbiter with Probes" mission that does Cassini-level science. The work is being done in conjunction with JPL and the California Institute of Technology.[126] Another, more recent proposal was for Argo, a flyby spacecraft that would visit Jupiter, Saturn, Neptune, and a Kuiper belt object.[127] However, the focus would be on Neptune and its largest moon Triton to help plug a predicted 50-year gap in exploration of the system.[127][127] New Horizons 2 might have also done a flyby.

A land without a people for a people without a land

From Wikipedia, the free encyclopedia https://en.wikipedia.org/wiki/A_l...