Search This Blog

Tuesday, January 19, 2016

Clausius–Clapeyron relation


From Wikipedia, the free encyclopedia

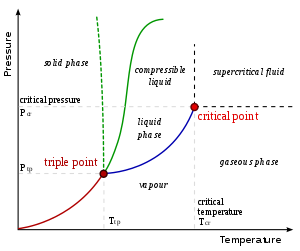
The Clausius–Clapeyron relation, named after Rudolf Clausius[1] and Benoît Paul Émile Clapeyron,[2] is a way of characterizing a discontinuous phase transition between two phases of matter of a single constituent. On a pressuretemperature (P–T) diagram, the line separating the two phases is known as the coexistence curve. The Clausius–Clapeyron relation gives the slope of the tangents to this curve. Mathematically,
\frac{\mathrm{d}P}{\mathrm{d}T} = \frac{L}{T\,\Delta v}=\frac{\Delta s}{\Delta v},
where \mathrm{d}P/\mathrm{d}T is the slope of the tangent to the coexistence curve at any point, L is the specific latent heat, T is the temperature, \Delta v is the specific volume change of the phase transition, and \Delta s is the specific entropy change of the phase transition.

Derivations


A typical phase diagram. The dotted green line gives the anomalous behavior of water. The Clausius–Clapeyron relation can be used to find the relationship between pressure and temperature along phase boundaries.

Derivation from state postulate

Using the state postulate, take the specific entropy s for a homogeneous substance to be a function of specific volume v and temperature T.[3]:508
\mathrm{d} s = \left(\frac{\partial s}{\partial v}\right)_T \mathrm{d} v + \left(\frac{\partial s}{\partial T}\right)_v \mathrm{d} T.
The Clausius–Clapeyron relation characterizes behavior of a closed system during a phase change, during which temperature and pressure are constant by definition. Therefore,[3]:508
\mathrm{d} s = \left(\frac{\partial s}{\partial v}\right)_T \mathrm{d} v.
Using the appropriate Maxwell relation gives[3]:508
\mathrm{d} s = \left(\frac{\partial P}{\partial T}\right)_v \mathrm{d} v.
where P is the pressure. Since pressure and temperature are constant, by definition the derivative of pressure with respect to temperature does not change.[4][5]:57, 62, 671 Therefore, the partial derivative of specific entropy may be changed into a total derivative
{\Delta s} = \frac{\mathrm{d} P}{\mathrm{d} T}{\Delta v}
and the total derivative of pressure with respect to temperature may be factored out when integrating from an initial phase \alpha to a final phase \beta,[3]:508 to obtain
\frac{d P}{d T} = \frac {\Delta s}{\Delta v}
where \Delta s\equiv s_{\beta}-s_{\alpha} and \Delta v\equiv v_{\beta}-v_{\alpha} are respectively the change in specific entropy and specific volume. Given that a phase change is an internally reversible process, and that our system is closed, the first law of thermodynamics holds
\mathrm{d} u = \delta q - \delta w = T\;\mathrm{d} s - P\;\mathrm{d} v
where u is the internal energy of the system. Given constant pressure and temperature (during a phase change) and the definition of specific enthalpy h, we obtain
d h = \mathrm{d} u + P \;\mathrm{d} v
d h = T\;\mathrm{d}s
\mathrm{d}s = \frac {\mathrm{d} h}{T}
Given constant pressure and temperature (during a phase change), we obtain[3]:508
\Delta s = \frac {\Delta h}{T}
Substituting the definition of specific latent heat L = \Delta h gives
\Delta s = \frac{L}{T}
Substituting this result into the pressure derivative given above (\mathrm{d}P/\mathrm{d}T = \mathrm{\Delta s}/\mathrm{\Delta v}), we obtain[3]:508[6]
\frac{\mathrm{d} P}{\mathrm{d} T} = \frac {L}{T \Delta v}.
This result (also known as the Clapeyron equation) equates the slope of the tangent to the coexistence curve \mathrm{d}P/\mathrm{d}T, at any given point on the curve, to the function {L}/{T {\Delta v}} of the specific latent heat L, the temperature T, and the change in specific volume \Delta v .

Derivation from Gibbs–Duhem relation[edit]

Suppose two phases, \alpha and \beta, are in contact and at equilibrium with each other. Their chemical potentials are related by
\mu_{\alpha} = \mu_{\beta}.
Furthermore, along the coexistence curve,
\mathrm{d}\mu_{\alpha} = \mathrm{d}\mu_{\beta}.
One may therefore use the Gibbs–Duhem relation
\mathrm{d}\mu = M(-s\mathrm{d}T + v\mathrm{d}P)
(where s is the specific entropy, v is the specific volume, and M is the molar mass) to obtain
-(s_{\beta}-s_{\alpha}) \mathrm{d}T + (v_{\beta}-v_{\alpha}) \mathrm{d}P = 0
Rearrangement gives
\frac{\mathrm{d}P}{\mathrm{d}T} = \frac{s_{\beta}-s_{\alpha}}{v_{\beta}-v_{\alpha}} = \frac{\Delta s}{\Delta v}
from which the derivation of the Clapeyron equation continues as in the previous section.

Ideal gas approximation at low temperatures

When the phase transition of a substance is between a gas phase and a condensed phase (liquid or solid), and occurs at temperatures much lower than the critical temperature of that substance, the specific volume of the gas phase v_{\mathrm{g}} greatly exceeds that of the condensed phase v_{\mathrm{c}}. Therefore, one may approximate
\Delta v =v_{\mathrm{g}}\left(1-\tfrac{v_{\mathrm{c}}}{v_{\mathrm{g}}}\right)\approx v_{\mathrm{g}}
at low temperatures. If pressure is also low, the gas may be approximated by the ideal gas law, so that
v_{\mathrm{g}} = R T / P
where P is the pressure, R is the specific gas constant, and T is the temperature. Substituting into the Clapeyron equation
\frac{\mathrm{d} P}{\mathrm{d} T} = \frac{\Delta s}{\Delta v}
we can obtain the Clausius–Clapeyron equation[3]:509
\frac{\mathrm{d} P}{\mathrm{d} T} = \frac {P L}{T^2 R}.
for low temperatures and pressures,[3]:509 where L is the specific latent heat of the substance.
Let (P_1,T_1) and (P_2,T_2) be any two points along the coexistence curve between two phases \alpha and \beta. In general, L varies between any two such points, as a function of temperature. But if L is constant,
\frac {\mathrm{d} P}{P} = \frac {L}{R} \frac {\mathrm{d}T}{T^2},
\int_{P_1}^{P_2}\frac{\mathrm{d}P}{P} = \frac {L}{R} \int \frac {\mathrm{d} T}{T^2}
\left. \ln P\right|_{P=P_1}^{P_2} = -\frac{L}{R} \cdot \left.\frac{1}{T}\right|_{T=T_1}^{T_2}
or[5]:672
\ln \frac {P_1}{P_2} = -\frac {L}{R} \left ( \frac {1}{T_1} - \frac {1}{T_2} \right )
These last equations are useful because they relate equilibrium or saturation vapor pressure and temperature to the latent heat of the phase change, without requiring specific volume data.

Applications

Chemistry and chemical engineering

For transitions between a gas and a condensed phase with the approximations described above, the expression may be rewritten as
\ln P = -\frac{L}{R}\left(\frac{1}{T}\right)+c
where c is a constant. For a liquid-gas transition, L is the specific latent heat (or specific enthalpy) of vaporization; for a solid-gas transition, L is the specific latent heat of sublimation. If the latent heat is known, then knowledge of one point on the coexistence curve determines the rest of the curve. Conversely, the relationship between \ln P and 1/T is linear, and so linear regression is used to estimate the latent heat.

Meteorology and climatology

Atmospheric water vapor drives many important meteorologic phenomena (notably precipitation), motivating interest in its dynamics. The Clausius–Clapeyron equation for water vapor under typical atmospheric conditions (near standard temperature and pressure) is
\frac{\mathrm{d}e_s}{\mathrm{d}T} = \frac{L_v(T) e_s}{R_v T^2}
where:
The temperature dependence of the latent heat L_v(T), and therefore of the saturation vapor pressure e_s(T), cannot be neglected in this application. Fortunately, the August-Roche-Magnus formula provides a very good approximation, using pressure in hPa and temperature in Celsius:
e_s(T)= 6.1094 \exp \left( \frac{17.625T}{T+243.04} \right) [7][8]
(This is also sometimes called the Magnus or Magnus-Tetens approximation, though this attribution is historically inaccurate.[9])

Under typical atmospheric conditions, the denominator of the exponent depends weakly on T (for which the unit is Celsius). Therefore, the August-Roche-Magnus equation implies that saturation water vapor pressure changes approximately exponentially with temperature under typical atmospheric conditions, and hence the water-holding capacity of the atmosphere increases by about 7% for every 1 °C rise in temperature.[10]

Example

One of the uses of this equation is to determine if a phase transition will occur in a given situation. Consider the question of how much pressure is needed to melt ice at a temperature {\Delta T} below 0 °C. Note that water is unusual in that its change in volume upon melting is negative. We can assume
 {\Delta P} = \frac{L}{T\,\Delta v} {\Delta T}
and substituting in
L = 3.34×10⁵ J/kg (latent heat of fusion for water),
T = 273 K (absolute temperature), and
\Delta v = −9.05×10⁻⁵ m³/kg (change in specific volume from solid to liquid),
we obtain
\frac{\Delta P}{\Delta T} = −13.5 MPa/K.
To provide a rough example of how much pressure this is, to melt ice at −7 °C (the temperature many ice skating rinks are set at) would require balancing a small car (mass = 1000 kg[11]) on a thimble (area = 1 cm²).

Second derivative

While the Clausius–Clapeyron relation gives the slope of the coexistence curve, it does not provide any information about its curvature or second derivative. The second derivative of the coexistence curve of phases 1 and 2 is given by [12]
\frac{\mathrm{d}^2 P}{\mathrm{d} T^2} = \frac{1}{v_2 - v_1}
\left[\frac{c_{p2} - c_{p1}}{T} - 2(v_2\alpha_2 - v_1\alpha_1) \frac{\mathrm{d}P}{\mathrm{d}T} + (v_2\kappa_{T2} - v_1\kappa_{T1})\left(\frac{\mathrm{d}P}{\mathrm{d}T}\right)^2\right],
where subscripts 1 and 2 denote the different phases, c_p is the specific heat capacity at constant pressure, \alpha = (1/v)(\mathrm{d}v/\mathrm{d}T)_P is the thermal expansion coefficient, and \kappa_T = -(1/v)(\mathrm{d}v/\mathrm{d}P)_T is the isothermal compressibility.

Saturday, January 16, 2016

Atmospheric chemistry


From Wikipedia, the free encyclopedia

Atmospheric chemistry is a branch of atmospheric science in which the chemistry of the Earth's atmosphere and that of other planets is studied. It is a multidisciplinary field of research and draws on environmental chemistry, physics, meteorology, computer modeling, oceanography, geology and volcanology and other disciplines. Research is increasingly connected with other areas of study such as climatology.

The composition and chemistry of the atmosphere is of importance for several reasons, but primarily because of the interactions between the atmosphere and living organisms. The composition of the Earth's atmosphere changes as result of natural processes such as volcano emissions, lightning and bombardment by solar particles from corona. It has also been changed by human activity and some of these changes are harmful to human health, crops and ecosystems. Examples of problems which have been addressed by atmospheric chemistry include acid rain, ozone depletion, photochemical smog, greenhouse gases and global warming. Atmospheric chemists seek to understand the causes of these problems, and by obtaining a theoretical understanding of them, allow possible solutions to be tested and the effects of changes in government policy evaluated.

Atmospheric composition


Visualisation of composition by volume of Earth's atmosphere. Water vapour is not included as it is highly variable. Each tiny cube (such as the one representing krypton) has one millionth of the volume of the entire block. Data is from NASA Langley.

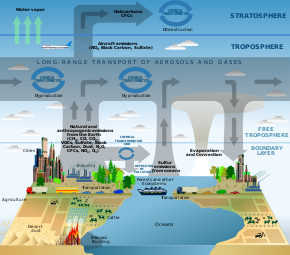
Schematic of chemical and transport processes related to atmospheric composition.
Average composition of dry atmosphere (mole fractions)
Gas per NASA
Nitrogen, N2 78.084%
Oxygen, O2[1] 20.946%
Minor constituents (mole fractions in ppm)
Argon, Ar 9340
Carbon dioxide, CO2 400
Neon, Ne 18.18
Helium, He 5.24
Methane, CH4 1.7
Krypton, Kr 1.14
Hydrogen, H2 0.55
Water
Water vapour Highly variable;
typically makes up about 1%
Notes: the concentration of CO2 and CH4 vary by season and location. The mean molecular mass of air is 28.97 g/mol.

History

The ancient Greeks regarded air as one of the four elements, but the first scientific studies of atmospheric composition began in the 18th century. Chemists such as Joseph Priestley, Antoine Lavoisier and Henry Cavendish made the first measurements of the composition of the atmosphere.
In the late 19th and early 20th centuries interest shifted towards trace constituents with very small concentrations. One particularly important discovery for atmospheric chemistry was the discovery of ozone by Christian Friedrich Schönbein in 1840.

In the 20th century atmospheric science moved on from studying the composition of air to a consideration of how the concentrations of trace gases in the atmosphere have changed over time and the chemical processes which create and destroy compounds in the air. Two particularly important examples of this were the explanation by Sydney Chapman and Gordon Dobson of how the ozone layer is created and maintained, and the explanation of photochemical smog by Arie Jan Haagen-Smit. Further studies on ozone issues led to the 1995 Nobel Prize in Chemistry award shared between Paul Crutzen, Mario Molina and Frank Sherwood Rowland.[2]

In the 21st century the focus is now shifting again. Atmospheric chemistry is increasingly studied as one part of the Earth system. Instead of concentrating on atmospheric chemistry in isolation the focus is now on seeing it as one part of a single system with the rest of the atmosphere, biosphere and geosphere. An especially important driver for this is the links between chemistry and climate such as the effects of changing climate on the recovery of the ozone hole and vice versa but also interaction of the composition of the atmosphere with the oceans and terrestrial ecosystems.

Carbon dioxide in Earth's atmosphere if half of global-warming emissions[3][4] are not absorbed.
(NASA simulation; 9 November 2015)
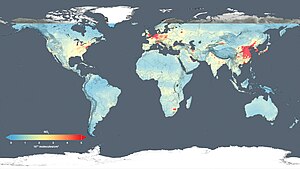
Nitrogen dioxide 2014 - global air quality levels
(released 14 December 2015).[5]

Methodology

Observations, lab measurements and modeling are the three central elements in atmospheric chemistry. Progress in atmospheric chemistry is often driven by the interactions between these components and they form an integrated whole. For example, observations may tell us that more of a chemical compound exists than previously thought possible. This will stimulate new modelling and laboratory studies which will increase our scientific understanding to a point where the observations can be explained.

Observation

Observations of atmospheric chemistry are essential to our understanding. Routine observations of chemical composition tell us about changes in atmospheric composition over time. One important example of this is the Keeling Curve - a series of measurements from 1958 to today which show a steady rise in of the concentration of carbon dioxide. Observations of atmospheric chemistry are made in observatories such as that on Mauna Loa and on mobile platforms such as aircraft (e.g. the UK's Facility for Airborne Atmospheric Measurements), ships and balloons. Observations of atmospheric composition are increasingly made by satellites with important instruments such as GOME and MOPITT giving a global picture of air pollution and chemistry. Surface observations have the advantage that they provide long term records at high time resolution but are limited in the vertical and horizontal space they provide observations from. Some surface based instruments e.g. LIDAR can provide concentration profiles of chemical compounds and aerosol but are still restricted in the horizontal region they can cover. Many observations are available on line in Atmospheric Chemistry Observational Databases.

Lab measurements

Measurements made in the laboratory are essential to our understanding of the sources and sinks of pollutants and naturally occurring compounds. Lab studies tell us which gases react with each other and how fast they react. Measurements of interest include reactions in the gas phase, on surfaces and in water. Also of high importance is photochemistry which quantifies how quickly molecules are split apart by sunlight and what the products are plus thermodynamic data such as Henry's law coefficients.

Modeling

In order to synthesise and test theoretical understanding of atmospheric chemistry, computer models (such as chemical transport models) are used. Numerical models solve the differential equations governing the concentrations of chemicals in the atmosphere. They can be very simple or very complicated. One common trade off in numerical models is between the number of chemical compounds and chemical reactions modelled versus the representation of transport and mixing in the atmosphere. For example, a box model might include hundreds or even thousands of chemical reactions but will only have a very crude representation of mixing in the atmosphere. In contrast, 3D models represent many of the physical processes of the atmosphere but due to constraints on computer resources will have far fewer chemical reactions and compounds. Models can be used to interpret observations, test understanding of chemical reactions and predict future concentrations of chemical compounds in the atmosphere. One important current trend is for atmospheric chemistry modules to become one part of earth system models in which the links between climate, atmospheric composition and the biosphere can be studied.

Some models are constructed by automatic code generators (e.g. Autochem or KPP). In this approach a set of constituents are chosen and the automatic code generator will then select the reactions involving those constituents from a set of reaction databases. Once the reactions have been chosen the ordinary differential equations (ODE) that describe their time evolution can be automatically constructed.

A land without a people for a people without a land

From Wikipedia, the free encyclopedia https://en.wikipedia.org/wiki/A_l...