From Wikipedia, the free encyclopedia
The
Sun is the
star at the center of the
Solar System. It is a nearly perfect sphere of hot
plasma, with internal
convective motion that generates a
magnetic field via a
dynamo process. It is by far the most important source of
energy for
life on
Earth. Its diameter is about 1.39 million kilometers, i.e. 109 times that of Earth, and
its mass is about 330,000 times that of Earth, accounting for about 99.86% of the total mass of the Solar System.
About three quarters of the Sun's mass consists of
hydrogen (~73%); the rest is mostly
helium (~25%), with much smaller quantities of heavier elements, including
oxygen,
carbon,
neon, and
iron.
The Sun is a
G-type main-sequence star (G2V) based on its
spectral class. As such, it is informally and not completely accurately referred to as a
yellow dwarf (its light is closer to white than yellow). It formed approximately 4.6 billion
[a][10][19] years ago from the
gravitational collapse of matter within a region of a large
molecular cloud. Most of this matter gathered in the center, whereas the rest flattened into an orbiting disk that
became the Solar System. The central mass became so hot and dense that it eventually initiated
nuclear fusion in its
core. It is thought that almost all stars
form by this process.
The Sun is roughly middle-aged; it has not changed dramatically for more than four billion
[a] years, and will remain fairly stable for more than another five billion years. It currently
fuses about 600 million tons of
hydrogen into
helium every second,
converting 4 million tons of matter into energy
every second as a result. This energy, which can take between 10,000
and 170,000 years to escape from its core, is the source of the Sun's
light and heat. In about 5 billion years, when
hydrogen fusion in its core has diminished to the point at which the Sun is no longer in
hydrostatic equilibrium,
the core of the Sun will experience a marked increase in density and
temperature while its outer layers expand to eventually become a
red giant. It is calculated that the Sun will become sufficiently large to engulf the current orbits of
Mercury and
Venus, and render
Earth uninhabitable. After this, it will shed its outer layers and become a dense type of cooling star known as a
white dwarf, which no longer produces energy by fusion, but still glows and gives off heat from its previous fusion.
The enormous effect of the Sun on Earth has been recognized since
prehistoric times, and the Sun has been
regarded by some cultures as a
deity. The
synodic rotation of Earth and its orbit around the Sun are the basis of
solar calendars, one of which is the predominant
calendar in use today.
Name and etymology
The English proper name
Sun developed from
Old English sunne and may be related to
south. Cognates to English
sun appear in other
Germanic languages, including
Old Frisian sunne,
sonne,
Old Saxon sunna,
Middle Dutch sonne, modern
Dutch zon,
Old High German sunna, modern German
Sonne,
Old Norse sunna, and
Gothic sunnō. All Germanic terms for the Sun stem from
Proto-Germanic *
sunnōn.
[20][21]
The Latin name for the Sun,
Sol, is used at times as another name for the Sun, but is not commonly used in everyday English.
Sol is also used by planetary astronomers to refer to the duration of a
solar day on another planet, such as
Mars.
[22]
The related word
solar is the usual
adjectival term used for the Sun,
[23][24] in terms such as
solar day,
solar eclipse, and
Solar System. A mean
Earth solar day is approximately 24 hours, whereas a mean Martian 'sol' is 24 hours, 39 minutes, and 35.244 seconds.
[25]
The English weekday name
Sunday stems from Old English (
Sunnandæg; "Sun's day", from before 700) and is ultimately a result of a
Germanic interpretation of Latin
dies solis, itself a translation of the Greek ἡμέρα ἡλίου (
hēméra hēlíou).
[26]
Religious aspects
Solar deities play a major role in many world religions and mythologies.
[27] The ancient
Sumerians believed that the sun was
Utu,
[28][29] the god of justice and twin brother of
Inanna, the
Queen of Heaven,
[28] who was identified as the planet
Venus.
[29] Later, Utu was identified with the
East Semitic god
Shamash.
[28][29] Utu was regarded as a helper-deity, who aided those in distress,
[28] and, in
iconography, he is usually portrayed with a long beard and clutching a
saw,
[28] which represented his role as the dispenser of justice.
[28]
From at least the
4th Dynasty of
Ancient Egypt, the Sun was worshipped as the
god Ra, portrayed as a falcon-headed divinity surmounted by the solar disk, and surrounded by a serpent. In the
New Empire period, the Sun became identified with the
dung beetle, whose spherical ball of dung was identified with the Sun. In the form of the Sun disc
Aten, the Sun had a brief resurgence during the
Amarna Period when it again became the preeminent, if not only, divinity for the
Pharaoh Akhenaton.
In
Proto-Indo-European religion, the sun was personified as the goddess
*Seh2ul.
[32][33][21] Derivatives of this goddess in
Indo-European languages include the
Old Norse Sól,
Sanskrit Surya,
Gaulish Sulis,
Lithuanian Saulė, and
Slavic Solntse.
[21] In
ancient Greek religion, the sun deity was the male god
Helios,
[32] but traces of an earlier female solar deity are preserved in
Helen of Troy.
[32] In later times, Helios was
syncretized with
Apollo.
[34]
In the
Bible,
Malachi 4:2 mentions the "Sun of Righteousness" (sometimes translated as the "Sun of Justice"),
[35] which some
Christians have interpreted as a reference to the
Messiah (
Christ).
[36] In ancient Roman culture,
Sunday was the day of the Sun god. It was adopted as the
Sabbath
day by Christians who did not have a Jewish background. The symbol of
light was a pagan device adopted by Christians, and perhaps the most
important one that did not come from Jewish traditions. In paganism, the
Sun was a source of life, giving warmth and illumination to mankind. It
was the center of a popular cult among Romans, who would stand at dawn
to catch the first rays of sunshine as they prayed. The celebration of
the
winter solstice (which influenced Christmas) was part of the Roman cult of the unconquered Sun (
Sol Invictus). Christian churches were built with an orientation so that the congregation faced toward the sunrise in the East.
[37]
Tonatiuh, the
Aztec god of the sun, was usually depicted holding arrows and a shield
[38] and was closely associated with the practice of
human sacrifice.
[38] The sun goddess
Amaterasu is the most important deity in the
Shinto religion,
[39][40] and she is believed to be the direct ancestor of all
Japanese emperors.
[39]
Characteristics
The Sun is a
G-type main-sequence star that comprises about 99.86% of the mass of the Solar System. The Sun has an
absolute magnitude of +4.83, estimated to be brighter than about 85% of the stars in the
Milky Way, most of which are
red dwarfs.
[41][42]
The Sun is a
Population I, or heavy-element-rich,
[b] star.
[43] The formation of the Sun may have been triggered by shockwaves from one or more nearby
supernovae.
[44] This is suggested by a high
abundance of heavy elements in the Solar System, such as
gold and
uranium, relative to the abundances of these elements in so-called
Population II, heavy-element-poor, stars. The heavy elements could most plausibly have been produced by
endothermic nuclear reactions during a supernova, or by
transmutation through
neutron absorption within a massive second-generation star.
[43]
The Sun is by far the brightest object in the Earth's sky, with an
apparent magnitude of −26.74.
[45][46] This is about 13 billion times brighter than the next brightest star,
Sirius, which has an apparent magnitude of −1.46. The mean distance of the Sun's center to Earth's center is approximately 1
astronomical unit (about 150,000,000 km; 93,000,000 mi), though the distance varies as Earth moves from
perihelion in January to
aphelion in July.
[47]
At this average distance, light travels from the Sun's horizon to
Earth's horizon in about 8 minutes and 19 seconds, while light from the
closest points of the Sun and Earth takes about two seconds less. The
energy of this
sunlight supports almost all life
[c] on Earth by
photosynthesis,
[48] and drives
Earth's climate and weather.
The Sun does not have a definite boundary, but its density decreases exponentially with increasing height above the
photosphere.
[49]
For the purpose of measurement, however, the Sun's radius is considered
to be the distance from its center to the edge of the photosphere, the
apparent visible surface of the Sun.
[50] By this measure, the Sun is a near-perfect sphere with an
oblateness estimated at about 9 millionths,
[51] which means that its polar diameter differs from its equatorial diameter by only 10 kilometres (6.2 mi).
[52]
The tidal effect of the planets is weak and does not significantly affect the shape of the Sun.
[53] The Sun rotates faster at its
equator than at its
poles. This
differential rotation is caused by
convective motion due to heat transport and the
Coriolis force
due to the Sun's rotation. In a frame of reference defined by the
stars, the rotational period is approximately 25.6 days at the equator
and 33.5 days at the poles. Viewed from Earth as it orbits the Sun, the
apparent rotational period of the Sun at its equator is about 28 days.
[54]
Sunlight
The
solar constant
is the amount of power that the Sun deposits per unit area that is
directly exposed to sunlight. The solar constant is equal to
approximately
1,368 W/m2 (watts per square meter) at a distance of one
astronomical unit (AU) from the Sun (that is, on or near Earth).
[55] Sunlight on the surface of Earth is
attenuated by Earth's atmosphere, so that less power arrives at the surface (closer to
1,000 W/m2) in clear conditions when the Sun is near the
zenith.
[56]
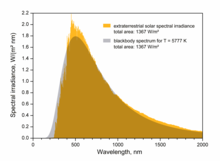
Sunlight at the top of Earth's atmosphere is composed (by total energy)
of about 50% infrared light, 40% visible light, and 10% ultraviolet
light.
[57] The atmosphere in particular filters out over 70% of solar ultraviolet, especially at the shorter wavelengths.
[58] Solar
ultraviolet radiation ionizes Earth's dayside upper atmosphere, creating the electrically conducting
ionosphere.
[59]
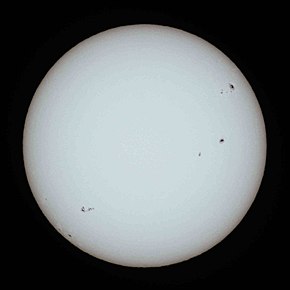
The Sun's color is white, with a
CIE
color-space index near (0.3, 0.3), when viewed from space or when the
Sun is high in the sky. When measuring all the photons emitted, the Sun
is actually emitting more photons in the green portion of the spectrum
than any other.
[60][61] When the Sun is low in the sky,
atmospheric scattering
renders the Sun yellow, red, orange, or magenta. Despite its typical
whiteness, most people mentally picture the Sun as yellow; the reasons
for this are the subject of debate.
[62]
The Sun is a
G2V star, with
G2 indicating its
surface temperature of approximately 5,778 K (5,505 °C, 9,941 °F), and
V that it, like most stars, is a
main-sequence star.
[63][64] The average
luminance of the Sun is about 1.88
giga candela per square metre, but as viewed through Earth's atmosphere, this is lowered to about 1.44 Gcd/m
2.
[d] However, the luminance is not constant across the disk of the Sun (
limb darkening).
Composition
The Sun is composed primarily of the
chemical elements hydrogen and
helium. At this time in the Sun's life, they account for 74.9% and 23.8% of the mass of the Sun in the photosphere, respectively.
[65] All heavier elements, called
metals
in astronomy, account for less than 2% of the mass, with oxygen
(roughly 1% of the Sun's mass), carbon (0.3%), neon (0.2%), and iron
(0.2%) being the most abundant.
[66]
The Sun's original chemical composition was inherited from the
interstellar medium out of which it formed. Originally it would have contained about 71.1% hydrogen, 27.4% helium, and 1.5% heavier elements.
[65] The hydrogen and most of the helium in the Sun would have been produced by
Big Bang nucleosynthesis in the first 20 minutes of the universe, and the heavier elements were
produced by previous generations of stars before the Sun was formed, and spread into the interstellar medium during the
final stages of stellar life and by events such as
supernovae.
[67]
Since the Sun formed, the main fusion process has involved fusing
hydrogen into helium. Over the past 4.6 billion years, the amount of
helium and its location within the Sun has gradually changed. Within the
core, the proportion of helium has increased from about 24% to about
60% due to fusion, and some of the helium and heavy elements have
settled from the photosphere towards the center of the Sun because of
gravity. The proportions of metals (heavier elements) is unchanged.
Heat is transferred outward from the Sun's core by radiation rather than by convection (see
Radiative zone below), so the fusion products are not lifted outward by heat; they remain in the core
[68]
and gradually an inner core of helium has begun to form that cannot be
fused because presently the Sun's core is not hot or dense enough to
fuse helium. In the current photosphere the helium fraction is reduced,
and the
metallicity is only 84% of what it was in the
protostellar
phase (before nuclear fusion in the core started). In the future,
helium will continue to accumulate in the core, and in about 5 billion
years this gradual build-up will eventually cause the Sun to exit the
main sequence and become a
red giant.
[69]
The chemical composition of the photosphere is normally
considered representative of the composition of the primordial Solar
System.
[70] The solar heavy-element abundances described above are typically measured both using
spectroscopy of the Sun's photosphere and by measuring abundances in
meteorites
that have never been heated to melting temperatures. These meteorites
are thought to retain the composition of the protostellar Sun and are
thus not affected by settling of heavy elements. The two methods
generally agree well.
[18]
Singly ionized iron-group elements
In the 1970s, much research focused on the abundances of
iron-group elements in the Sun.
[71][72] Although significant research was done, until 1978 it was difficult to
determine the abundances of some iron-group elements (e.g.
cobalt and
manganese) via
spectrography because of their
hyperfine structures.
[71]
The first largely complete set of
oscillator strengths of singly ionized iron-group elements were made available in the 1960s,
[73] and these were subsequently improved.
[74] In 1978, the abundances of singly ionized elements of the iron group were derived.
[71]
Isotopic composition
Various authors have considered the existence of a gradient in the
isotopic compositions of solar and planetary
noble gases,
[75] e.g. correlations between isotopic compositions of
neon and
xenon in the Sun and on the planets.
[76]
Prior to 1983, it was thought that the whole Sun has the same composition as the solar atmosphere.
[77] In 1983, it was claimed that it was
fractionation in the Sun itself that caused the isotopic-composition relationship between the planetary and solar-wind-implanted noble gases.
[77]
Structure and energy production
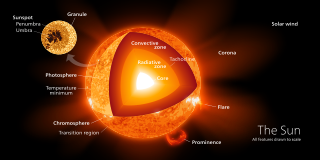
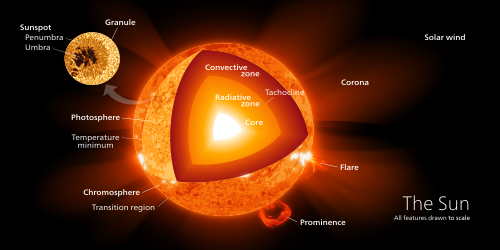
The structure of the Sun contains the following layers:
- Core - the innermost 20 - 25% of the Sun's radius, where temperature (energies) and pressure are sufficient for nuclear fusion
to occur. Hydrogen fuses into helium (which cannot currently be fused
at this point in the Sun's life). The fusion process releases energy,
and the helium gradually accumulates to form an inner core of helium
within the core itself.
- Radiative zone - Convection
cannot occur until much nearer the surface of the Sun. Therefore,
between about 20-25% of the radius, and 70% of the radius, there is a
"radiative zone" in which energy transfer occurs by means of radiation
(photons) rather than by convection.
- Tachocline - the boundary region between the radiative and convective zones.
- Convective zone - Between about 70% of the Sun's radius and a
point close to the visible surface, the Sun is cool and diffuse enough
for convection to occur, and this becomes the primary means of outward
heat transfer, similar to weather cells which form in the earth's
atmosphere.
- Photosphere - the deepest part of the Sun which we can
directly observe with visible light. Because the Sun is a gaseous
object, it does not have a clearly-defined surface; its visible parts
are usually divided into a 'photosphere' and 'atmosphere'.
- Atmosphere - a gaseous 'halo' surrounding the Sun, comprising the chromosphere, solar transition region, corona and heliosphere. These can be seen when the main part of the Sun is hidden, for example, during a solar eclipse.
Core
The
core of the Sun extends from the center to about 20–25% of the solar radius.
[78] It has a density of up to
150 g/cm3[79][80] (about 150 times the density of water) and a temperature of close to 15.7 million
kelvins (K).
[80] By contrast, the Sun's surface temperature is approximately 5,800 K. Recent analysis of
SOHO mission data favors a faster rotation rate in the core than in the radiative zone above.
[78] Through most of the Sun's life, energy has been produced by
nuclear fusion in the core region through a series of steps called the
p–p (proton–proton) chain; this process converts
hydrogen into
helium.
[81] Only 0.8% of the energy generated in the Sun comes from the
CNO cycle, though this proportion is expected to increase as the Sun becomes older.
[82]
The core is the only region in the Sun that produces an appreciable amount of
thermal energy
through fusion; 99% of the power is generated within 24% of the Sun's
radius, and by 30% of the radius, fusion has stopped nearly entirely.
The remainder of the Sun is heated by this energy as it is transferred
outwards through many successive layers, finally to the solar
photosphere where it escapes into space as sunlight or the
kinetic energy of particles.
[63][83]
The
proton–proton chain occurs around
9.2×1037 times each second in the core, converting about 3.7
×10
38 protons into
alpha particles (helium nuclei) every second (out of a total of ~8.9
×10
56 free protons in the Sun), or about 6.2
×10
11 kg/s.
[63] Fusing four free
protons (hydrogen nuclei) into a single
alpha particle (helium nucleus) releases around 0.7% of the fused mass as energy,
[84]
so the Sun releases energy at the mass–energy conversion rate of 4.26
million metric tons per second (which requires 600 metric megatons of
hydrogen
[85]), for 384.6
yottawatts (
3.846×1026 W),
[1] or 9.192
×10
10 megatons of
TNT
per second. However, the large power output of the Sun is mainly due to
the huge size and density of its core (compared to earth and objects on
earth), with only a fairly small amount of power being generated per
cubic metre. Theoretical models of the Sun's interior indicate a power density, or energy production, of approximately 276.5
watts per cubic metre,
[86] which is about the same rate of power production as takes place in
reptile metabolism or a
compost pile.
[87][e]
The fusion rate in the core is in a self-correcting equilibrium: a
slightly higher rate of fusion would cause the core to heat up more and
expand slightly against the weight of the outer layers, reducing the density and hence the fusion rate and correcting the
perturbation;
and a slightly lower rate would cause the core to cool and shrink
slightly, increasing the density and increasing the fusion rate and
again reverting it to its present rate.
[88][89]
Radiative zone
From the core out to about 0.7 solar radii,
thermal radiation is the primary means of energy transfer.
[90] The temperature drops from approximately 7 million to 2 million kelvins with increasing distance from the core.
[80] This
temperature gradient is less than the value of the
adiabatic lapse rate and hence cannot drive convection, which explains why the transfer of energy through this zone is by
radiation instead of thermal
convection.
[80] Ions of
hydrogen and
helium emit
photons, which travel only a brief distance before being reabsorbed by other ions.
[90] The density drops a hundredfold (from 20 g/cm
3 to 0.2 g/cm
3) from 0.25 solar radii to the 0.7 radii, the top of the radiative zone.
[90]
Tachocline
The radiative zone and the convective zone are separated by a transition layer, the
tachocline.
This is a region where the sharp regime change between the uniform
rotation of the radiative zone and the differential rotation of the
convection zone results in a large
shear between the two—a condition where successive horizontal layers slide past one another.
[91] Presently, it is hypothesized that a magnetic dynamo within this layer generates the Sun's
magnetic field.
[80]
Convective zone
The Sun's convection zone extends from 0.7 solar radii (500,000 km)
to near the surface. In this layer, the solar plasma is not dense enough
or hot enough to transfer the heat energy of the interior outward via
radiation. Instead, the density of the plasma is low enough to allow
convective currents to develop and move the Sun's energy outward towards
its surface. Material heated at the tachocline picks up heat and
expands, thereby reducing its density and allowing it to rise. As a
result, an orderly motion of the mass develops into
thermal cells
that carry the majority of the heat outward to the Sun's photosphere
above. Once the material diffusively and radiatively cools just beneath
the photospheric surface, its density increases, and it sinks to the
base of the convection zone, where it again picks up heat from the top
of the radiative zone and the convective cycle continues. At the
photosphere, the temperature has dropped to 5,700 K and the density to
only 0.2 g/m
3 (about 1/6,000 the density of air at sea level).
[80]
The thermal columns of the convection zone form an imprint on the
surface of the Sun giving it a granular appearance called the
solar granulation at the smallest scale and
supergranulation
at larger scales. Turbulent convection in this outer part of the solar
interior sustains "small-scale" dynamo action over the near-surface
volume of the Sun.
[80] The Sun's thermal columns are
Bénard cells and take the shape of hexagonal prisms.
[92]
Photosphere
The
effective temperature, or
black body
temperature, of the Sun (5,777 K) is the temperature a black body of
the same size must have to yield the same total emissive power.
The visible surface of the Sun, the photosphere, is the layer below which the Sun becomes
opaque to visible light.
[93]
Above the photosphere visible sunlight is free to propagate into space,
and almost all of its energy escapes the Sun entirely. The change in
opacity is due to the decreasing amount of
H− ions, which absorb visible light easily.
[93] Conversely, the visible light we see is produced as electrons react with
hydrogen atoms to produce H
− ions.
[94][95]
The photosphere is tens to hundreds of kilometers thick, and is slightly
less opaque than air on Earth. Because the upper part of the
photosphere is cooler than the lower part, an image of the Sun appears
brighter in the center than on the edge or
limb of the solar disk, in a phenomenon known as
limb darkening.
[93] The spectrum of sunlight has approximately the spectrum of a
black-body radiating at about 6,000
K, interspersed with atomic
absorption lines from the tenuous layers above the photosphere. The photosphere has a particle density of ~10
23 m
−3 (about 0.37% of the particle number per volume of
Earth's atmosphere
at sea level). The photosphere is not fully ionized—the extent of
ionization is about 3%, leaving almost all of the hydrogen in atomic
form.
[96]
During early studies of the
optical spectrum of the photosphere, some absorption lines were found that did not correspond to any
chemical elements then known on Earth. In 1868,
Norman Lockyer hypothesized that these absorption lines were caused by a new element that he dubbed
helium, after the Greek Sun god
Helios. Twenty-five years later, helium was isolated on Earth.
[97]
Atmosphere
During a total
solar eclipse, the solar
corona can be seen with the naked eye, during the brief period of totality.
During a total
solar eclipse,
when the disk of the Sun is covered by that of the Moon, parts of the
Sun's surrounding atmosphere can be seen. It is composed of four
distinct parts: the
chromosphere, the
transition region, the
corona and the
heliosphere.
The coolest layer of the Sun is a temperature minimum region extending to about
500 km above the photosphere, and has a temperature of about
4,100 K.
[93] This part of the Sun is cool enough to allow the existence of simple molecules such as
carbon monoxide and water, which can be detected via their absorption spectra.
[98]
The chromosphere, transition region, and corona are much hotter than the surface of the Sun.
[93] The reason is not well understood, but evidence suggests that
Alfvén waves may have enough energy to heat the corona.
[99]
Above the temperature minimum layer is a layer about
2,000 km thick, dominated by a spectrum of emission and absorption lines.
[93] It is called the
chromosphere from the Greek root
chroma, meaning color, because the chromosphere is visible as a colored flash at the beginning and end of total
solar eclipses.
[90] The temperature of the chromosphere increases gradually with altitude, ranging up to around
20,000 K near the top.
[93] In the upper part of the chromosphere
helium becomes partially
ionized.
[100]
Taken by
Hinode's
Solar Optical Telescope on 12 January 2007, this image of the Sun
reveals the filamentary nature of the plasma connecting regions of
different magnetic polarity.
Above the chromosphere, in a thin (about 200 km)
transition region, the temperature rises rapidly from around 20,000
K in the upper chromosphere to coronal temperatures closer to 1,000,000
K.
[101]
The temperature increase is facilitated by the full ionization of
helium in the transition region, which significantly reduces radiative
cooling of the plasma.
[100] The transition region does not occur at a well-defined altitude. Rather, it forms a kind of
nimbus around chromospheric features such as
spicules and
filaments, and is in constant, chaotic motion.
[90] The transition region is not easily visible from Earth's surface, but is readily observable from
space by instruments sensitive to the
extreme ultraviolet portion of the
spectrum.
[102]
The
corona is the next layer of the Sun. The low corona, near the surface of the Sun, has a particle density around 10
15 m
−3 to 10
16 m
−3.
[100][f]
The average temperature of the corona and solar wind is about
1,000,000–2,000,000 K; however, in the hottest regions it is
8,000,000–20,000,000 K.
[101] Although no complete theory yet exists to account for the temperature
of the corona, at least some of its heat is known to be from
magnetic reconnection.
[101][103]
The corona is the extended atmosphere of the Sun, which has a volume
much larger than the volume enclosed by the Sun's photosphere. A flow of
plasma outward from the Sun into interplanetary space is the
solar wind.
[103]
The
heliosphere,
the tenuous outermost atmosphere of the Sun, is filled with the solar
wind plasma. This outermost layer of the Sun is defined to begin at the
distance where the flow of the
solar wind becomes
superalfvénic—that is, where the flow becomes faster than the speed of
Alfvén waves,
[104]
at approximately 20 solar radii (0.1 AU).
Turbulence and dynamic forces in the heliosphere cannot affect the shape
of the solar corona within, because the information can only travel at
the speed of Alfvén waves. The solar wind travels outward continuously
through the heliosphere,
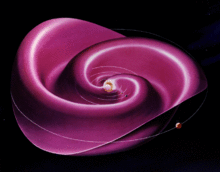
[105][106] forming the solar magnetic field into a
spiral shape,
[103] until it impacts the
heliopause more than 50
AU from the Sun. In December 2004, the
Voyager 1 probe passed through a shock front that is thought to be part of the heliopause.
[107] In late 2012 Voyager 1 recorded a marked increase in
cosmic ray
collisions and a sharp drop in lower energy particles from the solar
wind, which suggested that the probe had passed through the heliopause
and entered the
interstellar medium.
[108]
Photons and neutrinos
High-energy
gamma-ray
photons initially released with fusion reactions in the core are almost
immediately absorbed by the solar plasma of the radiative zone, usually
after traveling only a few millimeters. Re-emission happens in a random
direction and usually at a slightly lower energy. With this sequence of
emissions and absorptions, it takes a long time for radiation to reach
the Sun's surface. Estimates of the photon travel time range between
10,000 and 170,000 years.
[109] In contrast, it takes only 2.3 seconds for the
neutrinos,
which account for about 2% of the total energy production of the Sun,
to reach the surface. Because energy transport in the Sun is a process
that involves photons in thermodynamic equilibrium with matter, the time
scale of energy transport in the Sun is longer, on the order of
30,000,000 years. This is the time it would take the Sun to return to a
stable state, if the rate of energy generation in its core were suddenly
changed.
[110]
Neutrinos are also released by the fusion reactions in the core,
but, unlike photons, they rarely interact with matter, so almost all are
able to escape the Sun immediately. For many years measurements of the
number of neutrinos produced in the Sun were
lower than theories predicted by a factor of 3. This discrepancy was resolved in 2001 through the discovery of the effects of
neutrino oscillation: the Sun emits the number of neutrinos predicted by the
theory, but neutrino detectors were missing
2⁄3 of them because the neutrinos had changed
flavor by the time they were detected.
[111]
Magnetism and activity
Magnetic field
Visible light photograph of sunspot, 13 December 2006
In
this false-color ultraviolet image, the Sun shows a C3-class solar
flare (white area on upper left), a solar tsunami (wave-like structure,
upper right) and multiple filaments of
plasma following a magnetic field, rising from the stellar surface.
The Sun has a
magnetic field that varies across the surface of the Sun. Its polar field is 1–2
gauss (0.0001–0.0002
T), whereas the field is typically 3,000 gauss (0.3 T) in features on the Sun called
sunspots and 10–100 gauss (0.001–0.01 T) in
solar prominences.
[1]
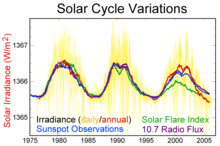
The magnetic field also varies in time and location. The quasi-periodic 11-year
solar cycle is the most prominent variation in which the number and size of sunspots waxes and wanes.
Sunspots are visible as dark patches on the Sun's
photosphere, and correspond to concentrations of magnetic field where the
convective transport
of heat is inhibited from the solar interior to the surface. As a
result, sunspots are slightly cooler than the surrounding photosphere,
and, so, they appear dark. At a typical
solar minimum,
few sunspots are visible, and occasionally none can be seen at all.
Those that do appear are at high solar latitudes. As the solar cycle
progresses towards its
maximum, sunspots tend form closer to the solar equator, a phenomenon known as
Spörer's law. The largest sunspots can be tens of thousands of kilometers across.
[115]
An 11-year sunspot cycle is half of a 22-year
Babcock–Leighton
dynamo cycle, which corresponds to an oscillatory exchange of energy between
toroidal and poloidal solar magnetic fields. At
solar-cycle maximum, the external poloidal dipolar magnetic field is near its dynamo-cycle minimum strength, but an internal
toroidal
quadrupolar field, generated through differential rotation within the
tachocline, is near its maximum strength. At this point in the dynamo
cycle, buoyant upwelling within the convective zone forces emergence of
toroidal magnetic field through the photosphere, giving rise to pairs of
sunspots, roughly aligned east–west and having footprints with opposite
magnetic polarities. The magnetic polarity of sunspot pairs alternates
every solar cycle, a phenomenon known as the Hale cycle.
[116][117]
During the solar cycle's declining phase, energy shifts from the
internal toroidal magnetic field to the external poloidal field, and
sunspots diminish in number and size. At
solar-cycle minimum,
the toroidal field is, correspondingly, at minimum strength, sunspots
are relatively rare, and the poloidal field is at its maximum strength.
With the rise of the next 11-year sunspot cycle, differential rotation
shifts magnetic energy back from the poloidal to the toroidal field, but
with a polarity that is opposite to the previous cycle. The process
carries on continuously, and in an idealized, simplified scenario, each
11-year sunspot cycle corresponds to a change, then, in the overall
polarity of the Sun's large-scale magnetic field.
[118][119]
The solar magnetic field extends well beyond the Sun itself. The
electrically conducting solar wind plasma carries the Sun's magnetic
field into space, forming what is called the
interplanetary magnetic field.
[103] In an approximation known as ideal
magnetohydrodynamics,
plasma particles only move along the magnetic field lines. As a result,
the outward-flowing solar wind stretches the interplanetary magnetic
field outward, forcing it into a roughly radial structure. For a simple
dipolar solar magnetic field, with opposite hemispherical polarities on
either side of the solar magnetic equator, a thin
current sheet is formed in the solar wind.
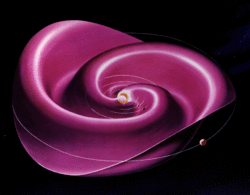
[103] At great distances, the rotation of the Sun twists the dipolar magnetic field and corresponding current sheet into an
Archimedean spiral structure called the
Parker spiral.
[103]
The interplanetary magnetic field is much stronger than the dipole
component of the solar magnetic field. The Sun's dipole magnetic field
of 50–400
μT
(at the photosphere) reduces with the inverse-cube of the distance to
about 0.1 nT at the distance of Earth. However, according to spacecraft
observations the interplanetary field at Earth's location is around
5 nT, about a hundred times greater.
[120] The difference is due to magnetic fields generated by electrical currents in the plasma surrounding the Sun.
Variation in activity
Measurements from 2005 of solar cycle variation during the last 30 years
The Sun's magnetic field leads to many effects that are collectively called
solar activity.
Solar flares and
coronal-mass ejections tend to occur at sunspot groups. Slowly changing high-speed streams of
solar wind are emitted from
coronal holes at the photospheric surface. Both coronal-mass ejections and high-speed streams of solar wind carry plasma and
interplanetary magnetic field outward into the Solar System.
[121] The effects of solar activity on Earth include
auroras at moderate to high latitudes and the disruption of radio communications and
electric power. Solar activity is thought to have played a large role in the
formation and evolution of the Solar System.
With solar-cycle modulation of sunspot number comes a corresponding modulation of
space weather conditions, including those surrounding Earth where technological systems can be affected.
Long-term change
Long-term secular change in sunspot number is thought, by some
scientists, to be correlated with long-term change in solar irradiance,
[122] which, in turn, might influence Earth's long-term climate.
[123]
For example, in the 17th century, the solar cycle appeared to have
stopped entirely for several decades; few sunspots were observed during a
period known as the
Maunder minimum. This coincided in time with the era of the
Little Ice Age, when Europe experienced unusually cold temperatures.
[124] Earlier extended minima have been discovered through analysis of
tree rings and appear to have coincided with lower-than-average global temperatures.
[125]
A recent theory claims that there are magnetic instabilities in
the core of the Sun that cause fluctuations with periods of either
41,000 or 100,000 years. These could provide a better explanation of the
ice ages than the
Milankovitch cycles.
[126][127]
Life phases
The Sun today is roughly halfway through the most stable part of its life. It has not changed dramatically for over four billion
[a]
years, and will remain fairly stable for more than five billion more.
However, after hydrogen fusion in its core has stopped, the Sun will
undergo dramatic changes, both internally and externally.
Formation
The Sun formed about 4.6 billion years ago from the collapse of part of a giant
molecular cloud that consisted mostly of hydrogen and helium and that probably gave birth to many other stars.
[128] This age is estimated using
computer models of
stellar evolution and through
nucleocosmochronology.
[10] The result is consistent with the
radiometric date of the oldest Solar System material, at 4.567 billion years ago.
[129][130] Studies of ancient
meteorites reveal traces of stable daughter nuclei of short-lived isotopes, such as
iron-60,
that form only in exploding, short-lived stars. This indicates that one
or more supernovae must have occurred near the location where the Sun
formed. A
shock wave
from a nearby supernova would have triggered the formation of the Sun
by compressing the matter within the molecular cloud and causing certain
regions to collapse under their own gravity.
[131] As one fragment of the cloud collapsed it also began to rotate because of
conservation of angular momentum
and heat up with the increasing pressure. Much of the mass became
concentrated in the center, whereas the rest flattened out into a disk
that would become the planets and other Solar System bodies. Gravity and
pressure within the core of the cloud generated a lot of heat as it
accreted more matter from the surrounding disk, eventually triggering
nuclear fusion. Thus, the Sun was born.
Main sequence
The Sun is about halfway through its
main-sequence stage, during which nuclear fusion reactions in its core fuse hydrogen into helium. Each second, more than four million
tonnes of matter are converted into energy within the Sun's core, producing
neutrinos and
solar radiation.
At this rate, the Sun has so far converted around 100 times the mass of
Earth into energy, about 0.03% of the total mass of the Sun. The Sun
will spend a total of approximately 10
billion years as a main-sequence star.
[133]
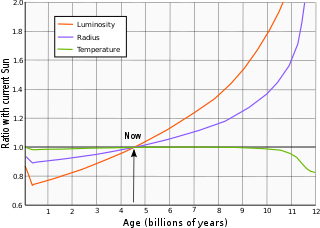
The Sun is gradually becoming hotter during its time on the main
sequence, because the helium atoms in the core occupy less volume than
the
hydrogen atoms
that were fused. The core is therefore shrinking, allowing the outer
layers of the Sun to move closer to the centre and experience a stronger
gravitational force, according to the
inverse-square law.
This stronger force increases the pressure on the core, which is
resisted by a gradual increase in the rate at which fusion occurs. This
process speeds up as the core gradually becomes denser. It is estimated
that the Sun has become 30% brighter in the last 4.5 billion years.
[134] At present, it is increasing in brightness by about 1% every 100 million years.
[135]
After core hydrogen exhaustion
The size of the current Sun (now in the
main sequence) compared to its estimated size during its red-giant phase in the future
The Sun does not have enough mass to explode as a
supernova. Instead it will exit the
main sequence in approximately 5 billion years and start to turn into a
red giant.
[136][137] As a red giant, the Sun will grow so large that it will engulf Mercury, Venus, and probably Earth.
[137][138]
Even before it becomes a red giant, the luminosity of the Sun
will have nearly doubled, and Earth will receive as much sunlight as
Venus receives today. Once the core hydrogen is exhausted in 5.4 billion
years, the Sun will expand into a
subgiant
phase and slowly double in size over about half a billion years. It
will then expand more rapidly over about half a billion years until it
is over two hundred times larger than today and a couple of thousand
times more luminous. This then starts the
red-giant-branch phase where the Sun will spend around a billion years and lose around a third of its mass.
[137]
Evolution of a Sun-like star. The track of a one solar mass star on the
Hertzsprung–Russell diagram is shown from the main sequence to the post-asymptotic-giant-branch stage.
After the red-giant branch the Sun has approximately 120 million
years of active life left, but much happens. First, the core, full of
degenerate helium ignites violently in the
helium flash,
where it is estimated that 6% of the core, itself 40% of the Sun's
mass, will be converted into carbon within a matter of minutes through
the
triple-alpha process.
[139]
The Sun then shrinks to around 10 times its current size and 50 times
the luminosity, with a temperature a little lower than today. It will
then have reached the
red clump or
horizontal branch,
but a star of the Sun's mass does not evolve blueward along the
horizontal branch. Instead, it just becomes moderately larger and more
luminous over about 100 million years as it continues to burn helium in
the core.
[137]
When the helium is exhausted, the Sun will repeat the expansion
it followed when the hydrogen in the core was exhausted, except that
this time it all happens faster, and the Sun becomes larger and more
luminous. This is the
asymptotic-giant-branch
phase, and the Sun is alternately burning hydrogen in a shell or helium
in a deeper shell. After about 20 million years on the early asymptotic
giant branch, the Sun becomes increasingly unstable, with rapid mass
loss and
thermal pulses
that increase the size and luminosity for a few hundred years every
100,000 years or so. The thermal pulses become larger each time, with
the later pulses pushing the luminosity to as much as 5,000 times the
current level and the radius to over 1 AU.
[140] According to a 2008 model, Earth's orbit is shrinking due to
tidal forces (and, eventually, drag from the lower
chromosphere),
so that it will be engulfed by the Sun near the tip of the red giant
branch phase, 1 and 3.8 million years after Mercury and Venus have
respectively suffered the same fate. Models vary depending on the rate
and timing of mass loss. Models that have higher mass loss on the
red-giant branch produce smaller, less luminous stars at the tip of the
asymptotic giant branch, perhaps only 2,000 times the luminosity and
less than 200 times the radius.
[137] For the Sun, four thermal pulses are predicted before it completely loses its outer envelope and starts to make a
planetary nebula. By the end of that phase—lasting approximately 500,000 years—the Sun will only have about half of its current mass.
The post-asymptotic-giant-branch evolution is even faster. The
luminosity stays approximately constant as the temperature increases,
with the ejected half of the Sun's mass becoming ionised into a
planetary nebula as the exposed core reaches 30,000 K. The final naked core, a
white dwarf, will have a temperature of over 100,000 K, and contain an estimated 54.05% of the Sun's present day mass.
[137]
The planetary nebula will disperse in about 10,000 years, but the white
dwarf will survive for trillions of years before fading to a
hypothetical
black dwarf.
[141][142]
Motion and location
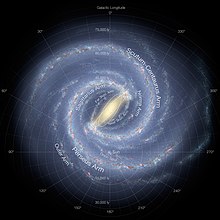
Illustration of the Milky Way, showing the location of the Sun
The Sun lies close to the inner rim of the
Milky Way's
Orion Arm, in the
Local Interstellar Cloud or the
Gould Belt, at a distance of 7.5–8.5
kpc (25,000–28,000 light-years) from the
Galactic Center. The Sun is contained within the
Local Bubble, a space of rarefied hot gas, possibly produced by the supernova remnant
Geminga,
[149] or multiple supernovae in subgroup B1 of the Pleiades moving group.
[150] The distance between the local arm and the next arm out, the
Perseus Arm, is about 6,500 light-years.
[151] The Sun, and thus the Solar System, is found in what scientists call the
galactic habitable zone.
The
Apex of the Sun's Way, or the
solar apex, is the direction that the Sun travels relative to other nearby stars. This motion is towards a point in the constellation
Hercules, near the star
Vega. Of the 50
nearest stellar systems within 17 light-years from Earth (the closest being the red dwarf
Proxima Centauri at approximately 4.2 light-years), the Sun ranks fourth in mass.
[152]
Orbit in Milky Way
The Sun orbits the center of the Milky Way, and it is presently moving in the direction of the constellation of
Cygnus. A simple model of the motion of a star in the galaxy gives the
galactic coordinates X,
Y, and
Z as:


where
U,
V, and
W are the respective velocities with respect to the
local standard of rest,
A and
B are the
Oort constants,

is the angular velocity of galactic rotation for the local standard of rest,

is the "epicyclic frequency", and ν is the vertical oscillation frequency.
[153] For the sun, the present values of
U,
V, and
W are estimated as

km/s, and estimates for the other constants are
A = 15.5 km/s/
kpc,
B = −12.2 km/s/kpc, κ = 37 km/s/kpc, and ν=74 km/s/kpc. We take
X(0) and
Y(0) to be zero and
Z(0) is estimated to be 17 parsecs.
[154]
This model implies that the sun circulates around a point that is
itself going around the galaxy. The period of the sun's circulation
around the point is

.
which, using the equivalence that a parsec equals 1 km/s times 0.978
million years, comes to 166 million years, shorter than the time it
takes for the point to go around the galaxy. In the (
X, Y) coordinates, the sun describes an ellipse around the point, whose length in the
Y direction is

and whose width in the
X direction is

The ratio of length to width of this ellipse, the same for all stars in our neighborhood, is

The moving point is presently at


The oscillation in the
Z direction takes the sun

above the galactic plane and the same distance below it, with a period of

or 83 million years, approximately 2.7 times per orbit.
[155] Although

is 222 million years, the value of

at the point around which the sun circulates is

(see
Oort constants),
corresponding to 235 million years, and this is the time that the point
takes to go once around the galaxy. Other stars with the same value of

have take the same amount of time to go around the galaxy as the sun and thus remain in the same general vicinity as the sun.
The Sun's orbit around the Milky Way is perturbed due to the
non-uniform mass distribution in Milky Way, such as that in and between
the galactic spiral arms. It has been argued that the Sun's passage
through the higher density spiral arms often coincides with
mass extinctions on Earth, perhaps due to increased
impact events.
[156] It takes the Solar System about 225–250 million years to complete one orbit through the Milky Way (a
galactic year),
[157] so it is thought to have completed 20–25 orbits during the lifetime of the Sun. The
orbital speed of the Solar System about the center of the Milky Way is approximately 251 km/s (156 mi/s).
[158] At this speed, it takes around 1,190 years for the Solar System to travel a distance of 1 light-year, or 7 days to travel 1
AU.
[159]
The Milky Way is moving with respect to the
cosmic microwave background radiation (CMB) in the direction of the constellation
Hydra with a speed of 550 km/s, and the Sun's resultant velocity with respect to the CMB is about 370 km/s in the direction of
Crater or
Leo.
[160]
Theoretical problems
Map of the full Sun by STEREO and
SDO spacecraft
Coronal heating problem
The temperature of the photosphere is approximately 6,000 K, whereas
the temperature of the corona reaches 1,000,000–2,000,000 K.
[101] The high temperature of the corona shows that it is heated by something other than direct
heat conduction from the photosphere.
[103]
It is thought that the energy necessary to heat the corona is
provided by turbulent motion in the convection zone below the
photosphere, and two main mechanisms have been proposed to explain
coronal heating.
[101] The first is
wave heating, in which sound, gravitational or magnetohydrodynamic waves are produced by turbulence in the convection zone.
[101] These waves travel upward and dissipate in the corona, depositing their energy in the ambient matter in the form of heat.
[161] The other is
magnetic heating, in which magnetic energy is continuously built up by photospheric motion and released through
magnetic reconnection in the form of large
solar flares and myriad similar but smaller events—
nanoflares.
[162]
Currently, it is unclear whether waves are an efficient heating mechanism. All waves except
Alfvén waves have been found to dissipate or refract before reaching the corona.
[163]
In addition, Alfvén waves do not easily dissipate in the corona.
Current research focus has therefore shifted towards flare heating
mechanisms.
[101]
Faint young Sun problem
Theoretical models of the Sun's development suggest that 3.8 to 2.5 billion years ago, during the
Archean eon,
the Sun was only about 75% as bright as it is today. Such a weak star
would not have been able to sustain liquid water on Earth's surface, and
thus life should not have been able to develop. However, the geological
record demonstrates that Earth has remained at a fairly constant
temperature throughout its history, and that the young Earth was
somewhat warmer than it is today. One theory among scientists is that
the atmosphere of the young Earth contained much larger quantities of
greenhouse gases (such as
carbon dioxide,
methane) than are present today, which trapped enough heat to compensate for the smaller amount of
solar energy reaching it.
[164]
However, examination of Archaean sediments appears inconsistent
with the hypothesis of high greenhouse concentrations. Instead, the
moderate temperature range may be explained by a lower surface
albedo
brought about by less continental area and the "lack of biologically
induced cloud condensation nuclei". This would have led to increased
absorption of solar energy, thereby compensating for the lower solar
output.
[165]
History of observation
The enormous effect of the Sun on Earth has been recognized since
prehistoric times, and the Sun has been
regarded by some cultures as a
deity.
Early understanding
The Sun has been an object of veneration in many cultures throughout
human history. Humanity's most fundamental understanding of the Sun is
as the luminous disk in the
sky, whose presence above the
horizon creates day and whose absence causes night. In many prehistoric and ancient cultures, the Sun was thought to be a
solar deity or other
supernatural entity.
Worship of the Sun was central to civilizations such as the
ancient Egyptians, the
Inca of South America and the
Aztecs of what is now
Mexico. In religions such as
Hinduism, the Sun is still considered a god. Many ancient monuments were constructed with solar phenomena in mind; for example, stone
megaliths accurately mark the summer or winter
solstice (some of the most prominent megaliths are located in
Nabta Playa,
Egypt;
Mnajdra, Malta and at
Stonehenge, England);
Newgrange, a prehistoric human-built mount in Ireland, was designed to detect the winter solstice; the pyramid of
El Castillo at
Chichén Itzá in Mexico is designed to cast shadows in the shape of serpents climbing the
pyramid at the vernal and autumnal
equinoxes.
The Egyptians portrayed the god
Ra as being carried across the sky in a solar barque, accompanied by lesser gods, and to the Greeks, he was
Helios, carried by a chariot drawn by fiery horses. From the reign of
Elagabalus in the
late Roman Empire the Sun's birthday was a holiday celebrated as
Sol Invictus (literally "Unconquered Sun") soon after the winter solstice, which may have been an antecedent to Christmas. Regarding the
fixed stars, the Sun appears from Earth to revolve once a year along the
ecliptic through the
zodiac, and so Greek astronomers categorized it as one of the seven
planets (Greek
planetes, "wanderer"); the naming of the
days of the weeks after the seven planets dates to the
Roman era.
[166][167][168]
Development of scientific understanding
In the early first millennium BC,
Babylonian astronomers
observed that the Sun's motion along the ecliptic is not uniform,
though they did not know why; it is today known that this is due to the
movement of
Earth in an
elliptic orbit around the Sun, with Earth moving faster when it is nearer to the Sun at
perihelion and moving slower when it is farther away at
aphelion.
[169]
One of the first people to offer a scientific or philosophical explanation for the Sun was the
Greek philosopher Anaxagoras. He reasoned that it was not the
chariot of
Helios, but instead a giant flaming ball of metal even larger than the land of the
Peloponnesus and that the
Moon reflected the light of the Sun.
[170] For teaching this
heresy, he was imprisoned by the authorities and
sentenced to death, though he was later released through the intervention of
Pericles.
Eratosthenes estimated the distance between Earth and the Sun in the 3rd century BC as "of stadia
myriads 400 and 80000", the translation of which is ambiguous, implying either 4,080,000
stadia
(755,000 km) or 804,000,000 stadia (148 to 153 million kilometers or
0.99 to 1.02 AU); the latter value is correct to within a few percent.
In the 1st century AD,
Ptolemy estimated the distance as 1,210 times
the radius of Earth, approximately 7.71 million kilometers (0.0515 AU).
[171]
The theory that the Sun is the center around which the planets orbit was first proposed by the ancient Greek
Aristarchus of Samos in the 3rd century BC, and later adopted by
Seleucus of Seleucia (see
Heliocentrism). This view was developed in a more detailed
mathematical model of a heliocentric system in the 16th century by
Nicolaus Copernicus.
Observations of sunspots were recorded during the
Han Dynasty (206 BC–AD 220) by
Chinese astronomers, who maintained records of these observations for centuries.
Averroes also provided a description of sunspots in the 12th century.
[172] The invention of the
telescope in the early 17th century permitted detailed observations of
sunspots by
Thomas Harriot,
Galileo Galilei
and other astronomers. Galileo posited that sunspots were on the
surface of the Sun rather than small objects passing between Earth and
the Sun.
[173]
Arabic astronomical contributions include
Albatenius' discovery that the direction of the Sun's
apogee (the place in the Sun's orbit against the fixed stars where it seems to be moving slowest) is changing.
[174] (In modern heliocentric terms, this is caused by a gradual motion of the aphelion of the
Earth's orbit).
Ibn Yunus observed more than 10,000 entries for the Sun's position for many years using a large
astrolabe.
[175]
Sol, the Sun, from a 1550 edition of
Guido Bonatti's
Liber astronomiae.
From an observation of a
transit of Venus in 1032, the Persian astronomer and polymath
Avicenna concluded that Venus is closer to Earth than the Sun.
[176] In 1672
Giovanni Cassini and
Jean Richer determined the distance to
Mars and were thereby able to calculate the distance to the Sun.
In 1666,
Isaac Newton observed the Sun's light using a
prism, and showed that it is made up of light of many colors.
[177] In 1800,
William Herschel discovered
infrared radiation beyond the red part of the solar spectrum.
[178] The 19th century saw advancement in spectroscopic studies of the Sun;
Joseph von Fraunhofer recorded more than 600
absorption lines in the spectrum, the strongest of which are still often referred to as
Fraunhofer lines. In the early years of the modern scientific era, the source of the Sun's energy was a significant puzzle.
Lord Kelvin suggested that the Sun is a gradually cooling liquid body that is radiating an internal store of heat.
[179] Kelvin and
Hermann von Helmholtz then proposed a
gravitational contraction
mechanism to explain the energy output, but the resulting age estimate
was only 20 million years, well short of the time span of at least 300
million years suggested by some geological discoveries of that time.
[179][180] In 1890
Joseph Lockyer, who discovered helium in the solar spectrum, proposed a meteoritic hypothesis for the formation and evolution of the Sun.
[181]
Not until 1904 was a documented solution offered.
Ernest Rutherford suggested that the Sun's output could be maintained by an internal source of heat, and suggested
radioactive decay as the source.
[182] However, it would be
Albert Einstein who would provide the essential clue to the source of the Sun's energy output with his
mass-energy equivalence relation
E = mc2.
[183] In 1920, Sir
Arthur Eddington
proposed that the pressures and temperatures at the core of the Sun
could produce a nuclear fusion reaction that merged hydrogen (protons)
into helium nuclei, resulting in a production of energy from the net
change in mass.
[184] The preponderance of hydrogen in the Sun was confirmed in 1925 by
Cecilia Payne using the
ionization theory developed by
Meghnad Saha, an Indian physicist. The theoretical concept of fusion was developed in the 1930s by the astrophysicists
Subrahmanyan Chandrasekhar and
Hans Bethe. Hans Bethe calculated the details of the two main energy-producing nuclear reactions that power the Sun.
[185][186] In 1957,
Margaret Burbidge,
Geoffrey Burbidge,
William Fowler and
Fred Hoyle showed that most of the elements in the universe have been
synthesized by nuclear reactions inside stars, some like the Sun.
[187]
Solar space missions
A lunar transit of the Sun captured during calibration of STEREO B's ultraviolet imaging cameras
[188]
The first satellites designed to observe the Sun were
NASA's
Pioneers
5, 6, 7, 8 and 9, which were launched between 1959 and 1968. These
probes orbited the Sun at a distance similar to that of Earth, and made
the first detailed measurements of the solar wind and the solar magnetic
field.
Pioneer 9 operated for a particularly long time, transmitting data until May 1983.
[189][190]
In the 1970s, two
Helios spacecraft and the
Skylab Apollo Telescope Mount
provided scientists with significant new data on solar wind and the
solar corona. The Helios 1 and 2 probes were U.S.–German collaborations
that studied the solar wind from an orbit carrying the spacecraft inside
Mercury's orbit at
perihelion.
[191] The Skylab space station, launched by NASA in 1973, included a solar
observatory module called the Apollo Telescope Mount that was operated by astronauts resident on the station.
[102]
Skylab made the first time-resolved observations of the solar
transition region and of ultraviolet emissions from the solar corona.
[102] Discoveries included the first observations of
coronal mass ejections, then called "coronal transients", and of
coronal holes, now known to be intimately associated with the
solar wind.
[191]
In 1980, the
Solar Maximum Mission was launched by
NASA. This spacecraft was designed to observe
gamma rays,
X-rays and
UV radiation from
solar flares during a time of high solar activity and
solar luminosity.
Just a few months after launch, however, an electronics failure caused
the probe to go into standby mode, and it spent the next three years in
this inactive state. In 1984
Space Shuttle Challenger mission
STS-41C
retrieved the satellite and repaired its electronics before
re-releasing it into orbit. The Solar Maximum Mission subsequently
acquired thousands of images of the solar corona before
re-entering Earth's atmosphere in June 1989.
[192]
Launched in 1991, Japan's
Yohkoh (
Sunbeam)
satellite observed solar flares at X-ray wavelengths. Mission data
allowed scientists to identify several different types of flares, and
demonstrated that the corona away from regions of peak activity was much
more dynamic and active than had previously been supposed. Yohkoh
observed an entire solar cycle but went into standby mode when an
annular eclipse in 2001 caused it to lose its lock on the Sun. It was destroyed by atmospheric re-entry in 2005.
[193]
One of the most important solar missions to date has been the
Solar and Heliospheric Observatory, jointly built by the
European Space Agency and
NASA and launched on 2 December 1995.
[102] Originally intended to serve a two-year mission, a mission extension through 2012 was approved in October 2009.
[194] It has proven so useful that a follow-on mission, the
Solar Dynamics Observatory (SDO), was launched in February 2010.
[195] Situated at the
Lagrangian point
between Earth and the Sun (at which the gravitational pull from both is
equal), SOHO has provided a constant view of the Sun at many
wavelengths since its launch.
[102] Besides its direct solar observation, SOHO has enabled the discovery of a large number of
comets, mostly tiny
sungrazing comets that incinerate as they pass the Sun.
[196]
A solar prominence erupts in August 2012, as captured by SDO
All these satellites have observed the Sun from the plane of the
ecliptic, and so have only observed its equatorial regions in detail.
The
Ulysses probe was launched in 1990 to study the Sun's polar regions. It first travelled to
Jupiter,
to "slingshot" into an orbit that would take it far above the plane of
the ecliptic. Once Ulysses was in its scheduled orbit, it began
observing the solar wind and magnetic field strength at high solar
latitudes, finding that the solar wind from high latitudes was moving at
about 750 km/s, which was slower than expected, and that there were
large magnetic waves emerging from high latitudes that scattered
galactic
cosmic rays.
[197]
Elemental abundances in the photosphere are well known from
spectroscopic studies, but the composition of the interior of the Sun is more poorly understood. A
solar wind sample return mission,
Genesis, was designed to allow astronomers to directly measure the composition of solar material.
[198]
The
Solar Terrestrial Relations Observatory
(STEREO) mission was launched in October 2006. Two identical spacecraft
were launched into orbits that cause them to (respectively) pull
further ahead of and fall gradually behind Earth. This enables
stereoscopic imaging of the Sun and solar phenomena, such as
coronal mass ejections.
[199][200]
The
Indian Space Research Organisation has scheduled the launch of a 100 kg satellite named
Aditya for 2017–18. Its main instrument will be a
coronagraph for studying the dynamics of the Solar corona.
[201]
Observation and effects
During
certain atmospheric conditions, the Sun becomes clearly visible to the
naked eye, and can be observed without stress to the eyes. Click on this
photo to see the full cycle of a
sunset, as observed from the high plains of the
Mojave Desert.
The Sun, as seen from low Earth orbit overlooking the
International Space Station. This sunlight is not filtered by the lower atmosphere, which blocks much of the solar spectrum
The brightness of the Sun can cause pain from looking at it with the
naked eye; however, doing so for brief periods is not hazardous for normal non-dilated eyes.
[202][203] Looking directly at the Sun causes
phosphene
visual artifacts and temporary partial blindness. It also delivers
about 4 milliwatts of sunlight to the retina, slightly heating it and
potentially causing damage in eyes that cannot respond properly to the
brightness.
[204][205] UV exposure gradually yellows the lens of the eye over a period of years, and is thought to contribute to the formation of
cataracts, but this depends on general exposure to solar UV, and not whether one looks directly at the Sun.
[206]
Long-duration viewing of the direct Sun with the naked eye can begin to
cause UV-induced, sunburn-like lesions on the retina after about 100
seconds, particularly under conditions where the UV light from the Sun
is intense and well focused;
[207][208]
conditions are worsened by young eyes or new lens implants (which admit
more UV than aging natural eyes), Sun angles near the zenith, and
observing locations at high altitude.
Viewing the Sun through light-concentrating
optics such as
binoculars
may result in permanent damage to the retina without an appropriate
filter that blocks UV and substantially dims the sunlight. When using an
attenuating filter to view the Sun, the viewer is cautioned to use a
filter specifically designed for that use. Some improvised filters that
pass UV or
IR rays, can actually harm the eye at high brightness levels.
[209]
Herschel wedges,
also called Solar Diagonals, are effective and inexpensive for small
telescopes. The sunlight that is destined for the eyepiece is reflected
from an unsilvered surface of a piece of glass. Only a very small
fraction of the incident light is reflected. The rest passes through the
glass and leaves the instrument. If the glass breaks because of the
heat, no light at all is reflected, making the device fail-safe. Simple
filters made of darkened glass allow the full intensity of sunlight to
pass through if they break, endangering the observer's eyesight.
Unfiltered binoculars can deliver hundreds of times as much energy as
using the naked eye, possibly causing immediate damage. It is claimed
that even brief glances at the midday Sun through an unfiltered
telescope can cause permanent damage.
[210]
Partial
solar eclipses are hazardous to view because the eye's
pupil
is not adapted to the unusually high visual contrast: the pupil dilates
according to the total amount of light in the field of view,
not by the brightest object in the field. During partial eclipses most sunlight is blocked by the
Moon passing in front of the Sun, but the uncovered parts of the photosphere have the same
surface brightness
as during a normal day. In the overall gloom, the pupil expands from
~2 mm to ~6 mm, and each retinal cell exposed to the solar image
receives up to ten times more light than it would looking at the
non-eclipsed Sun. This can damage or kill those cells, resulting in
small permanent blind spots for the viewer.
[211]
The hazard is insidious for inexperienced observers and for children,
because there is no perception of pain: it is not immediately obvious
that one's vision is being destroyed.
During
sunrise and
sunset, sunlight is attenuated because of
Rayleigh scattering and
Mie scattering from a particularly long passage through Earth's atmosphere,
[212]
and the Sun is sometimes faint enough to be viewed comfortably with the
naked eye or safely with optics (provided there is no risk of bright
sunlight suddenly appearing through a break between clouds). Hazy
conditions, atmospheric dust, and high humidity contribute to this
atmospheric attenuation.
[213]
An
optical phenomenon, known as a
green flash,
can sometimes be seen shortly after sunset or before sunrise. The flash
is caused by light from the Sun just below the horizon being
bent (usually through a
temperature inversion)
towards the observer. Light of shorter wavelengths (violet, blue,
green) is bent more than that of longer wavelengths (yellow, orange,
red) but the violet and blue light is
scattered more, leaving light that is perceived as green.
[214]
Ultraviolet light from the Sun has
antiseptic properties and can be used to sanitize tools and water. It also causes
sunburn, and has other biological effects such as the production of
vitamin D and
sun tanning. Ultraviolet light is strongly attenuated by Earth's
ozone layer, so that the amount of UV varies greatly with
latitude and has been partially responsible for many biological adaptations, including variations in
human skin color in different regions of the globe.
[215]
Planetary system
The Sun has eight known planets. This includes four
terrestrial planets (
Mercury,
Venus,
Earth, and
Mars), two
gas giants (
Jupiter and
Saturn), and two
ice giants (
Uranus and
Neptune). The Solar System also has at least five
dwarf planets, an
asteroid belt, numerous
comets, and a large number of icy bodies which lie beyond the orbit of Neptune.

