Search This Blog

Monday, September 14, 2020

Galactic coordinate system

From Wikipedia, the free encyclopedia
https://en.wikipedia.org/wiki/Galactic_coordinate_system

Artist's depiction of the Milky Way galaxy, showing the galactic longitude relative to the Galactic Center

The galactic coordinate system is a celestial coordinate system in spherical coordinates, with the Sun as its center, the primary direction aligned with the approximate center of the Milky Way galaxy, and the fundamental plane parallel to an approximation of the galactic plane but offset to its north. It uses the right-handed convention, meaning that coordinates are positive toward the north and toward the east in the fundamental plane.

Galactic longitude

The galactic coordinates use the Sun as the origin. Galactic longitude (l) is measured with primary direction from the Sun to the center of the galaxy in the galactic plane, while the galactic latitude (b) measures the angle of the object above the galactic plane.

Longitude (symbol l) measures the angular distance of an object eastward along the galactic equator from the galactic center. Analogous to terrestrial longitude, galactic longitude is usually measured in degrees (°).

Galactic latitude

Latitude (symbol b) measures the angle of an object north or south of the galactic equator (or midplane) as viewed from Earth; positive to the north, negative to the south. For example, the north galactic pole has a latitude of +90°. Analogous to terrestrial latitude, galactic latitude is usually measured in degrees (°).

Definition

The first galactic coordinate system was used by William Herschel in 1785. A number of different coordinate systems, each differing by a few degrees, were used until 1932, when Lund Observatory assembled a set of conversion tables that defined a standard galactic coordinate system based on a galactic north pole at RA 12h 40m, dec +28° (in the B1900.0 epoch convention) and a 0° longitude at the point where the galactic plane and equatorial plane intersected.

In 1958, the International Astronomical Union (IAU) defined the galactic coordinate system in reference to radio observations of galactic neutral hydrogen through the hydrogen line, changing the definition of the Galactic longitude by 32° and the latitude by 1.5°. In the equatorial coordinate system, for equinox and equator of 1950.0, the north galactic pole is defined at right ascension 12h 49m, declination +27.4°, in the constellation Coma Berenices, with a probable error of ±0.1°. Longitude 0° is the great semicircle that originates from this point along the line in position angle 123° with respect to the equatorial pole. The galactic longitude increases in the same direction as right ascension. Galactic latitude is positive towards the north galactic pole, with a plane passing through the Sun and parallel to the galactic equator being 0°, whilst the poles are ±90°. Based on this definition, the galactic poles and equator can be found from spherical trigonometry and can be precessed to other epochs; see the table.

Equatorial coordinates J2000.0 of galactic reference points
  Right ascension Declination Constellation
North Pole
+90° latitude
12h 51.4m +27.13° Coma Berenices
(near 31 Com)
South Pole
−90° latitude
0h 51.4m −27.13° Sculptor
(near NGC 288)
Center
0° longitude
17h 45.6m −28.94° Sagittarius
(in Sagittarius A)
Anticenter
180° longitude
5h 45.6m +28.94° Auriga
(near HIP 27088)
Galactic north pole.png
Galactic north
Galactic south pole.png
Galactic south
Galactic zero longitude.png
Galactic center

The IAU recommended that during the transition period from the old, pre-1958 system to the new, the old longitude and latitude should be designated lI and bI while the new should be designated lII and bII. This convention is occasionally seen.

Radio source Sagittarius A*, which is the best physical marker of the true galactic center, is located at 17h 45m 40.0409s, −29° 00′ 28.118″ (J2000). Rounded to the same number of digits as the table, 17h 45.7m, −29.01° (J2000), there is an offset of about 0.07° from the defined coordinate center, well within the 1958 error estimate of ±0.1°. Due to the Sun's position, which currently lies 56.75±6.20 ly north of the midplane, and the heliocentric definition adopted by the IAU, the galactic coordinates of Sgr A* are latitude +0° 07′ 12″ south, longitude 0° 04′ 06″. Since as defined the galactic coordinate system does not rotate with time, Sgr A* is actually decreasing in longitude at the rate of galactic rotation at the sun, Ω, approximately 5.7 milliarcseconds per year (see Oort constants).

Conversion between equatorial and galactic coordinates

An object's location expressed in the equatorial coordinate system can be transformed into the galactic coordinate system. In these equations, α is right ascension, δ is declination. NGP refers to the coordinate values of the north galactic pole and NCP to those of the north celestial pole.

The reverse (galactic to equatorial) can also be accomplished with the following conversion formulas.

Rectangular coordinates

In some applications use is made of rectangular coordinates based on galactic longitude and latitude and distance. In some work regarding the distant past or future the galactic coordinate system is taken as rotating so that the x-axis always goes to the centre of the galaxy.

There are two major rectangular variations of galactic coordinates, commonly used for computing space velocities of galactic objects. In these systems the xyz-axes are designated UVW, but the definitions vary by author. In one system, the U axis is directed toward the galactic center (l = 0°), and it is a right-handed system (positive towards the east and towards the north galactic pole); in the other, the U axis is directed toward the galactic anticenter (l = 180°), and it is a left-handed system (positive towards the east and towards the north galactic pole).

The anisotropy of the star density in the night sky makes the galactic coordinate system very useful for coordinating surveys, both those that require high densities of stars at low galactic latitudes, and those that require a low density of stars at high galactic latitudes. For this image the Mollweide projection has been applied, typical in maps using galactic coordinates.

In the constellations

The galactic equator runs through the following constellations:


Galactic Center

From Wikipedia, the free encyclopedia
 
The Galactic Center, as seen by one of the 2MASS infrared telescopes, is located in the bright upper left portion of the image.

The Galactic Center (or Galactic Centre) is the rotational center of the Milky Way galaxy; it is a supermassive black hole of 4.100 ± 0.034 million solar masses, which powers the compact radio source Sagittarius A*.  It is 8.2 ± 0.4 kiloparsecs (26,700 ± 1,300 ly) away from Earth in the direction of the constellations Sagittarius, Ophiuchus, and Scorpius where the Milky Way appears brightest.

There are around 10 million stars within one parsec of the Galactic Center, dominated by red giants, with a significant population of massive supergiants and Wolf-Rayet stars from star formation in the region around 1 million years ago.

Discovery

This pan video gives a closer look at a huge image of the central parts of the Milky Way made by combining thousands of images from ESO's VISTA telescope on Paranal in Chile and compares it with the view in visible light. Because VISTA has a camera sensitive to infrared light, it can see through much of the dust blocking the view in visible light, although many more opaque dust filaments still show up well in this picture.

Because of interstellar dust along the line of sight, the Galactic Center cannot be studied at visible, ultraviolet, or soft (low-energy) X-ray wavelengths. The available information about the Galactic Center comes from observations at gamma ray, hard (high-energy) X-ray, infrared, submillimetre, and radio wavelengths.

Immanuel Kant stated in General Natural History and Theory of the Heavens (1755) that a large star was at the center of the Milky Way Galaxy, and that Sirius might be the star.  Harlow Shapley stated in 1918 that the halo of globular clusters surrounding the Milky Way seemed to be centered on the star swarms in the constellation of Sagittarius, but the dark molecular clouds in the area blocked the view for optical astronomy.  In the early 1940s Walter Baade at Mount Wilson Observatory took advantage of wartime blackout conditions in nearby Los Angeles to conduct a search for the center with the 100-inch (250 cm) Hooker Telescope. He found that near the star Alnasl (Gamma Sagittarii) there is a one-degree-wide void in the interstellar dust lanes, which provides a relatively clear view of the swarms of stars around the nucleus of our Milky Way Galaxy. This gap has been known as Baade's Window ever since.

At Dover Heights in Sydney, Australia, a team of radio astronomers from the Division of Radiophysics at the CSIRO, led by Joseph Lade Pawsey, used 'sea interferometry' to discover some of the first interstellar and intergalactic radio sources, including Taurus A, Virgo A and Centaurus A. By 1954 they had built an 80-foot (24 m) fixed dish antenna and used it to make a detailed study of an extended, extremely powerful belt of radio emission that was detected in Sagittarius. They named an intense point-source near the center of this belt Sagittarius A, and realised that it was located at the very center of our Galaxy, despite being some 32 degrees south-west of the conjectured galactic center of the time.

In 1958 the International Astronomical Union (IAU) decided to adopt the position of Sagittarius A as the true zero co-ordinate point for the system of galactic latitude and longitude. In the equatorial coordinate system the location is: RA  17h 45m 40.04s, Dec −29° 00′ 28.1″ (J2000 epoch).

Distance to the Galactic Center

Animation of a barred galaxy like the Milky Way showing the presence of an X-shaped bulge. The X-shape extends to about one half of the bar radius. It is directly visible when the bar is seen from the side, but when the viewer is close to the long axis of the bar it cannot be seen directly and its presence can only be inferred from the distribution of brightnesses of stars along a given direction.

The exact distance between the Solar System and the Galactic Center is not certain, although estimates since 2000 have remained within the range 24–28.4 kilolight-years (7.4–8.7 kiloparsecs). The latest estimates from geometric-based methods and standard candles yield the following distances to the Galactic Center:

  • 7.4±0.2(stat) ± 0.2(syst) or 7.4±0.3 kpc (≈24±kly)
  • 7.62±0.32 kpc (≈24.8±1 kly)
  • 7.7±0.7 kpc (≈25.1±2.3 kly)
  • 7.94 or 8.0±0.5 kpc (≈26±1.6 kly)
  • 7.98±0.15(stat) ± 0.20(syst) or 8.0±0.25 kpc (≈26±0.8 kly)
  • 8.33±0.35 kpc (≈27±1.1 kly)
  • 8.7±0.5 kpc (≈28.4±1.6 kly)

An accurate determination of the distance to the Galactic Center as established from variable stars (e.g. RR Lyrae variables) or standard candles (e.g. red-clump stars) is hindered by countless effects, which include: an ambiguous reddening law; a bias for smaller values of the distance to the Galactic Center because of a preferential sampling of stars toward the near side of the Galactic bulge owing to interstellar extinction; and an uncertainty in characterizing how a mean distance to a group of variable stars found in the direction of the Galactic bulge relates to the distance to the Galactic Center.

The nature of the Milky Way's bar, which extends across the Galactic Center, is also actively debated, with estimates for its half-length and orientation spanning between 1–5 kpc (short or a long bar) and 10–50°. Certain authors advocate that the Milky Way features two distinct bars, one nestled within the other. The bar is delineated by red-clump stars (see also red giant); however, RR Lyrae variables do not trace a prominent Galactic bar. The bar may be surrounded by a ring called the 5-kpc ring that contains a large fraction of the molecular hydrogen present in the Milky Way, and most of the Milky Way's star formation activity. Viewed from the Andromeda Galaxy, it would be the brightest feature of the Milky Way.

Supermassive black hole

There is a supermassive black hole in the bright white area to the right of the center of the image. This composite photograph covers about half of a degree.

The complex astronomical radio source Sagittarius A appears to be located almost exactly at the Galactic Center and contains an intense compact radio source, Sagittarius A*, which coincides with a supermassive black hole at the center of the Milky Way. Accretion of gas onto the black hole, probably involving an accretion disk around it, would release energy to power the radio source, itself much larger than the black hole. The latter is too small to see with present instruments.

Artist impression of a supermassive black hole at the center of a galaxy

A study in 2008 which linked radio telescopes in Hawaii, Arizona and California (Very Long Baseline Interferometry) measured the diameter of Sagittarius A* to be 44 million kilometers (0.3 AU). For comparison, the radius of Earth's orbit around the Sun is about 150 million kilometers (1.0 AU), whereas the distance of Mercury from the Sun at closest approach (perihelion) is 46 million kilometers (0.3 AU). Thus, the diameter of the radio source is slightly less than the distance from Mercury to the Sun.

Scientists at the Max Planck Institute for Extraterrestrial Physics in Germany using Chilean telescopes have confirmed the existence of a supermassive black hole at the Galactic Center, on the order of 4.3 million solar masses.

On 5 January 2015, NASA reported observing an X-ray flare 400 times brighter than usual, a record-breaker, from Sagittarius A*. The unusual event may have been caused by the breaking apart of an asteroid falling into the black hole or by the entanglement of magnetic field lines within gas flowing into Sagittarius A*, according to astronomers.

Stellar population

Galactic Center of the Milky Way and a meteor

The central cubic parsec around Sagittarius A* contains around 10 million stars. Although most of them are old red giant stars, the Galactic Center is also rich in massive stars. More than 100 OB and Wolf–Rayet stars have been identified there so far. They seem to have all been formed in a single star formation event a few million years ago. The existence of these relatively young stars was a surprise to experts, who expected the tidal forces from the central black hole to prevent their formation. This paradox of youth is even stronger for stars that are on very tight orbits around Sagittarius A*, such as S2 and S0-102. The scenarios invoked to explain this formation involve either star formation in a massive star cluster offset from the Galactic Center that would have migrated to its current location once formed, or star formation within a massive, compact gas accretion disk around the central black-hole. Current evidence favors the latter theory, as formation through a large accretion disk is more likely to lead to the observed discrete edge of the young stellar cluster at roughly 0.5 parsec. Most of these 100 young, massive stars seem to be concentrated within one or two disks, rather than randomly distributed within the central parsec. This observation however does not allow definite conclusions to be drawn at this point.

Star formation does not seem to be occurring currently at the Galactic Center, although the Circumnuclear Disk of molecular gas that orbits the Galactic Center at two parsecs seems a fairly favorable site for star formation. Work presented in 2002 by Antony Stark and Chris Martin mapping the gas density in a 400-light-year region around the Galactic Center has revealed an accumulating ring with a mass several million times that of the Sun and near the critical density for star formation. They predict that in approximately 200 million years there will be an episode of starburst in the Galactic Center, with many stars forming rapidly and undergoing supernovae at a hundred times the current rate. This starburst may also be accompanied by the formation of galactic relativistic jets as matter falls into the central black hole. It is thought that the Milky Way undergoes a starburst of this sort every 500 million years.

In addition to the paradox of youth, there is also a "conundrum of old age" associated with the distribution of the old stars at the Galactic Center. Theoretical models had predicted that the old stars—which far outnumber young stars—should have a steeply-rising density near the black hole, a so-called Bahcall–Wolf cusp. Instead, it was discovered in 2009 that the density of the old stars peaks at a distance of roughly 0.5 parsec from Sgr A*, then falls inward: instead of a dense cluster, there is a "hole", or core, around the black hole. Several suggestions have been put forward to explain this puzzling observation, but none is completely satisfactory. For instance, although the black hole would eat stars near it, creating a region of low density, this region would be much smaller than a parsec. Because the observed stars are a fraction of the total number, it is theoretically possible that the overall stellar distribution is different from what is observed, although no plausible models of this sort have been proposed yet.

Gallery

Gamma- and X-ray emitting Fermi bubbles

Galactic gamma- and X-ray bubbles
 
Gamma- and X-ray bubbles at the Milky Way galaxy center: Top: illustration; Bottom: video.

In November 2010, it was announced that two large elliptical lobe structures of energetic plasma, termed "bubbles", which emit gamma- and X-rays, were detected astride the Milky Way galaxy's core. These so-called "Fermi bubbles" extend up to about 25,000 light years above and below the galactic center. The galaxy's diffuse gamma-ray fog hampered prior observations, but the discovery team led by D. Finkbeiner, building on research by G. Dobler, worked around this problem. The 2014 Bruno Rossi Prize went to Tracy Slatyer, Douglas Finkbeiner, and Meng Su "for their discovery, in gamma rays, of the large unanticipated Galactic structure called the Fermi bubbles".

The origin of the bubbles is being researched. The bubbles are connected and seemingly coupled, via energy transport, to the galactic core by columnar structures of energetic plasma dubbed "chimneys". They were seen in visible light and optical measurements were made for the first time in 2020.

QCD matter

From Wikipedia, the free encyclopedia

Quark matter or QCD matter (quantum chromodynamic) refers to any of a number of phases of matter whose degrees of freedom include quarks and gluons, of which the prominent example is quark-gluon plasma. Several series of conferences in 2019, 2020, and 2021 are devoted to this topic.

Quarks are liberated into quark matter at extremely high temperatures and/or densities, and some of them are still only theoretical as they require conditions so extreme that they can not be produced in any laboratory, especially not at equilibrium conditions. Under these extreme conditions, the familiar structure of matter, where the basic constituents are nuclei (consisting of nucleons which are bound states of quarks) and electrons, is disrupted. In quark matter it is more appropriate to treat the quarks themselves as the basic degrees of freedom.

In the standard model of particle physics, the strong force is described by the theory of QCD. At ordinary temperatures or densities this force just confines the quarks into composite particles (hadrons) of size around 10−15 m = 1 femtometer = 1 fm (corresponding to the QCD energy scale ΛQCD ≈ 200 MeV) and its effects are not noticeable at longer distances.

However, when the temperature reaches the QCD energy scale (T of order 1012 kelvins) or the density rises to the point where the average inter-quark separation is less than 1 fm (quark chemical potential μ around 400 MeV), the hadrons are melted into their constituent quarks, and the strong interaction becomes the dominant feature of the physics. Such phases are called quark matter or QCD matter.

The strength of the color force makes the properties of quark matter unlike gas or plasma, instead leading to a state of matter more reminiscent of a liquid. At high densities, quark matter is a Fermi liquid, but is predicted to exhibit color superconductivity at high densities and temperatures below 1012 K.

Occurrence

Natural occurrence

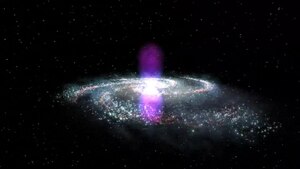
  • According to the Big Bang theory, in the early universe at high temperatures when the universe was only a few tens of microseconds old, the phase of matter took the form of a hot phase of quark matter called the quark–gluon plasma (QGP).
  • Compact stars (neutron stars). A neutron star is much cooler than 1012 K, but gravitational collapse has compressed it to such high densities, that it is reasonable to surmise that quark matter may exist in the core. Compact stars composed mostly or entirely of quark matter are called quark stars or strange stars.

At this time no star with properties expected of these objects has been observed, although some evidence has been provided for quark matter in the cores of large neutron stars.

  • Strangelets. These are theoretically postulated (but as yet unobserved) lumps of strange matter comprising nearly equal amounts of up, down and strange quarks. Strangelets are supposed to be present in the galactic flux of high energy particles and should therefore theoretically be detectable in cosmic rays here on Earth, but no strangelet has been detected with certainty.
  • Cosmic ray impacts. Cosmic rays comprise a lot of different particles, including highly accelerated atomic nuclei, particularly that of iron.

Laboratory experiments suggests that the inevitable interaction with heavy noble gas nuclei in the upper atmosphere would lead to quark–gluon plasma formation.

Laboratory experiments

Particle debris trajectories from one of the first lead-ion collisions with the LHC, as recorded by the ALICE detector. The extremely brief appearance of quark matter in the point of collision is inferred from the statistics of the trajectories.

Even though quark-gluon plasma can only occur under quite extreme conditions of temperature and/or pressure, it is being actively studied at particle colliders, such as the Large Hadron Collider LHC at CERN and the Relativistic Heavy Ion Collider RHIC at Brookhaven National Laboratory.

In these collisions, the plasma only occurs for a very short time before it spontaneously disintegrates. The plasma's physical characteristics are studied by detecting the debris emanating from the collision region with large particle detectors. 

Heavy-ion collisions at very high energies can produce small short-lived regions of space whose energy density is comparable to that of the 20-micro-second-old universe. This has been achieved by colliding heavy nuclei such as lead nuclei at high speeds, and a first time claim of formation of quark–gluon plasma came from the SPS accelerator at CERN in February 2000.

This work has been continued at more powerful accelerators, such as RHIC in the US, and as of 2010 at the European LHC at CERN located in the border area of Switzerland and France. There is good evidence that the quark–gluon plasma has also been produced at RHIC.

Thermodynamics

The context for understanding the thermodynamics of quark matter is the standard model of particle physics, which contains six different flavors of quarks, as well as leptons like electrons and neutrinos. These interact via the strong interaction, electromagnetism, and also the weak interaction which allows one flavor of quark to turn into another. Electromagnetic interactions occur between particles that carry electrical charge; strong interactions occur between particles that carry color charge.

The correct thermodynamic treatment of quark matter depends on the physical context. For large quantities that exist for long periods of time (the "thermodynamic limit"), we must take into account the fact that the only conserved charges in the standard model are quark number (equivalent to baryon number), electric charge, the eight color charges, and lepton number. Each of these can have an associated chemical potential. However, large volumes of matter must be electrically and color-neutral, which determines the electric and color charge chemical potentials. This leaves a three-dimensional phase space, parameterized by quark chemical potential, lepton chemical potential, and temperature.

In compact stars quark matter would occupy cubic kilometers and exist for millions of years, so the thermodynamic limit is appropriate. However, the neutrinos escape, violating lepton number, so the phase space for quark matter in compact stars only has two dimensions, temperature (T) and quark number chemical potential μ. A strangelet is not in the thermodynamic limit of large volume, so it is like an exotic nucleus: it may carry electric charge.

A heavy-ion collision is in neither the thermodynamic limit of large volumes nor long times. Putting aside questions of whether it is sufficiently equilibrated for thermodynamics to be applicable, there is certainly not enough time for weak interactions to occur, so flavor is conserved, and there are independent chemical potentials for all six quark flavors. The initial conditions (the impact parameter of the collision, the number of up and down quarks in the colliding nuclei, and the fact that they contain no quarks of other flavors) determine the chemical potentials.

Phase diagram

Conjectured form of the phase diagram of QCD matter, with temperature on the vertical axis and quark chemical potential on the horizontal axis, both in mega-electron volts.

The phase diagram of quark matter is not well known, either experimentally or theoretically. A commonly conjectured form of the phase diagram is shown in the figure to the right.[15] It is applicable to matter in a compact star, where the only relevant thermodynamic potentials are quark chemical potential μ and temperature T.

For guidance it also shows the typical values of μ and T in heavy-ion collisions and in the early universe. For readers who are not familiar with the concept of a chemical potential, it is helpful to think of μ as a measure of the imbalance between quarks and antiquarks in the system. Higher μ means a stronger bias favoring quarks over antiquarks. At low temperatures there are no antiquarks, and then higher μ generally means a higher density of quarks.

Ordinary atomic matter as we know it is really a mixed phase, droplets of nuclear matter (nuclei) surrounded by vacuum, which exists at the low-temperature phase boundary between vacuum and nuclear matter, at μ = 310 MeV and T close to zero. If we increase the quark density (i.e. increase μ) keeping the temperature low, we move into a phase of more and more compressed nuclear matter. Following this path corresponds to burrowing more and more deeply into a neutron star.

Eventually, at an unknown critical value of μ, there is a transition to quark matter. At ultra-high densities we expect to find the color-flavor-locked (CFL) phase of color-superconducting quark matter. At intermediate densities we expect some other phases (labelled "non-CFL quark liquid" in the figure) whose nature is presently unknown. They might be other forms of color-superconducting quark matter, or something different.

Now, imagine starting at the bottom left corner of the phase diagram, in the vacuum where μ = T = 0. If we heat up the system without introducing any preference for quarks over antiquarks, this corresponds to moving vertically upwards along the T axis. At first, quarks are still confined and we create a gas of hadrons (pions, mostly). Then around T = 150 MeV there is a crossover to the quark gluon plasma: thermal fluctuations break up the pions, and we find a gas of quarks, antiquarks, and gluons, as well as lighter particles such as photons, electrons, positrons, etc. Following this path corresponds to travelling far back in time (so to say), to the state of the universe shortly after the big bang (where there was a very tiny preference for quarks over antiquarks).

The line that rises up from the nuclear/quark matter transition and then bends back towards the T axis, with its end marked by a star, is the conjectured boundary between confined and unconfined phases. Until recently it was also believed to be a boundary between phases where chiral symmetry is broken (low temperature and density) and phases where it is unbroken (high temperature and density). It is now known that the CFL phase exhibits chiral symmetry breaking, and other quark matter phases may also break chiral symmetry, so it is not clear whether this is really a chiral transition line. The line ends at the "chiral critical point", marked by a star in this figure, which is a special temperature and density at which striking physical phenomena, analogous to critical opalescence, are expected.

For a complete description of phase diagram it is required that one must have complete understanding of dense, strongly interacting hadronic matter and strongly interacting quark matter from some underlying theory e.g. quantum chromodynamics (QCD). However, because such a description requires the proper understanding of QCD in its non-perturbative regime, which is still far from being completely understood, any theoretical advance remains very challenging.

Theoretical challenges: calculation techniques

The phase structure of quark matter remains mostly conjectural because it is difficult to perform calculations predicting the properties of quark matter. The reason is that QCD, the theory describing the dominant interaction between quarks, is strongly coupled at the densities and temperatures of greatest physical interest, and hence it is very hard to obtain any predictions from it. Here are brief descriptions of some of the standard approaches.

Lattice gauge theory

The only first-principles calculational tool currently available is lattice QCD, i.e. brute-force computer calculations. Because of a technical obstacle known as the fermion sign problem, this method can only be used at low density and high temperature (μ < T), and it predicts that the crossover to the quark–gluon plasma will occur around T = 150 MeV  However, it cannot be used to investigate the interesting color-superconducting phase structure at high density and low temperature.

Weak coupling theory

Because QCD is asymptotically free it becomes weakly coupled at unrealistically high densities, and diagrammatic methods can be used. Such methods show that the CFL phase occurs at very high density. At high temperatures, however, diagrammatic methods are still not under full control.

Models

To obtain a rough idea of what phases might occur, one can use a model that has some of the same properties as QCD, but is easier to manipulate. Many physicists use Nambu-Jona-Lasinio models, which contain no gluons, and replace the strong interaction with a four-fermion interaction. Mean-field methods are commonly used to analyse the phases. Another approach is the bag model, in which the effects of confinement are simulated by an additive energy density that penalizes unconfined quark matter.

Effective theories

Many physicists simply give up on a microscopic approach, and make informed guesses of the expected phases (perhaps based on NJL model results). For each phase, they then write down an effective theory for the low-energy excitations, in terms of a small number of parameters, and use it to make predictions that could allow those parameters to be fixed by experimental observations.[17]

Other approaches

There are other methods that are sometimes used to shed light on QCD, but for various reasons have not yet yielded useful results in studying quark matter.

1/N expansion

Treat the number of colors N, which is actually 3, as a large number, and expand in powers of 1/N. It turns out that at high density the higher-order corrections are large, and the expansion gives misleading results.

Supersymmetry

Adding scalar quarks (squarks) and fermionic gluons (gluinos) to the theory makes it more tractable, but the thermodynamics of quark matter depends crucially on the fact that only fermions can carry quark number, and on the number of degrees of freedom in general.

Experimental challenges

Experimentally, it is hard to map the phase diagram of quark matter because it has been rather difficult to learn how to tune to high enough temperatures and density in the laboratory experiment using collisions of relativistic heavy ions as experimental tools. However, these collisions ultimately will provide information about the crossover from hadronic matter to QGP. It has been suggested that the observations of compact stars may also constrain the information about the high-density low-temperature region. Models of the cooling, spin-down, and precession of these stars offer information about the relevant properties of their interior. As observations become more precise, physicists hope to learn more.

One of the natural subjects for future research is the search for the exact location of the chiral critical point. Some ambitious lattice QCD calculations may have found evidence for it, and future calculations will clarify the situation. Heavy-ion collisions might be able to measure its position experimentally, but this will require scanning across a range of values of μ and T.

Evidence

In 2020, evidence was provided that the cores of neutron stars with mass ~2M were likely composed of quark matter. Their result was based on neutron-star tidal deformability during a neutron star merger as measured by gravitational-wave observatories, leading to an estimate of star radius, combined with calculations of the equation of state relating the pressure and energy density of the star's core. The evidence was strongly suggestive but did not conclusively prove the existence of quark matter.

Stellar black hole

From Wikipedia, the free encyclopedia
 
A stellar black hole (or stellar-mass black hole) is a black hole formed by the gravitational collapse of a star. They have masses ranging from about 5 to several tens of solar masses. The process is observed as a hypernova explosion or as a gamma ray burst. These black holes are also referred to as collapsars.

Properties

By the no-hair theorem, a black hole can only have three fundamental properties: mass, electric charge and angular momentum (spin). It is believed that black holes formed in nature all have some spin. The spin of a stellar black hole is due to the conservation of angular momentum of the star or objects that produced it.

The gravitational collapse of a star is a natural process that can produce a black hole. It is inevitable at the end of the life of a large star, when all stellar energy sources are exhausted. If the mass of the collapsing part of the star is below the Tolman–Oppenheimer–Volkoff (TOV) limit for neutron-degenerate matter, the end product is a compact star — either a white dwarf (for masses below the Chandrasekhar limit) or a neutron star or a (hypothetical) quark star. If the collapsing star has a mass exceeding the TOV limit, the crush will continue until zero volume is achieved and a black hole is formed around that point in space.

The maximum mass that a neutron star can possess (without becoming a black hole) is not fully understood. In 1939, it was estimated at 0.7 solar masses, called the TOV limit. In 1996, a different estimate put this upper mass in a range from 1.5 to 3 solar masses.

In the theory of general relativity, a black hole could exist of any mass. The lower the mass, the higher the density of matter has to be in order to form a black hole. (See, for example, the discussion in Schwarzschild radius, the radius of a black hole.) There are no known processes that can produce black holes with mass less than a few times the mass of the Sun. If black holes that small exist, they are most likely primordial black holes. Until 2016, the largest known stellar black hole was 15.65±1.45 solar masses. In September 2015, a rotating black hole of 62±4 solar masses was discovered by gravitational waves as it formed in a merger event of two smaller black holes. As of June 2020, the binary system 2MASS J05215658+4359220 was reported to host the smallest-mass black hole currently known to science, with a mass 3.3 solar masses and a diameter of only 19.5 kilometers. 

There is observational evidence for two other types of black holes, which are much more massive than stellar black holes. They are intermediate-mass black holes (in the centre of globular clusters) and supermassive black holes in the centre of the Milky Way and other galaxies.

X-ray compact binary systems

Stellar black holes in close binary systems are observable when matter is transferred from a companion star to the black hole; the energy release in the fall toward the compact star is so large that the matter heats up to temperatures of several hundred million degrees and radiates in X-rays. The black hole therefore is observable in X-rays, whereas the companion star can be observed with optical telescopes. The energy release for black holes and neutron stars are of the same order of magnitude. Black holes and neutron stars are therefore often difficult to distinguish.


However, neutron stars may have additional properties. They show differential rotation, and can have a magnetic field and exhibit localized explosions (thermonuclear bursts). Whenever such properties are observed, the compact object in the binary system is revealed as a neutron star. 


The derived masses come from observations of compact X-ray sources (combining X-ray and optical data). All identified neutron stars have a mass below 3.0 solar masses; none of the compact systems with a mass above 3.0 solar masses display the properties of a neutron star. The combination of these facts make it more and more likely that the class of compact stars with a mass above 3.0 solar masses are in fact black holes. 

Note that this proof of existence of stellar black holes is not entirely observational but relies on theory: we can think of no other object for these massive compact systems in stellar binaries besides a black hole. A direct proof of the existence of a black hole would be if one actually observes the orbit of a particle (or a cloud of gas) that falls into the black hole.

Black hole kicks

The large distances above the galactic plane achieved by some binaries are the result of black hole natal kicks. The velocity distribution of black hole natal kicks seems similar to that of neutron star kick velocities. One might have expected that it would be the momenta that were the same with black holes receiving lower velocity than neutron stars due to their higher mass but that doesn't seem to be the case, which may be due to the fall-back of asymmetrically expelled matter increasing the momentum of the resulting black hole.

Mass gaps

It is predicted by some models of stellar evolution that black holes with masses in two ranges cannot be directly formed by the gravitational collapse of a star. These are sometimes distinguished as the "lower" and "upper" mass gaps, roughly representing the ranges of 2 to 5 and 50 to 150 solar masses (M), respectively. Another range given for the upper gap is 52 to 133 M. 150 M has been regarded as the upper mass limit for stars in the current era of the universe.

Lower mass gap

A lower mass gap is suspected on the basis of a scarcity of observed candidates with masses within a few solar masses above the maximum possible neutron star mass. The existence and theoretical basis for this possible gap are uncertain. The situation may be complicated by the fact that any black holes found in this mass range may have been created via the merging of binary neutron star systems, rather than stellar collapse. The LIGO/Virgo collaboration has reported three candidate events among their gravitational wave observations in run O3 with component masses that fall in this lower mass gap. There has also been reported an observation of a bright, rapidly rotating giant star in a binary system with an unseen companion emitting no light, including x-rays, but having a mass of 3.3+2.8
−0.7
solar masses. This is interpreted to suggest that there may be many such low-mass black holes that are not currently consuming any material and are hence undetectable via the usual x-ray signature.

Upper mass gap

The upper mass gap is predicted by comprehensive models of late-stage stellar evolution. It is expected that with increasing mass, supermassive stars reach a stage where a pair-instability supernova occurs, during which pair production, the production of free electrons and positrons in the collision between atomic nuclei and energetic gamma rays, temporarily reduces the internal pressure supporting the star's core against gravitational collapse. This pressure drop leads to a partial collapse, which in turn causes greatly accelerated burning in a runaway thermonuclear explosion, resulting in the star being blown completely apart without leaving a stellar remnant behind.

Pair-instability supernovae can only happen in stars with a mass range from around 130 to 250 solar masses (M) (and low to moderate metallicity (low abundance of elements other than hydrogen and helium – a situation common in Population III stars). However, this mass gap is expected to be extended down to about 45 solar masses by the process of pair-instability pulsational mass loss, before the occurrence of a "normal" supernova explosion and core collapse. In nonrotating stars the lower bound of the upper mass gap may be as high as 60 M. The possibility of direct collapse into black holes of stars with core mass > 133 M, requiring total stellar mass of > 260 M has been considered, but there may be little chance of observing such a high-mass supernova remnant; i.e., the lower bound of the upper mass gap may represent a mass cutoff.

Observations of the LB-1 system of a star and unseen companion were initially interpreted in terms of a black hole with a mass of about 70 solar masses, which would be excluded by the upper mass gap. However, further investigations have weakened this claim.

Candidates

Our Milky Way galaxy contains several stellar-mass black hole candidates (BHCs) which are closer to us than the supermassive black hole in the galactic center region. Most of these candidates are members of X-ray binary systems in which the compact object draws matter from its partner via an accretion disk. The probable black holes in these pairs range from three to more than a dozen solar masses.

NameBHC mass (solar masses)Companion mass
(solar masses )
Orbital period
(days)
Distance from Earth
(light years)
Location
A0620-00/V616 Mon 11 ± 2 2.6–2.8 0.33 3,500 06:22:44 -00:20:45
GRO J1655-40/V1033 Sco 6.3 ± 0.3 2.6–2.8 2.8 5,000–11,000 16:54:00 -39:50:45
XTE J1118+480/KV UMa 6.8 ± 0.4 6−6.5 0.17 6,200 11:18:11 +48:02:13
Cyg X-1 11 ± 2 ≥18 5.6 6,000–8,000 19:58:22 +35:12:06
GRO J0422+32/V518 Per 4 ± 1 1.1 0.21 8,500 04:21:43 +32:54:27
GRO J1719-24 ≥4.9 ~1.6 possibly 0.6 8,500 17:19:37 -25:01:03
GS 2000+25/QZ Vul 7.5 ± 0.3 4.9–5.1 0.35 8,800 20:02:50 +25:14:11
V404 Cyg 12 ± 2 6.0 6.5 7,800 ± 460 20:24:04 +33:52:03
GX 339-4/V821 Ara 5.8 5–6 1.75 15,000 17:02:50 -48:47:23
GRS 1124-683/GU Mus 7.0 ± 0.6
0.43 17,000 11:26:27 -68:40:32
XTE J1550-564/V381 Nor 9.6 ± 1.2 6.0–7.5 1.5 17,000 15:50:59 -56:28:36
4U 1543-475/IL Lupi 9.4 ± 1.0 0.25 1.1 24,000 15:47:09 -47:40:10
XTE J1819-254/V4641 Sgr 7.1 ± 0.3 5–8 2.82 24,000–40,000 18:19:22 -25:24:25
GRS 1915+105/V1487 Aql 14 ± 4.0 ~1 33.5 40,000 19:15:12 +10:56:44
XTE J1650-500 9.7 ± 1.6 . 0.32
16:50:01 -49:57:45

Extragalactic

Candidates outside our galaxy come from gravitational wave detections:

Outside our galaxy
Name BHC mass
(solar masses)
Companion mass
(solar masses )
Orbital period
(days)
Distance from Earth
(light years)
Location
GW150914 (62 ± 4) M 36 ± 4 29 ± 4 . 1.3 billion
GW170104 (48.7 ± 5) M 31.2 ± 7 19.4 ± 6 . 1.4 billion
GW151226 (21.8 ± 3.5) M 14.2 ± 6 7.5 ± 2.3 . 2.9 billion

The disappearance of N6946-BH1 following a failed supernova in NGC 6946 may have resulted in the formation of a black hole.

Marriage in Islam

From Wikipedia, the free encyclopedia ...