Search This Blog

Thursday, January 13, 2022

Abdominal obesity

From Wikipedia, the free encyclopedia
 
Abdominal obesity
Other namesCentral obesity, truncal obesity; see also § Colloquialisms
Obesity6.JPG
An abdominous obese male
Weight: 182 kg/400 lbs
Height: 185 cm/6 ft 1 in.
Body mass index: 53
 
 
SpecialtyEndocrinology
ComplicationsHeart disease, asthma, stroke, diabetes
CausesSedentary lifestyle, Overeating, Cushing's syndrome, Alcoholism, Polycystic ovarian syndrome, Prader-Willi syndrome

Abdominal obesity, also known as central obesity and truncal obesity, is a condition when excessive abdominal fat around the stomach and abdomen has built up to the extent that it is likely to have a negative impact on health. Abdominal obesity has been strongly linked to cardiovascular disease, Alzheimer's disease, and other metabolic and vascular diseases.

Visceral and central abdominal fat and waist circumference show a strong association with type 2 diabetes.

Visceral fat, also known as organ fat or intra-abdominal fat, is located inside the peritoneal cavity, packed in between internal organs and torso, as opposed to subcutaneous fat, which is found underneath the skin, and intramuscular fat, which is found interspersed in skeletal muscle. Visceral fat is composed of several adipose depots including mesenteric, epididymal white adipose tissue (EWAT), and perirenal fat. An excess of adipose visceral fat is known as central obesity, the "pot belly" or "beer belly" effect, in which the abdomen protrudes excessively. This body type is also known as "apple shaped", as opposed to "pear shaped" in which fat is deposited on the hips and buttocks.

Researchers first started to focus on abdominal obesity in the 1980s when they realized it had an important connection to cardiovascular disease, diabetes, and dyslipidemia. Abdominal obesity was more closely related with metabolic dysfunctions connected with cardiovascular disease than was general obesity. In the late 1980s and early 1990s insightful and powerful imaging techniques were discovered that would further help advance the understanding of the health risks associated with body fat accumulation. Techniques such as computed tomography and magnetic resonance imaging made it possible to categorize mass of adipose tissue located at the abdominal level into intra-abdominal fat and subcutaneous fat.

Health risks

Heart disease

Abdominal obesity is associated with a statistically higher risk of heart disease, hypertension, insulin resistance, and type 2 diabetes (see below). With an increase in the waist to hip ratio and overall waist circumference the risk of death increases as well. Metabolic syndrome is associated with abdominal obesity, blood lipid disorders, inflammation, insulin resistance, full-blown diabetes, and increased risk of developing cardiovascular disease. It is now generally believed that intra-abdominal fat is the depot that conveys the biggest health risk.

Recent validation has concluded that total and regional body volume estimates correlate positively and significantly with biomarkers of cardiovascular risk and BVI calculations correlate significantly with all biomarkers of cardio-vascular risk.

Diabetes

There are numerous theories as to the exact cause and mechanism in type 2 diabetes. Central obesity is known to predispose individuals for insulin resistance. Abdominal fat is especially active hormonally, secreting a group of hormones called that may possibly impair glucose tolerance. But adiponectin, an anti-inflammatory adipokine, which is found in lower concentration in obese and diabetic individuals has shown to be beneficial and protective in type 2 diabetes mellitus (T2DM).

Insulin resistance is a major feature of diabetes mellitus type 2 , and central obesity is correlated with both insulin resistance and T2DM itself. Increased adiposity (obesity) raises serum resistin levels, which in turn directly correlate to insulin resistance. Studies have also confirmed a direct correlation between resistin levels and T2DM. And it is waistline adipose tissue (central obesity) which seems to be the foremost type of fat deposits contributing to rising levels of serum resistin. Conversely, serum resistin levels have been found to decline with decreased adiposity following medical treatment.

Asthma

Developing asthma due to abdominal obesity is also a main concern. As a result of breathing at low lung volume, the muscles are tighter and the airway is narrower. Obesity causes decreased tidal volumes due to reduced in chest expansion that is caused both by the weight on the chest itself and the effect of abdominal obesity on flattening the diaphragms. It is commonly seen that people who are obese breathe quickly and often, while inhaling small volumes of air. People with obesity are also more likely to be hospitalized for asthma. A study has stated that 75% of patients treated for asthma in the emergency room were either overweight or obese.

Alzheimer's disease

Based on studies, it is evident that obesity has a strong association with vascular and metabolic disease which could potentially be linked to Alzheimer's disease. Recent studies have also shown an association between mid-life obesity and dementia, but the relationship between later life obesity and dementia is less clear. A study by Debette et al. (2010) examining over 700 adults found evidence to suggest higher volumes of visceral fat, regardless of overall weight, were associated with smaller brain volumes and increased risk of dementia. Alzheimer's disease and abdominal obesity has a strong correlation and with metabolic factors added in, the risk of developing Alzheimer's disease was even higher. Based on logistic regression analyses, it was found that obesity was associated with an almost 10-fold increase risk of Alzheimer's disease.

Other health risks

Central obesity can be a feature of lipodystrophies, a group of diseases that is either inherited, or due to secondary causes (often protease inhibitors, a group of medications against AIDS). Central obesity is a symptom of Cushing's syndrome and is also common in patients with polycystic ovary syndrome (PCOS). Central obesity is associated with glucose intolerance and dyslipidemia. Once dyslipidemia becomes a severe problem, an individual's abdominal cavity would generate elevated free fatty acid flux to the liver. The effect of abdominal adiposity occurs not just in those who are obese, but also affects people who are non-obese and it also contributes to insulin sensitivity.

Ghroubi et al. (2007) examined whether abdominal circumference is a more reliable indicator than BMI of the presence of knee osteoarthritis in obese patients. They found that it actually appears to be a factor linked with the presence of knee pain as well as osteoarthritis in obese study subjects. Ghroubi et al. (2007) concluded that a high abdominal circumference is associated with great functional repercussion.

Causes

Diet

The currently prevalent belief is that the immediate cause of obesity is net energy imbalance—the organism consumes more usable calories than it expends, wastes, or discards through elimination. Some studies indicate that visceral adiposity, together with lipid dysregulation and decreased insulin sensitivity, is related to the excessive consumption of fructose. Some evidence shows that in regards to juveniles, when free fructose is present as children's fat cells mature, it makes more of these cells mature into fat cells in the abdominal region. It also caused both visceral fat and subcutaneous fat to be less sensitive to insulin. These effects were not attenuated when compared to similar glucose consumption.

Intake of trans fat from industrial oils has been associated with increased abdominal obesity in men and increased weight and waist circumference in women. These associations were not attenuated when fat intake and calorie intake was accounted for. Greater meat (processed meat, red meat, & poultry) consumption has also been positively associated with greater weight gain, and specifically abdominal obesity, even when accounting for calories. Conversely, studies suggest that oily fish consumption is negatively associated with total body fat and abdominal fat distribution even when body mass remains constant. Similarly, increased soy protein consumption is correlated with lower amounts of abdominal fat in postmenopausal women even when calorie consumption is controlled.

Numerous large studies have demonstrated that eating ultraprocessed food has a positive dose-dependent relationship with both abdominal obesity and general obesity in both men and women. Consuming a diet rich in unprocessed food and minimally processed food is linked with lower obesity risk, lower waist circumference and less chronic disease. These findings are consistent among American, Canadian, Latin American, British, Australian, French, Spaniard, South Korean, Chinese, and Sub-Saharan African populations.

Obesity plays an important role in the impairment of lipid and carbohydrate metabolism shown in high-carbohydrate diets. It has also been shown that quality protein intake during a 24-hour period and the number of times the essential amino acid threshold of approximately 10 g has been achieved is inversely related to the percentage of central abdominal fat. Quality protein uptake is defined as the ratio of essential amino acids to daily dietary protein.

Visceral fat cells will release their metabolic by-products in the portal circulation, where the blood leads straight to the liver. Thus, the excess of triglycerides and fatty acids created by the visceral fat cells will go into the liver and accumulate there. In the liver, most of it will be stored as fat. This concept is known as 'lipotoxicity'.

Alcohol consumption

A study has shown that alcohol consumption is directly associated with waist circumference and with a higher risk of abdominal obesity in men, but not in women. After controlling for energy under-reporting, which have slightly attenuated these associations, it was observed that increasing alcohol consumption significantly increased the risk of exceeding recommended energy intakes in male participants – but not in the small number of female participants (2.13%) with elevated alcohol consumption, even after establishing a lower number of drinks per day to characterize women as consuming a high quantity of alcohol. Further research is needed to determine whether a significant relationship between alcohol consumption and abdominal obesity exists among women who consume higher amounts of alcohol.

A systemic review and meta-analysis failed to find data pointing towards a dose-dependent relationship between beer intake and general obesity or abdominal obesity at low or moderate intake levels (under∼500 mL/day). However, high beer intake (above ∼4 L/wk) appeared to be associated with a higher degree of abdominal obesity specifically, particularly among men.

Other factors

Other environmental factors, such as maternal smoking, estrogenic compounds in the diet, and endocrine-disrupting chemicals may be important also.

Hypercortisolism, such as in Cushing's syndrome, also leads to central obesity. Many prescription drugs, such as dexamethasone and other steroids, can also have side effects resulting in central obesity, especially in the presence of elevated insulin levels.

The prevalence of abdominal obesity is increasing in Western populations, possibly due to a combination of low physical activity and high-calorie diets, and also in developing countries, where it is associated with the urbanization of populations.

Waist measurement (e.g., for BFP standard) is more prone to errors than measuring height and weight (e.g., for BMI standard). It is recommended to use both standards. BMI will illustrate the best estimate of one's total body fatness, while waist measurement gives an estimate of visceral fat and risk of obesity-related disease.

Diagnosis

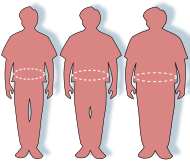
Silhouettes and waist circumferences representing normal, overweight, and obese

There are various ways of measuring abdominal obesity including:

  • Absolute waist circumference (>102 cm (40 in) in men and >88 cm (35 in) in women)
  • Waist–hip ratio (the circumference of the waist divided by that of the hips of >0.9 for men and >0.85 for women)
  • Waist-stature ratio (waist circumference divided by their height, >0.5 for adults under 40 and >0.6 for adults over 50)
  • Sagittal Abdominal Diameter
Overweight teenage boy holding his excess abdominal fat.

In those with a body mass index (BMI) under 35, intra-abdominal body fat is related to negative health outcomes independent of total body fat. Intra-abdominal or visceral fat has a particularly strong correlation with cardiovascular disease.

BMI and waist measurements are well recognized ways to characterize obesity. However, waist measurements are not as accurate as BMI measurements. For this reason, it is recommended to use both methods of measurements.

An adult man with abdominal obesity.

While central obesity can be obvious just by looking at the naked body (see the picture), the severity of central obesity is determined by taking waist and hip measurements. The absolute waist circumference 102 centimetres (40 in) in men and 88 centimetres (35 in) in women and the waist-hip ratio (>0.9 for men and >0.85 for women) are both used as measures of central obesity. A differential diagnosis includes distinguishing central obesity from ascites and intestinal bloating. In the cohort of 15,000 people participating in the National Health and Nutrition Examination Survey (NHANES III), waist circumference explained obesity-related health risk better than BMI when metabolic syndrome was taken as an outcome measure and this difference was statistically significant. In other words, excessive waist circumference appears to be more of a risk factor for metabolic syndrome than BMI. Another measure of central obesity which has shown superiority to BMI in predicting cardiovascular disease risk is the Index of Central Obesity (waist-to-height ratio, WHtR), where a ratio of >=0.5 (i.e. a waist circumference at least half of the individual's height) is predictive of increased risk. Another diagnosis of obesity is the analysis of intra-abdominal fat having the most risk to one's personal health. The increased amount of fat in this region relates to the higher levels of plasma lipid and lipoproteins as per studies mentioned by Eric Poehlman (1998) review. An increasing acceptance of the importance of central obesity within the medical profession as an indicator of health risk has led to new developments in obesity diagnosis such as the Body Volume Index, which measures central obesity by measuring a person's body shape and their weight distribution. The effect of abdominal adiposity occurs not just in those who are obese, but also affects people who are non-obese and it also contributes to insulin sensitivity.

Index of central obesity

Index of Central Obesity (ICO) is the ratio of waist circumference and height first proposed by a Parikh et al. in 2007 as a better substitute to the widely used waist circumference in defining metabolic syndrome. The National Cholesterol Education Program Adult Treatment Panel III suggested cutoff of 102 cm (40 in) and 88 cm (35 in) for males and females as a marker of central obesity. The same was used in defining metabolic syndrome. Misra et al. suggested that these cutoffs are not applicable among Indians and the cutoffs be lowered to 90 cm (35 in) and 80 cm (31 in) for males and females. Various race specific cutoffs were suggested by different groups. The International Diabetes Federation defined central obesity based on these various race and gender specific cutoffs. The other limitation of waist circumference is that it the measurement procedure has not been standardized and in children there are no, or few, comparison standards or reference data.

Parikh et al. looked at the average heights of various races and suggested that by using ICO various race- and gender-specific cutoffs of waist circumference can be discarded. An ICO cutoff of 0.53 was suggested as a criterion to define central obesity. Parikh et al. further tested a modified definition of metabolic syndrome in which waist circumference was replaced with ICO in the National Health and Nutrition Examination Survey (NHANES) database and found the modified definition to be more specific and sensitive.

This parameter has been used in the study of metabolic syndrome and cardiovascular disease.

Central obesity in individuals with normal BMI is referred to as normal weight obesity.

Sex differences

50% of men and 70% of women in the United States between the ages of 50 and 79 years now exceed the waist circumference threshold for central obesity. 

When comparing the body fat of men and women it is seen that men have close to twice the visceral fat as that of pre-menopausal women.

Central obesity is positively associated with coronary heart disease risk in women and men. It has been hypothesized that the sex differences in fat distribution may explain the sex difference in coronary heart disease risk.

There are sex-dependent differences in regional fat distribution. In women, estrogen is believed to cause fat to be stored in the buttocks, thighs, and hips. When women reach menopause and the estrogen produced by ovaries declines, fat migrates from their buttocks, hips, and thighs to their belly.

Males are more susceptible to upper-body fat accumulation, most likely in the belly, due to sex hormone differences. Abdominal obesity in males is correlated with comparatively low testosterone levels. Testosterone administration significantly increased thigh muscle area, reduced subcutaneous fat deposition at all levels measured, but slightly increased the visceral fat area.

Even with the differences, at any given level of central obesity measured as waist circumference or waist to hip ratio, coronary artery disease rates are identical in men and women.

Management

A permanent routine of exercise, eating healthily, and, during periods of being overweight, consuming the same number or fewer calories than used will prevent and help fight obesity. A single pound of fat yields approximately 3500 calories of energy (32 000 kJ energy per kilogram of fat), and weight loss is achieved by reducing energy intake, or increasing energy expenditure, thus achieving a negative balance. Adjunctive therapies which may be prescribed by a physician are orlistat or sibutramine, although the latter has been associated with increased cardiovascular events and strokes and has been withdrawn from the market in the US, the UK, the EU, Australia, Canada, Hong Kong, and Thailand.

A 2006 study published in the International Journal of Sport Nutrition and Exercise Metabolism, suggests that combining cardiovascular (aerobic) exercise with resistance training is more effective than cardiovascular training alone in getting rid of abdominal fat. An additional benefit to exercising is that it reduces stress and insulin levels, which reduce the presence of cortisol, a hormone that leads to more belly fat deposits and leptin resistance.

Self-motivation by understanding the risks associated with abdominal obesity is widely regarded as being far more important than worries about cosmetics. In addition, understanding the health issues linked with abdominal obesity can help in the self-motivation process of losing the abdominal fat. As mentioned above, abdominal fat is linked with cardiovascular disease, diabetes, and cancer. Specifically it's the deepest layer of belly fat (the fat that cannot seen or grabbed) that poses health risks, as these "visceral" fat cells produce hormones that can affect health (e.g. increased insulin resistance and/or breast cancer risk). The risk increases considering the fact that they are located in the proximity or in between organs in the abdominal cavity. For example, fat next to the liver drains into it, causing a fatty liver, which is a risk factor for insulin resistance, setting the stage for type 2 diabetes. However, visceral fat is more responsive to the circulation of catecholamines.

In the presence of type 2 diabetes, the physician might instead prescribe metformin and thiazolidinediones (rosiglitazone or pioglitazone) as antidiabetic drugs rather than sulfonylurea derivatives. Thiazolidinediones may cause slight weight gain but decrease "pathologic" abdominal fat (visceral fat), and therefore may be prescribed for diabetics with central obesity. Thiazolidinedione has been associated with heart failure and increased cardiovascular risk; so it has been withdrawn from the market in Europe by EMA in 2010.

Low-fat diets may not be an effective long-term intervention for obesity: as Bacon and Aphramor wrote, "The majority of individuals regain virtually all of the weight that was lost during treatment." The Women's Health Initiative ("the largest and longest randomized, controlled dietary intervention clinical trial") found that long-term dietary intervention increased the waist circumference of both the intervention group and the control group, though the increase was smaller for the intervention group. The conclusion was that mean weight decreased significantly in the intervention group from baseline to year 1 by 2.2 kg (P<.001) and was 2.2 kg less than the control group change from baseline at year 1. This difference from baseline between control and intervention groups diminished over time, but a significant difference in weight was maintained through year 9, the end of the study.

Society and culture

Myths

There is a common misconception that spot exercise (that is, exercising a specific muscle or location of the body) most effectively burns fat at the desired location, but this is not the case. Spot exercise is beneficial for building specific muscles, but it has little effect, if any, on fat in that area of the body, or on the body's distribution of body fat. The same logic applies to sit-ups and belly fat. Sit-ups, crunches and other abdominal exercises are useful in building the abdominal muscles, but they have little effect, if any, on the adipose tissue located there.

Colloquialisms

A large central adiposity deposit has been assigned many common use names, including; "spare tire", "paunch", and "potbelly". Several colloquial terms used to refer to central obesity, and to people who have it, refer to beer drinking. However, there is little scientific evidence that beer drinkers are more prone to central obesity, despite its being known colloquially as "beer belly", "beer gut", or "beer pot". One of the few studies conducted on the subject did not find that beer drinkers are more prone to central obesity than nondrinkers or drinkers of wine or spirits. Chronic alcoholism can lead to cirrhosis, symptoms of which include gynecomastia (enlarged breasts) and ascites (abdominal fluid). These symptoms can suggest the appearance of central obesity.

Deposits of excess fat at the sides of one's waistline or obliques are commonly referred to as "love handles".

Economics

Researchers in Copenhagen examined the relationship between waist circumferences and costs among 31,840 subjects aged 50–64 years of age with different waist circumferences. Their study showed that an increase in just an additional centimetre above normal waistline caused a 1.25% and 2.08% rise in health care costs in women and men respectively. To put this in perspective, a woman with a waistline of 95 cm (approx 37.4 in) and without underlying health problems or co-morbidities can incur economic costs that are 22%, or US$397, higher per year than a woman with a normal waist circumference.
Water model

From Wikipedia, the free encyclopedia
 
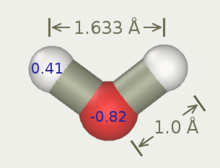
A water model is defined by its geometry, together with other parameters such as the atomic charges and Lennard-Jones parameters.

In computational chemistry, a water model is used to simulate and thermodynamically calculate water clusters, liquid water, and aqueous solutions with explicit solvent. The models are determined from quantum mechanics, molecular mechanics, experimental results, and these combinations. To imitate a specific nature of molecules, many types of models have been developed. In general, these can be classified by the following three points; (i) the number of interaction points called site, (ii) whether the model is rigid or flexible, (iii) whether the model includes polarization effects.

An alternative to the explicit water models is to use an implicit solvation model, also termed a continuum model, an example of which would be the COSMO solvation model or the polarizable continuum model (PCM) or a hybrid solvation model.

Simple water models

The rigid models are considered the simplest water models and rely on non-bonded interactions. In these models, bonding interactions are implicitly treated by holonomic constraints. The electrostatic interaction is modeled using Coulomb's law, and the dispersion and repulsion forces using the Lennard-Jones potential. The potential for models such as TIP3P (transferable intermolecular potential with 3 points) and TIP4P is represented by

where kC, the electrostatic constant, has a value of 332.1 Å·kcal/(mol·e²) in the units commonly used in molecular modeling; qi and qj are the partial charges relative to the charge of the electron; rij is the distance between two atoms or charged sites; and A and B are the Lennard-Jones parameters. The charged sites may be on the atoms or on dummy sites (such as lone pairs). In most water models, the Lennard-Jones term applies only to the interaction between the oxygen atoms.

The figure below shows the general shape of the 3- to 6-site water models. The exact geometric parameters (the OH distance and the HOH angle) vary depending on the model.

Water models.svg

2-site

A 2-site model of water based on the familiar three-site SPC model (see below) has been shown to predict the dielectric properties of water using site-renormalized molecular fluid theory.

3-site

Three-site models have three interaction points corresponding to the three atoms of the water molecule. Each site has a point charge, and the site corresponding to the oxygen atom also has the Lennard-Jones parameters. Since 3-site models achieve a high computational efficiency, these are widely used for many applications of molecular dynamics simulations. Most of the models use a rigid geometry matching that of actual water molecules. An exception is the SPC model, which assumes an ideal tetrahedral shape (HOH angle of 109.47°) instead of the observed angle of 104.5°.

The table below lists the parameters for some 3-site models.


TIPS SPC TIP3P SPC/E
r(OH), Å 0.9572 1.0 0.9572 1.0
HOH, deg 104.52 109.47 104.52 109.47
A, 103 kcal Å12/mol 580.0 629.4 582.0 629.4
B, kcal Å6/mol 525.0 625.5 595.0 625.5
q(O) −0.80 −0.82 −0.834 −0.8476
q(H) +0.40 +0.41 +0.417 +0.4238

The SPC/E model adds an average polarization correction to the potential energy function:

where μ is the electric dipole moment of the effectively polarized water molecule (2.35 D for the SPC/E model), μ0 is the dipole moment of an isolated water molecule (1.85 D from experiment), and αi is an isotropic polarizability constant, with a value of 1.608×10−40 F·m2. Since the charges in the model are constant, this correction just results in adding 1.25 kcal/mol (5.22 kJ/mol) to the total energy. The SPC/E model results in a better density and diffusion constant than the SPC model.

The TIP3P model implemented in the CHARMM force field is a slightly modified version of the original. The difference lies in the Lennard-Jones parameters: unlike TIP3P, the CHARMM version of the model places Lennard-Jones parameters on the hydrogen atoms too, in addition to the one on oxygen. The charges are not modified. Three-site model (TIP3P) has better performance in calculating specific heats.

Flexible SPC water model

Flexible SPC water model

The flexible simple point-charge water model (or flexible SPC water model) is a re-parametrization of the three-site SPC water model. The SPC model is rigid, whilst the flexible SPC model is flexible. In the model of Toukan and Rahman, the O–H stretching is made anharmonic, and thus the dynamical behavior is well described. This is one of the most accurate three-center water models without taking into account the polarization. In molecular dynamics simulations it gives the correct density and dielectric permittivity of water.

Flexible SPC is implemented in the programs MDynaMix and Abalone.

Other models

  • Ferguson (flexible SPC)
  • CVFF (flexible)
  • MG (flexible and dissociative)
  • KKY potential (flexible model).
  • BLXL (smear charged potential).

4-site

The four-site models have four interaction points by adding one dummy atom near of the oxygen along the bisector of the HOH angle of the three-site models (labeled M in the figure). The dummy atom only has a negative charge. This model improves the electrostatic distribution around the water molecule. The first model to use this approach was the Bernal–Fowler model published in 1933, which may also be the earliest water model. However, the BF model doesn't reproduce well the bulk properties of water, such as density and heat of vaporization, and is thus of historical interest only. This is a consequence of the parameterization method; newer models, developed after modern computers became available, were parameterized by running Metropolis Monte Carlo or molecular dynamics simulations and adjusting the parameters until the bulk properties are reproduced well enough.

The TIP4P model, first published in 1983, is widely implemented in computational chemistry software packages and often used for the simulation of biomolecular systems. There have been subsequent reparameterizations of the TIP4P model for specific uses: the TIP4P-Ew model, for use with Ewald summation methods; the TIP4P/Ice, for simulation of solid water ice; and TIP4P/2005, a general parameterization for simulating the entire phase diagram of condensed water.

Most of four-site water models use OH distance and HOH angle matching that of the free water molecule. An exception is OPC model, on which no geometry constraints are imposed other than the fundamental C2v molecular symmetry of the water molecule. Instead, the point charges and their positions are optimized to best describe the electrostatics of the water molecule. OPC reproduces a comprehensive set of bulk properties more accurately than commonly used rigid n-site water models. OPC model is implemented in AMBER force field.


BF TIPS2 TIP4P TIP4P-Ew TIP4P/Ice TIP4P/2005 OPC TIP4P-D
r(OH), Å 0.96 0.9572 0.9572 0.9572 0.9572 0.9572 0.8724 0.9572
HOH, deg 105.7 104.52 104.52 104.52 104.52 104.52 103.6 104.52
r(OM), Å 0.15 0.15 0.15 0.125 0.1577 0.1546 0.1594 0.1546
A, 103 kcal Å12/mol 560.4 695.0 600.0 656.1 857.9 731.3 865.1 904.7
B, kcal Å6/mol 837.0 600.0 610.0 653.5 850.5 736.0 858.1 900.0
q(M) −0.98 −1.07 −1.04 −1.04844 −1.1794 −1.1128 −1.3582 −1.16
q(H) +0.49 +0.535 +0.52 +0.52422 +0.5897 +0.5564 +0.6791 +0.58

Others:

  • q-TIP4P/F (flexible)

5-site

The 5-site models place the negative charge on dummy atoms (labeled L) representing the lone pairs of the oxygen atom, with a tetrahedral-like geometry. An early model of these types was the BNS model of Ben-Naim and Stillinger, proposed in 1971, soon succeeded by the ST2 model of Stillinger and Rahman in 1974. Mainly due to their higher computational cost, five-site models were not developed much until 2000, when the TIP5P model of Mahoney and Jorgensen was published. When compared with earlier models, the TIP5P model results in improvements in the geometry for the water dimer, a more "tetrahedral" water structure that better reproduces the experimental radial distribution functions from neutron diffraction, and the temperature of maximal density of water. The TIP5P-E model is a reparameterization of TIP5P for use with Ewald sums.


BNS ST2 TIP5P TIP5P-E
r(OH), Å 1.0 1.0 0.9572 0.9572
HOH, deg 109.47 109.47 104.52 104.52
r(OL), Å 1.0 0.8 0.70 0.70
LOL, deg 109.47 109.47 109.47 109.47
A, 103 kcal Å12/mol 77.4 238.7 544.5 554.3
B, kcal Å6/mol 153.8 268.9 590.3 628.2
q(L) −0.19562 −0.2357 −0.241 −0.241
q(H) +0.19562 +0.2357 +0.241 +0.241
RL, Å 2.0379 2.0160
RU, Å 3.1877 3.1287

Note, however, that the BNS and ST2 models do not use Coulomb's law directly for the electrostatic terms, but a modified version that is scaled down at short distances by multiplying it by the switching function S(r):

Thus, the RL and RU parameters only apply to BNS and ST2.

6-site

Originally designed to study water/ice systems, a 6-site model that combines all the sites of the 4- and 5-site models was developed by Nada and van der Eerden. Since it had a very high melting temperature when employed under periodic electrostatic conditions (Ewald summation), a modified version was published later optimized by using the Ewald method for estimating the Coulomb interaction.

Other

  • The effect of explicit solute model on solute behavior in biomolecular simulations has been also extensively studied. It was shown that explicit water models affected the specific solvation and dynamics of unfolded peptides, while the conformational behavior and flexibility of folded peptides remained intact.
  • MB model. A more abstract model resembling the Mercedes-Benz logo that reproduces some features of water in two-dimensional systems. It is not used as such for simulations of "real" (i.e., three-dimensional) systems, but it is useful for qualitative studies and for educational purposes.
  • Coarse-grained models. One- and two-site models of water have also been developed. In coarse-grain models, each site can represent several water molecules.
  • Many-body models. Water models built using training-set configurations solved quantum mechanically, which then use machine learning protocols to extract potential-energy surfaces. These potential-energy surfaces are fed into MD simulations for an unprecedented degree of accuracy in computing physical properties of condensed phase systems.
    • Another classification of many body models is on the basis of the expansion of the underlying electrostatics, e.g., the SCME (Single Center Multipole Expansion) model 

Computational cost

The computational cost of a water simulation increases with the number of interaction sites in the water model. The CPU time is approximately proportional to the number of interatomic distances that need to be computed. For the 3-site model, 9 distances are required for each pair of water molecules (every atom of one molecule against every atom of the other molecule, or 3 × 3). For the 4-site model, 10 distances are required (every charged site with every charged site, plus the O–O interaction, or 3 × 3 + 1). For the 5-site model, 17 distances are required (4 × 4 + 1). Finally, for the 6-site model, 26 distances are required (5 × 5 + 1).

When using rigid water models in molecular dynamics, there is an additional cost associated with keeping the structure constrained, using constraint algorithms (although with bond lengths constrained it is often possible to increase the time step).

Diet and obesity

From Wikipedia, the free encyclopedia
 
Map of dietary energy availability per person per day in 1961 (kcal/person/day).
 
Map of dietary energy availability per person per day in 1979-1981 (kcal/person/day).
 
Map of dietary energy availability per person per day in 2001–2003 
 
(kcal/person/day).
  no data
  <1600
  1600-1800
  1800-2000
  2000-2200
  2200-2400
  2400-2600
  2600-2800
  2800-3000
  3000-3200
  3200-3400
  3400-3600
  >3600

Diet plays an important role in the genesis of obesity. Personal choices, food advertising, social customs and cultural influences, as well as food availability and pricing all play a role in determining what and how much an individual eats.

Dietary energy supply

Average per capita energy consumption of the world from 1961 to 2002

The dietary energy supply is the food available for human consumption, usually expressed in kilocalories per person per day. It gives an overestimate of the total amount of food consumed as it reflects both food consumed and food wasted. The per capita dietary energy supply varies markedly between different regions and countries. It has also changed significantly over time. From the early 1970s to the late 1990s, the average calories available per person per day (the amount of food bought) has increased in all part of the world except Eastern Europe and parts of Africa. The United States had the highest availability with 3654 kilo calories per person in 1996. This increased further in 2002 to 3770. During the late 1990s, Europeans had 3394 kilo calories per person, in the developing areas of Asia there were 2648 kilo calories per person, and in sub-Sahara Africa people had 2176 kilo calories per person.

Average calorie consumption

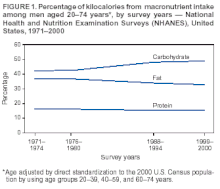
Change over time of the macronutrient composition of the US male diet.
 
Change over time of the macronutrient composition of the US female diet.
 
USDA chart showing the increase in soda consumption and the decrease in milk consumption from 1947 to 2001.

From 1971 – 2000, the average daily number of calories which women consumed in the United States increased by 335 calories per day (1542 calories in 1971 and 1877 calories in 2000). For men, the average increase was 168 calories per day (2450 calories in 1971 and 2618 calories in 2000). Most of these extra calories came from an increase in carbohydrate consumption, though there was also an increase in fat consumption over the same time period. The increase in caloric consumption is attributed primarily to the "consumption of food away from home; increased energy consumption from salty snacks, soft drinks, and pizza; and increased portion sizes". Other sources note that the consumption of soft drinks and other sweetened beverages now accounts for almost 25 percent of daily calories in young adults in America. As these estimates are based on a person's recall, they may underestimate the amount of calories actually consumed.

Fast food

As societies become increasingly reliant on energy-dense fast-food meals, the association between fast food consumption and obesity becomes more concerning. In the United States, consumption of fast food meals has tripled and calorie intake from fast food has quadrupled between 1977 and 1995. Consumption of sweetened drinks is also believed to be a major contributor to the rising rates of obesity.

Portion size

A comparison of a typical cheeseburger 20 years ago (left) which had 333 calories with a modern cheeseburger (right) which contains 590 calories as per the National Heart, Lung, and Blood Institute

The portion size of many prepackage and restaurant foods has increased in both the United States and Denmark since the 1970s. Fast food servings, for example, are 2 to 5 times larger than they were in the 1980s. Evidence has shown that larger portions of energy-dense foods lead to greater energy intake and thus to greater rates of obesity.

Meat consumption

A 2010 study published in the American Journal of Clinical Nutrition closely tracked 373,803 people over a period of 8 years across 10 countries. At its conclusion, the study reported that meat consumption (processed meat, red meat, & poultry) is positively associated with weight gain and increased abdominal obesity in men and women. In response, the National Cattlemen's Beef Association countered that increased meat consumption may not be associated with fat gain. However, a subsequent response controlled for just abdominal fat across a sample of 91,214 people found that even when controlling for calories and lifestyle factors, meat consumption is linked with obesity. Further population studies, reviews, and meta-analysis studies have corroborated the claim that greater meat consumption is linked to greater rates of obesity, especially in regards to red meat and processed meat.

Sugar consumption

Drinking more sugary beverages (including fruit juices, soft drinks, fruit drinks, sports drinks, energy and enhanced water drinks, sweetened iced tea, and lemonade) increases overall energy intake, and thus increases the risk of metabolic syndrome, obesity and type 2 diabetes (see Obesity#Pathophysiology). Children who consume more added sugar in foods and beverages have a higher risk of becoming overweight. By itself, sugar is not a factor causing obesity and metabolic syndrome, but rather – when over-consumed – is a component of unhealthy dietary behavior. Adults who increase or decrease their free sugar intake increase or decrease their weight.

Reviews indicate that governmental health policies should be implemented to discourage intake of sugar-sweetened beverages, and reduce the obesity in children and adults. Obesity has been rising in the 21st century. Other than adding excessive calories, the mechanisms by which high sugar consumption causes obesity are unclear because of limitations in clinical research involving uncontrolled factors, such as overall diet, physical activity, and sedentary lifestyle.

Ultraprocessed food consumption

Numerous large studies have demonstrated that eating ultraprocessed food has a positive dose-dependent relationship with both abdominal obesity and general obesity in both men and women. Consuming a diet rich in unprocessed and minimally processed foods is linked with lower obesity risk and less chronic disease. These results are consistent among American, Canadian, Latin American, British, Australian, French, and Spaniard populations.

Particular processing ingredients used in ultraprocessed foods have been linked with increasing the risk of obesity further. Intake of trans fat from industrial oils has been associated with increased abdominal obesity in men and increased weight and waist circumference in women. These associations were not attenuated when fat intake and calorie intake was accounted for.

Similarly, heavy consumption of fried food is linked to greater obesity risk on a population level. On a more individual level, the relative risk of fried food consumption and increased weight gain seems to depend on genetic predisposition.

Social policy and change

New agricultural technologies have led to an overall reduction in the cost of food relative to household income, especially in high-income countries. In his popular book, "The Omnivore's Dilemma," the journalist Michael Pollan linked the subsidies offered to farmers of corn, soy, wheat, and rice through the U.S. farm bill to over-consumption of calories derived from these crops and to rising obesity rates. While increased consumption of foods derived from these commodities is correlated with an increase in BMI (at the population level), no current research supports a causal relationship between farm subsidies and obesity. From a policy perspective, the cost of sugar would actually decrease in the US if the commodity support programs in the farm bill were removed, largely due to the tariffs in the farm bill that restrict the importation of lower-cost sugar available on the global market.

Participation by adults in the United States Department of Agriculture Supplemental Nutrition Assistance Program (i.e. Food Stamps) is positively associated with obesity, waist circumference, elevated fasting glucose, and metabolic syndrome.

Metabolism

Evidence does not support the commonly expressed view that some obese people eat little yet gain weight due to a slow metabolism. On average obese people have a greater energy expenditure than normal weight or thin people and actually have higher BMRs. This is because it takes more energy to maintain an increased body mass. Obese people also underreport how much food they consume compared to those of normal weight. Tests of human subjects carried out in a calorimeter support this conclusion.

Electromagnetic absorption by water

Absorption spectrum (attenuation coefficient vs. wavelength) of liquid water (red), atmospheric water vapor (green) and ice (blue line) between 667 nm and 200 μm. The plot for vapor is a transformation of data Synthetic spectrum for gas mixture 'Pure H2O' (296K, 1 atm) retrieved from Hitran on the Web Information System.
 
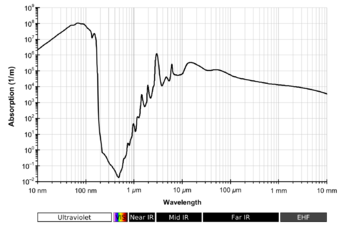
Liquid water absorption spectrum across a wide wavelength range

The absorption of electromagnetic radiation by water depends on the state of the water.

The absorption in the gas phase occurs in three regions of the spectrum. Rotational transitions are responsible for absorption in the microwave and far-infrared, vibrational transitions in the mid-infrared and near-infrared. Vibrational bands have rotational fine structure. Electronic transitions occur in the vacuum ultraviolet regions.

Liquid water has no rotational spectrum but does absorb in the microwave region. Its weak absorption in the visible spectrum results in the pale blue color of water.

Overview

The water molecule, in the gaseous state, has three types of transition that can give rise to absorption of electromagnetic radiation:

  • Rotational transitions, in which the molecule gains a quantum of rotational energy. Atmospheric water vapour at ambient temperature and pressure gives rise to absorption in the far-infrared region of the spectrum, from about 200 cm−1 (50 μm) to longer wavelengths towards the microwave region.
  • Vibrational transitions in which a molecule gains a quantum of vibrational energy. The fundamental transitions give rise to absorption in the mid-infrared in the regions around 1650 cm−1 (μ band, 6 μm) and 3500 cm−1 (so-called X band, 2.9 μm)
  • Electronic transitions in which a molecule is promoted to an excited electronic state. The lowest energy transition of this type is in the vacuum ultraviolet region.

In reality, vibrations of molecules in the gaseous state are accompanied by rotational transitions, giving rise to a vibration-rotation spectrum. Furthermore, vibrational overtones and combination bands occur in the near-infrared region. The HITRAN spectroscopy database lists more than 37,000 spectral lines for gaseous H216O, ranging from the microwave region to the visible spectrum.

In liquid water the rotational transitions are effectively quenched, but absorption bands are affected by hydrogen bonding. In crystalline ice the vibrational spectrum is also affected by hydrogen bonding and there are lattice vibrations causing absorption in the far-infrared. Electronic transitions of gaseous molecules will show both vibrational and rotational fine structure.

Units

Infrared absorption band positions may be given either in wavelength (usually in micrometers, μm) or wavenumber (usually in reciprocal centimeters, cm−1) scale.

Rotational spectrum

Part of the pure rotation absorption spectrum of water vapour
 
Rotating water molecule

The water molecule is an asymmetric top, that is, it has three independent moments of inertia. Rotation about the 2-fold symmetry axis is illustrated at the left. Because of the low symmetry of the molecule, a large number of transitions can be observed in the far infrared region of the spectrum. Measurements of microwave spectra have provided a very precise value for the O−H bond length, 95.84 ± 0.05 pm and H−O−H bond angle, 104.5 ± 0.3°.

Vibrational spectrum

The three fundamental vibrations of the water molecule
ν1,O-H symmetric stretching
3657 cm−1 (2.734 μm)
 
ν2, H-O-H bending
1595 cm−1 (6.269 μm)
 
ν3, O-H asymmetric stretching
3756 cm−1 (2.662 μm)

The water molecule has three fundamental molecular vibrations. The O-H stretching vibrations give rise to absorption bands with band origins at 3657 cm−11, 2.734 μm) and 3756 cm−13, 2.662 μm) in the gas phase. The asymmetric stretching vibration, of B2 symmetry in the point group C2v is a normal vibration. The H-O-H bending mode origin is at 1595 cm−12, 6.269 μm). Both symmetric stretching and bending vibrations have A1 symmetry, but the frequency difference between them is so large that mixing is effectively zero. In the gas phase all three bands show extensive rotational fine structure. In the Near-infrared spectrum ν3 has a series of overtones at wavenumbers somewhat less than n·ν3, n=2,3,4,5... Combination bands, such as ν2 + ν3 are also easily observed in the near-infrared region. The presence of water vapor in the atmosphere is important for atmospheric chemistry especially as the infrared and near infrared spectra are easy to observe. Standard (atmospheric optical) codes are assigned to absorption bands as follows. 0.718 μm (visible): α, 0.810 μm: μ, 0.935 μm: ρστ, 1.13 μm: φ, 1.38 μm: ψ, 1.88 μm: Ω, 2.68 μm: X. The gaps between the bands define the infrared window in the Earth's atmosphere.

The infrared spectrum of liquid water is dominated by the intense absorption due to the fundamental O-H stretching vibrations. Because of the high intensity, very short path lengths, usually less than 50 μm, are needed to record the spectra of aqueous solutions. There is no rotational fine structure, but the absorption bands are broader than might be expected, because of hydrogen bonding. Peak maxima for liquid water are observed at 3450 cm−1 (2.898 μm), 3615 cm−1 (2.766 μm) and 1640 cm −1 (6.097 μm). Direct measurement of the infrared spectra of aqueous solutions requires that the cuvette windows be made of substances such as calcium fluoride which are water-insoluble. This difficulty can alternatively be overcome by using an attenuated total reflectance (ATR) device rather than transmission.

In the near-infrared range liquid water has absorption bands around 1950 nm (5128 cm−1), 1450 nm (6896 cm−1), 1200 nm (8333 cm−1) and 970 nm, (10300 cm−1). The regions between these bands can be used in near-infrared spectroscopy to measure the spectra of aqueous solutions, with the advantage that glass is transparent in this region, so glass cuvettes can be used. The absorption intensity is weaker than for the fundamental vibrations, but this is not important as longer path-length cuvettes can be used. The absorption band at 698 nm (14300 cm−1) is a 3rd overtone (n=4). It tails off onto the visible region and is responsible for the intrinsic blue color of water. This can be observed with a standard UV/vis spectrophotometer, using a 10 cm path-length. The colour can be seen by eye by looking through a column of water about 10 m in length; the water must be passed through an ultrafilter to eliminate color due to Rayleigh scattering which also can make water appear blue.

The spectrum of ice is similar to that of liquid water, with peak maxima at 3400 cm−1 (2.941 μm), 3220 cm−1 (3.105 μm) and 1620 cm−1 (6.17 μm)

In both liquid water and ice clusters, low-frequency vibrations occur, which involve the stretching (TS) or bending (TB) of intermolecular hydrogen bonds (O–H•••O). Bands at wavelengths λ = 50-55 μm or 182-200 cm−1 (44 μm, 227 cm−1 in ice) have been attributed to TS, intermolecular stretch, and 200 μm or 50 cm−1 (166 μm, 60 cm−1 in ice), to TB, intermolecular bend

Visible region

Predicted wavelengths of overtones and combination bands of liquid water in the visible region
ν1, ν3 ν2 wavelength /nm
4 0 742
4 1 662
5 0 605
5 1 550
6 0 514
6 1 474
7 0 449
7 1 418
8 0 401
8 1 376

Absorption coefficients for 200 nm and 900 nm are almost equal at 6.9 m−1 (attenuation length of 14.5 cm). Very weak light absorption, in the visible region, by liquid water has been measured using an integrating cavity absorption meter (ICAM).[16] The absorption was attributed to a sequence of overtone and combination bands whose intensity decreases at each step, giving rise to an absolute minimum at 418 nm, at which wavelength the attenuation coefficient is about 0.0044 m−1, which is an attenuation length of about 227 meters. These values correspond to pure absorption without scattering effects. The attenuation of, e.g., a laser beam would be slightly stronger.

Visible light absorption spectrum of pure water (absorption coefficient vs. wavelength)

Electronic spectrum

The electronic transitions of the water molecule lie in the vacuum ultraviolet region. For water vapor the bands have been assigned as follows.

  • 65 nm band — many different electronic transitions, photoionization, photodissociation
  • discrete features between 115 and 180 nm
    • set of narrow bands between 115 and 125 nm
      Rydberg series: 1b1 (n2) → many different Rydberg states and 3a1 (n1) → 3sa1 Rydberg state
    • 128 nm band
      Rydberg series: 3a1 (n1) → 3sa1 Rydberg state and 1b1 (n2) → 3sa1 Rydberg state
    • 166.5 nm band
      1b1 (n2) → 4a11*-like orbital)
At least some of these transitions result in photodissociation of water into H+OH. Among them the best known is that at 166.5 nm.

Microwaves and radio waves

Dielectric permittivity and dielectric loss of water between 0°C and 100°C, the arrows showing the effect of increasing temperature
 

The pure rotation spectrum of water vapor extends into the microwave region.

Liquid water has a broad absorption spectrum in the microwave region, which has been explained in terms of changes in the hydrogen bond network giving rise to a broad, featureless, microwave spectrum. The absorption (equivalent to dielectric loss) is used in microwave ovens to heat food that contains water molecules. A frequency of 2.45 GHz, wavelength 122 mm, is commonly used.

Radiocommunication at GHz frequencies is very difficult in fresh waters and even more so in salt waters.

Atmospheric effects

Synthetic stick absorption spectrum of a simple gas mixture corresponding to the Earth's atmosphere composition based on HITRAN data created using Hitran on the Web system. Green color - water vapor, WN – wavenumber (caution: lower wavelengths on the right, higher on the left). Water vapor concentration for this gas mixture is 0.4%.

Water vapor is a greenhouse gas in the Earth's atmosphere, responsible for 70% of the known absorption of incoming sunlight, particularly in the infrared region, and about 60% of the atmospheric absorption of thermal radiation by the Earth known as the greenhouse effect. It is also an important factor in multispectral imaging and hyperspectral imaging used in remote sensing because water vapor absorbs radiation differently in different spectral bands. Its effects are also an important consideration in infrared astronomy and radio astronomy in the microwave or millimeter wave bands. The South Pole Telescope was constructed in Antarctica in part because the elevation and low temperatures there mean there is very little water vapor in the atmosphere.

Similarly, carbon dioxide absorption bands occur around 1400, 1600 and 2000 nm, but its presence in the Earth's atmosphere accounts for just 26% of the greenhouse effect. Carbon dioxide gas absorbs energy in some small segments of the thermal infrared spectrum that water vapor misses. This extra absorption within the atmosphere causes the air to warm just a bit more and the warmer the atmosphere the greater its capacity to hold more water vapor. This extra water vapor absorption further enhances the Earth's greenhouse effect.

In the atmospheric window between approximately 8000 and 14000 nm, in the far-infrared spectrum, carbon dioxide and water absorption is weak. This window allows most of the thermal radiation in this band to be radiated out to space directly from the Earth's surface. This band is also used for remote sensing of the Earth from space, for example with thermal Infrared imaging.

As well as absorbing radiation, water vapour occasionally emits radiation in all directions, according to the Black Body Emission curve for its current temperature overlaid on the water absorption spectrum. Much of this energy will be recaptured by other water molecules, but at higher altitudes, radiation sent towards space is less likely to be recaptured, as there is less water available to recapture radiation of water-specific absorbing wavelengths. By the top of the troposphere, about 12 km above sea level, most water vapor condenses to liquid water or ice as it releases its heat of vapourization. Once changed state, liquid water and ice fall away to lower altitudes. This will be balanced by incoming water vapour rising via convection currents.

Liquid water and ice emit radiation at a higher rate than water vapour (see graph above). Water at the top of the troposphere, particularly in liquid and solid states, cools as it emits net photons to space. Neighboring gas molecules other than water (e.g. Nitrogen) are cooled by passing their heat kinetically to the water. This is why temperatures at the top of the troposphere (known as the tropopause) are about -50 degrees Celsius.

Occupy movement

From Wikipedia, the free encyclopedia (Redirected from Oc...