Search This Blog

Thursday, April 28, 2022

Genome-wide association study

From Wikipedia, the free encyclopedia

In genomics, a genome-wide association study (GWA study, or GWAS), also known as whole genome association study (WGA study, or WGAS), is an observational study of a genome-wide set of genetic variants in different individuals to see if any variant is associated with a trait. GWA studies typically focus on associations between single-nucleotide polymorphisms (SNPs) and traits like major human diseases, but can equally be applied to any other genetic variants and any other organisms.

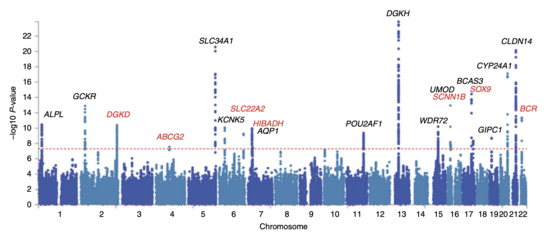
Manhattan plot of a GWAS
An illustration of a Manhattan plot depicting several strongly associated risk loci. Each dot represents a SNP, with the X-axis showing genomic location and Y-axis showing association level. This example is taken from a GWA study investigating kidney stone disease, so the peaks indicate genetic variants that are found more often in individuals with kidney stones.

When applied to human data, GWA studies compare the DNA of participants having varying phenotypes for a particular trait or disease. These participants may be people with a disease (cases) and similar people without the disease (controls), or they may be people with different phenotypes for a particular trait, for example blood pressure. This approach is known as phenotype-first, in which the participants are classified first by their clinical manifestation(s), as opposed to genotype-first. Each person gives a sample of DNA, from which millions of genetic variants are read using SNP arrays. If one type of the variant (one allele) is more frequent in people with the disease, the variant is said to be associated with the disease. The associated SNPs are then considered to mark a region of the human genome that may influence the risk of disease.

GWA studies investigate the entire genome, in contrast to methods that specifically test a small number of pre-specified genetic regions. Hence, GWAS is a non-candidate-driven approach, in contrast to gene-specific candidate-driven studies. GWA studies identify SNPs and other variants in DNA associated with a disease, but they cannot on their own specify which genes are causal.

The first successful GWAS published in 2002 studied myocardial infarction. This study design was then implemented in the landmark GWA 2005 study investigating patients with age-related macular degeneration, and found two SNPs with significantly altered allele frequency compared to healthy controls. As of 2017, over 3,000 human GWA studies have examined over 1,800 diseases and traits, and thousands of SNP associations have been found. Except in the case of rare genetic diseases, these associations are very weak, but while they may not explain much of the risk, they provide insight into genes and pathways that can be important.

Background

GWA studies typically identify common variants with small effect sizes (lower right).

Any two human genomes differ in millions of different ways. There are small variations in the individual nucleotides of the genomes (SNPs) as well as many larger variations, such as deletions, insertions and copy number variations. Any of these may cause alterations in an individual's traits, or phenotype, which can be anything from disease risk to physical properties such as height. Around the year 2000, prior to the introduction of GWA studies, the primary method of investigation was through inheritance studies of genetic linkage in families. This approach had proven highly useful towards single gene disorders. However, for common and complex diseases the results of genetic linkage studies proved hard to reproduce. A suggested alternative to linkage studies was the genetic association study. This study type asks if the allele of a genetic variant is found more often than expected in individuals with the phenotype of interest (e.g. with the disease being studied). Early calculations on statistical power indicated that this approach could be better than linkage studies at detecting weak genetic effects.

In addition to the conceptual framework several additional factors enabled the GWA studies. One was the advent of biobanks, which are repositories of human genetic material that greatly reduced the cost and difficulty of collecting sufficient numbers of biological specimens for study. Another was the International HapMap Project, which, from 2003 identified a majority of the common SNPs interrogated in a GWA study. The haploblock structure identified by HapMap project also allowed the focus on the subset of SNPs that would describe most of the variation. Also the development of the methods to genotype all these SNPs using genotyping arrays was an important prerequisite.

Methods

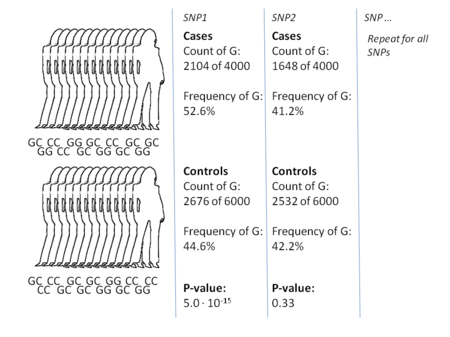
Example calculation illustrating the methodology of a case-control GWA study. The allele count of each measured SNP is evaluated—in this case with a chi-squared test—to identify variants associated with the trait in question. The numbers in this example are taken from a 2007 study of coronary artery disease (CAD) that showed that the individuals with the G-allele of SNP1 (rs1333049) were overrepresented amongst CAD-patients.
 
Illustration of a simulated genotype by phenotype regression for a single SNP. Each dot represents an individual. A GWAS of a continuous trait essentially consists of repeating this analysis at each SNP.

The most common approach of GWA studies is the case-control setup, which compares two large groups of individuals, one healthy control group and one case group affected by a disease. All individuals in each group are genotyped for the majority of common known SNPs. The exact number of SNPs depends on the genotyping technology, but are typically one million or more. For each of these SNPs it is then investigated if the allele frequency is significantly altered between the case and the control group. In such setups, the fundamental unit for reporting effect sizes is the odds ratio. The odds ratio is the ratio of two odds, which in the context of GWA studies are the odds of case for individuals having a specific allele and the odds of case for individuals who do not have that same allele.

Example: suppose that there are two alleles, T and C. The number of individuals in the case group having allele T is represented by 'A' and the number of individuals in the control group having allele T is represented by 'B'. Similarly, the number of individuals in the case group having allele C is represented by 'X' and the number of individuals in the control group having allele C is represented by 'Y'. In this case the odds ratio for allele T is A:B (meaning 'A to B', in standard odds terminology) divided by X:Y, which in mathematical notation is simply (A/B)/(X/Y).

When the allele frequency in the case group is much higher than in the control group, the odds ratio is higher than 1, and vice versa for lower allele frequency. Additionally, a P-value for the significance of the odds ratio is typically calculated using a simple chi-squared test. Finding odds ratios that are significantly different from 1 is the objective of the GWA study because this shows that a SNP is associated with disease. Because so many variants are tested, it is standard practice to require the p-value to be lower than 5×10⁻⁸ to consider a variant significant.

Variations on the case-control approach. A common alternative to case-control GWA studies is the analysis of quantitative phenotypic data, e.g. height or biomarker concentrations or even gene expression. Likewise, alternative statistics designed for dominance or recessive penetrance patterns can be used. Calculations are typically done using bioinformatics software such as SNPTEST and PLINK, which also include support for many of these alternative statistics. GWAS focuses on the effect of individual SNPs. However, it is also possible that complex interactions among two or more SNPs, epistasis, might contribute to complex diseases. Due to the potentially exponential number of interactions, detecting statistically significant interactions in GWAS data is both computationally and statistically challenging. This task has been tackled in existing publications that use algorithms inspired from data mining. Moreover, the researchers try to integrate GWA data with other biological data such as protein-protein interaction network to extract more informative results.

A key step in the majority of GWA studies is the imputation of genotypes at SNPs not on the genotype chip used in the study. This process greatly increases the number of SNPs that can be tested for association, increases the power of the study, and facilitates meta-analysis of GWAS across distinct cohorts. Genotype imputation is carried out by statistical methods that combine the GWAS data together with a reference panel of haplotypes. These methods take advantage of sharing of haplotypes between individuals over short stretches of sequence to impute alleles. Existing software packages for genotype imputation include IMPUTE2, Minimac, Beagle, and MaCH.

In addition to the calculation of association, it is common to take into account any variables that could potentially confound the results. Sex and age are common examples of confounding variables. Moreover, it is also known that many genetic variations are associated with the geographical and historical populations in which the mutations first arose. Because of this association, studies must take account of the geographic and ethnic background of participants by controlling for what is called population stratification. If they fail to do so, these studies can produce false positive results.

After odds ratios and P-values have been calculated for all SNPs, a common approach is to create a Manhattan plot. In the context of GWA studies, this plot shows the negative logarithm of the P-value as a function of genomic location. Thus the SNPs with the most significant association stand out on the plot, usually as stacks of points because of haploblock structure. Importantly, the P-value threshold for significance is corrected for multiple testing issues. The exact threshold varies by study, but the conventional genome-wide significance threshold is 5×10⁻⁸ to be significant in the face of hundreds of thousands to millions of tested SNPs. GWA studies typically perform the first analysis in a discovery cohort, followed by validation of the most significant SNPs in an independent validation cohort.

Results

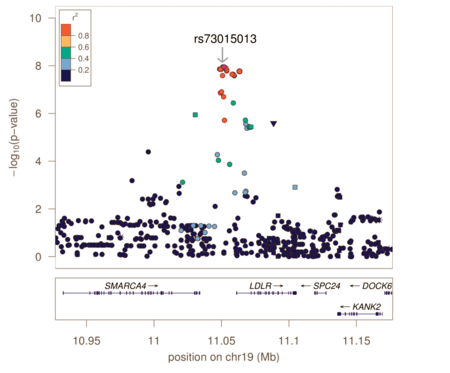
Regional association plot, showing individual SNPs in the LDL receptor region and their association to LDL-cholesterol levels. This type of plot is similar to the Manhattan plot in the lead section, but for a more limited section of the genome. The haploblock structure is visualized with colour scale and the association level is given by the left Y-axis. The dot representing the rs73015013 SNP (in the top-middle) has a high Y-axis location because this SNP explains some of the variation in LDL-cholesterol.
 
Relationship between the minor allele frequency and the effect size of genome wide significant variants in a GWAS of height.

Attempts have been made at creating comprehensive catalogues of SNPs that have been identified from GWA studies. As of 2009, SNPs associated with diseases are numbered in the thousands.

The first GWA study, conducted in 2005, compared 96 patients with age-related macular degeneration (ARMD) with 50 healthy controls. It identified two SNPs with significantly altered allele frequency between the two groups. These SNPs were located in the gene encoding complement factor H, which was an unexpected finding in the research of ARMD. The findings from these first GWA studies have subsequently prompted further functional research towards therapeutical manipulation of the complement system in ARMD.

Another landmark publication in the history of GWA studies was the Wellcome Trust Case Control Consortium (WTCCC) study, the largest GWA study ever conducted at the time of its publication in 2007. The WTCCC included 14,000 cases of seven common diseases (~2,000 individuals for each of coronary heart disease, type 1 diabetes, type 2 diabetes, rheumatoid arthritis, Crohn's disease, bipolar disorder, and hypertension) and 3,000 shared controls. This study was successful in uncovering many new disease genes underlying these diseases.

Since these first landmark GWA studies, there have been two general trends. One has been towards larger and larger sample sizes. In 2018, several genome-wide association studies are reaching a total sample size of over 1 million participants, including 1.1 million in a genome-wide study of educational attainment and a study of insomnia containing 1.3 million individuals. The reason is the drive towards reliably detecting risk-SNPs that have smaller odds ratios and lower allele frequency. Another trend has been towards the use of more narrowly defined phenotypes, such as blood lipids, proinsulin or similar biomarkers. These are called intermediate phenotypes, and their analyses may be of value to functional research into biomarkers.

A variation of GWAS uses participants that are first-degree relatives of people with a disease. This type of study has been named genome-wide association study by proxy (GWAX).

A central point of debate on GWA studies has been that most of the SNP variations found by GWA studies are associated with only a small increased risk of the disease, and have only a small predictive value. The median odds ratio is 1.33 per risk-SNP, with only a few showing odds ratios above 3.0. These magnitudes are considered small because they do not explain much of the heritable variation. This heritable variation is estimated from heritability studies based on monozygotic twins. For example, it is known that 80-90% of variance in height can be explained by hereditary differences, but GWA studies only account for a minority of this variance.

Clinical applications and examples

A challenge for future successful GWA study is to apply the findings in a way that accelerates drug and diagnostics development, including better integration of genetic studies into the drug-development process and a focus on the role of genetic variation in maintaining health as a blueprint for designing new drugs and diagnostics. Several studies have looked into the use of risk-SNP markers as a means of directly improving the accuracy of prognosis. Some have found that the accuracy of prognosis improves, while others report only minor benefits from this use. Generally, a problem with this direct approach is the small magnitudes of the effects observed. A small effect ultimately translates into a poor separation of cases and controls and thus only a small improvement of prognosis accuracy. An alternative application is therefore the potential for GWA studies to elucidate pathophysiology.

Hepatitis C treatment

One such success is related to identifying the genetic variant associated with response to anti-hepatitis C virus treatment. For genotype 1 hepatitis C treated with Pegylated interferon-alpha-2a or Pegylated interferon-alpha-2b combined with ribavirin, a GWA study has shown that SNPs near the human IL28B gene, encoding interferon lambda 3, are associated with significant differences in response to the treatment. A later report demonstrated that the same genetic variants are also associated with the natural clearance of the genotype 1 hepatitis C virus. These major findings facilitated the development of personalized medicine and allowed physicians to customize medical decisions based on the patient's genotype.

eQTL, LDL and cardiovascular disease

The goal of elucidating pathophysiology has also led to increased interest in the association between risk-SNPs and the gene expression of nearby genes, the so-called expression quantitative trait loci (eQTL) studies. The reason is that GWAS studies identify risk-SNPs, but not risk-genes, and specification of genes is one step closer towards actionable drug targets. As a result, major GWA studies by 2011 typically included extensive eQTL analysis. One of the strongest eQTL effects observed for a GWA-identified risk SNP is the SORT1 locus. Functional follow up studies of this locus using small interfering RNA and gene knock-out mice have shed light on the metabolism of low-density lipoproteins, which have important clinical implications for cardiovascular disease.

Atrial fibrillation

For example, a meta-analysis accomplished in 2018 revealed the discovery of 70 new loci associated with atrial fibrillation. It has been identified different variants associated with transcription factor coding-genes, such as TBX3 and TBX5, NKX2-5 o PITX2, which are involved in cardiac conduction regulation, in ionic channel modulation and cardiac development. It was also identified new genes involved in tachycardia (CASQ2) or associated with alteration of cardiac muscle cell communication (PKP2).

Schizophrenia

While there is some research using a High-Precision Protein Interaction Prediction (HiPPIP) computational model that discovered 504 new protein-protein interactions (PPIs) associated with genes linked to schizophrenia, the evidence supporting the genetic basis of schizophrenia is actually controversial and may suffer from some of the limitation of this method of study.

Agricultural applications

Plant growth stages and yield components

GWA studies act as an important tool in plant breeding. With large genotyping and phenotyping data, GWAS are powerful in analyzing complex inheritance modes of traits that are important yield components such as number of grains per spike, weight of each grain and plant structure. In a study on GWAS in spring wheat, GWAS have revealed a strong correlation of grain production with booting data, biomass and number of grains per spike. GWA study is also a success in study genetic architecture of complex traits in rice.

Plant pathogens

The emergences of plant pathogens have posed serious threats to plant health and biodiversity. Under this consideration, identification of wild types that have the natural resistance to certain pathogens could be of vital importance. Furthermore, we need to predict which alleles are associated with the resistance. GWA studies is a powerful tool to detect the relationships of certain variants and the resistance to the plant pathogen, which is beneficial for developing new pathogen-resisted cultivars. 

Chicken

The first GWA study was done by Abasht and Lamont in 2007. This new tool was used to study the fatness trait in F2 population found previously. SNPs they found are on 10 chromosomes (1, 2, 3, 4, 7, 8, 10, 12, 15 and 27).

Limitations

GWA studies have several issues and limitations that can be taken care of through proper quality control and study setup. Lack of well defined case and control groups, insufficient sample size, control for multiple testing and control for population stratification are common problems. Particularly the statistical issue of multiple testing wherein it has been noted that "the GWA approach can be problematic because the massive number of statistical tests performed presents an unprecedented potential for false-positive results". Ignoring these correctible issues has been cited as contributing to a general sense of problems with the GWA methodology. In addition to easily correctible problems such as these, some more subtle but important issues have surfaced. A high-profile GWA study that investigated individuals with very long life spans to identify SNPs associated with longevity is an example of this. The publication came under scrutiny because of a discrepancy between the type of genotyping array in the case and control group, which caused several SNPs to be falsely highlighted as associated with longevity. The study was subsequently retracted, but a modified manuscript was later published.

In addition to these preventable issues, GWA studies have attracted more fundamental criticism, mainly because of their assumption that common genetic variation plays a large role in explaining the heritable variation of common disease. Indeed, it has been estimated that for most conditions the SNP heritability attributable to common SNPs is <0.05. This aspect of GWA studies has attracted the criticism that, although it could not have been known prospectively, GWA studies were ultimately not worth the expenditure. GWA studies also face criticism that the broad variation of individual responses or compensatory mechanisms to a disease state cancel out and mask potential genes or causal variants associated with the disease. Additionally, GWA studies identify candidate risk variants for the population from which their analysis is performed, and with most GWA studies stemming from European databases, there is a lack of translation of the identified risk variants to other non-European populations. Alternative strategies suggested involve linkage analysis. More recently, the rapidly decreasing price of complete genome sequencing have also provided a realistic alternative to genotyping array-based GWA studies. It can be discussed if the use of this new technique is still referred to as a GWA study, but high-throughput sequencing does have potential to side-step some of the shortcomings of non-sequencing GWA.

Fine-mapping

Genotyping arrays designed for GWAS rely on linkage disequilibrium to provide coverage of the entire genome by genotyping a subset of variants. Because of this, the reported associated variants are unlikely to be the actual causal variants. Associated regions can contain hundreds of variants spanning large regions and encompassing many different genes, making the biological interpretation of GWAS loci more difficult. Fine-mapping is a process to refine these lists of associated variants to a credible set most likely to include the causal variant.

Fine-mapping requires all variants in the associated region to have been genotyped or imputed (dense coverage), very stringent quality control resulting in high-quality genotypes, and large sample sizes sufficient in separating out highly correlated signals. There are several different methods to perform fine-mapping, and all methods produce a posterior probability that a variant in that locus is causal. Because the requirements are often difficult to satisfy, there are still limited examples of these methods being more generally applied.
Wednesday, April 27, 2022

Voyager program

From Wikipedia, the free encyclopedia

Montage of planets and some moons that the two Voyager spacecraft have visited and studied, along with the artwork of the spacecraft themselves. The long antenna that extends out from the spacecraft and magnetometer boom can be seen. The planets shown include Jupiter, Saturn, Uranus, and Neptune. Only Jupiter and Saturn have been visited by spacecraft other than Voyager 2.

The Voyager program is an American scientific program that employs two robotic interstellar probes, Voyager 1 and Voyager 2. They were launched in 1977 to take advantage of a favorable alignment of Jupiter and Saturn, to fly near them while collecting data for transmission back to Earth. After launch the decision was taken to send Voyager 2 near Uranus and Neptune to collect data for transmission back to Earth.

As of 2022, the Voyagers are still in operation past the outer boundary of the heliosphere in interstellar space. They collect and transmit useful data to Earth.

Voyager did things no one predicted, found scenes no one expected, and promises to outlive its inventors. Like a great painting or an abiding institution, it has acquired an existence of its own, a destiny beyond the grasp of its handlers.

— Stephen J. Pyne

As of 2022, Voyager 1 was moving with a velocity of 61,185 kilometers per hour (38,019 mph), or 17 km/s, relative to the Sun, and was 23,252,000,000 kilometers (1.4448×10¹⁰ mi) from the Sun reaching a distance of 155.8 AU (23.3 billion km; 14.5 billion mi) from Earth as of February 10, 2022. On 25 August 2012, data from Voyager 1 indicated that it had entered interstellar space.

As of 2022, Voyager 2 was moving with a velocity of 55,335 kilometers per hour (34,384 mph), or 15 km/s, relative to the Sun, and was 19,350,000,000 kilometers (1.202×10¹⁰ mi) from the Sun reaching a distance of 130.1 AU (19.5 billion km; 12.1 billion mi) from Earth as of February 10, 2022. On 5 November 2019, data from Voyager 2 indicated that it also had entered interstellar space. On 4 November 2019, scientists reported that, on 5 November 2018, the Voyager 2 probe had officially reached the interstellar medium (ISM), a region of outer space beyond the influence of the solar wind, as did Voyager 1 in 2012.

Although the Voyagers have moved beyond the influence of the solar wind, they still have a long way to go before exiting the Solar System. NASA indicates "[I]f we define our solar system as the Sun and everything that primarily orbits the Sun, Voyager 1 will remain within the confines of the solar system until it emerges from the Oort cloud in another 14,000 to 28,000 years."

Data and photographs collected by the Voyagers' cameras, magnetometers and other instruments revealed unknown details about each of the four giant planets and their moons. Close-up images from the spacecraft charted Jupiter's complex cloud forms, winds and storm systems and discovered volcanic activity on its moon Io. Saturn's rings were found to have enigmatic braids, kinks and spokes and to be accompanied by myriad "ringlets".

At Uranus, Voyager 2 discovered a substantial magnetic field around the planet and ten more moons. Its flyby of Neptune uncovered three rings and six hitherto unknown moons, a planetary magnetic field and complex, widely distributed auroras. As of 2021 Voyager 2 is the only spacecraft to have visited the ice giants Uranus and Neptune.

In August 2018, NASA confirmed, based on results by the New Horizons spacecraft, the existence of a "hydrogen wall" at the outer edges of the Solar System that was first detected in 1992 by the two Voyager spacecraft.

The Voyager spacecraft were built at the Jet Propulsion Laboratory in Southern California and funded by the National Aeronautics and Space Administration (NASA), which also financed their launches from Cape Canaveral, Florida, their tracking and everything else concerning the probes.

The cost of the original program was $865 million, with the later-added Voyager Interstellar Mission costing an extra $30 million.

History

Trajectories and expected locations of the Pioneer and Voyager spacecraft in April 2007
 
The trajectories that enabled the Voyager spacecraft to visit the outer planets and achieve velocity to escape the Solar System
 
Plot of Voyager 2's heliocentric velocity against its distance from the Sun, illustrating the use of gravity assist to accelerate the spacecraft by Jupiter, Saturn and Uranus. To observe Triton, Voyager 2 passed over Neptune's north pole, resulting in an acceleration out of the plane of the ecliptic and reduced its velocity away from the Sun.

The two Voyager space probes were originally conceived as part of the Mariner program, and they were thus initially named Mariner 11 and Mariner 12. They were then moved into a separate program named "Mariner Jupiter-Saturn", later renamed the Voyager Program because it was thought that the design of the two space probes had progressed sufficiently beyond that of the Mariner family to merit a separate name.

Interactive 3D model of the Voyager spacecraft

The Voyager Program was similar to the Planetary Grand Tour planned during the late 1960s and early 70s. The Grand Tour would take advantage of an alignment of the outer planets discovered by Gary Flandro, an aerospace engineer at the Jet Propulsion Laboratory. This alignment, which occurs once every 175 years, would occur in the late 1970s and make it possible to use gravitational assists to explore Jupiter, Saturn, Uranus, Neptune, and Pluto. The Planetary Grand Tour was to send several pairs of probes to fly by all the outer planets (including Pluto, then still considered a planet) along various trajectories, including Jupiter-Saturn-Pluto and Jupiter-Uranus-Neptune. Limited funding ended the Grand Tour program, but elements were incorporated into the Voyager Program, which fulfilled many of the flyby objectives of the Grand Tour except a visit to Pluto.

Voyager 2 was the first to be launched. Its trajectory was designed to allow flybys of Jupiter, Saturn, Uranus, and Neptune. Voyager 1 was launched after Voyager 2, but along a shorter and faster trajectory that was designed to provide an optimal flyby of Saturn's moon Titan, which was known to be quite large and to possess a dense atmosphere. This encounter sent Voyager 1 out of the plane of the ecliptic, ending its planetary science mission. Had Voyager 1 been unable to perform the Titan flyby, the trajectory of Voyager 2 could have been altered to explore Titan, forgoing any visit to Uranus and Neptune. Voyager 1 was not launched on a trajectory that would have allowed it to continue to Uranus and Neptune, but could have continued from Saturn to Pluto without exploring Titan.

During the 1990s, Voyager 1 overtook the slower deep-space probes Pioneer 10 and Pioneer 11 to become the most distant human-made object from Earth, a record that it will keep for the foreseeable future. The New Horizons probe, which had a higher launch velocity than Voyager 1, is travelling more slowly due to the extra speed Voyager 1 gained from its flybys of Jupiter and Saturn. Voyager 1 and Pioneer 10 are the most widely separated human-made objects anywhere since they are travelling in roughly opposite directions from the Solar System.

In December 2004, Voyager 1 crossed the termination shock, where the solar wind is slowed to subsonic speed, and entered the heliosheath, where the solar wind is compressed and made turbulent due to interactions with the interstellar medium. On 10 December 2007, Voyager 2 also reached the termination shock, about 1.6 billion kilometres (1 billion miles) closer to the Sun than from where Voyager 1 first crossed it, indicating that the Solar System is asymmetrical.

In 2010 Voyager 1 reported that the outward velocity of the solar wind had dropped to zero, and scientists predicted it was nearing interstellar space. In 2011, data from the Voyagers determined that the heliosheath is not smooth, but filled with giant magnetic bubbles, theorized to form when the magnetic field of the Sun becomes warped at the edge of the Solar System.

In June 2012, Scientists at NASA reported that Voyager 1 was very close to entering interstellar space, indicated by a sharp rise in high-energy particles from outside the Solar System. In September 2013, NASA announced that Voyager 1 had crossed the heliopause on 25 August 2012, making it the first spacecraft to enter interstellar space.

In December 2018, NASA announced that Voyager 2 had crossed the heliopause on 5 November 2018, making it the second spacecraft to enter interstellar space.

As of 2017 Voyager 1 and Voyager 2 continue to monitor conditions in the outer expanses of the Solar System. The Voyager spacecraft are expected to be able to operate science instruments through 2020, when limited power will require instruments to be deactivated one by one. Sometime around 2025, there will no longer be sufficient power to operate any science instruments.

In July 2019, a revised power management plan was implemented to better manage the two probes' dwindling power supply.

Spacecraft design

The Voyager spacecraft each weigh 773 kilograms (1,704 pounds). Of this total weight, each spacecraft carries 105 kilograms (231 pounds) of scientific instruments. The identical Voyager spacecraft use three-axis-stabilized guidance systems that use gyroscopic and accelerometer inputs to their attitude control computers to point their high-gain antennas towards the Earth and their scientific instruments towards their targets, sometimes with the help of a movable instrument platform for the smaller instruments and the electronic photography system.

A space probe with squat cylindrical body topped by a large parabolic radio antenna dish pointing left, a three-element radioisotope thermoelectric generator on a boom extending down, and scientific instruments on a boom extending up. A disk is fixed to the body facing front left. A long triaxial boom extends down left and two radio antennas extend down left and down right.
Voyager spacecraft diagram

The diagram shows the high-gain antenna (HGA) with a 3.7 m (12 ft) diameter dish attached to the hollow decagonal electronics container. There is also a spherical tank that contains the hydrazine monopropellant fuel.

The Voyager Golden Record is attached to one of the bus sides. The angled square panel to the right is the optical calibration target and excess heat radiator. The three radioisotope thermoelectric generators (RTGs) are mounted end-to-end on the lower boom.

The scan platform comprises: the Infrared Interferometer Spectrometer (IRIS) (largest camera at top right); the Ultraviolet Spectrometer (UVS) just above the IRIS; the two Imaging Science Subsystem (ISS) vidicon cameras to the left of the UVS; and the Photopolarimeter System (PPS) under the ISS.

Only five investigation teams are still supported, though data is collected for two additional instruments. The Flight Data Subsystem (FDS) and a single eight-track digital tape recorder (DTR) provide the data handling functions.

The FDS configures each instrument and controls instrument operations. It also collects engineering and science data and formats the data for transmission. The DTR is used to record high-rate Plasma Wave Subsystem (PWS) data. The data are played back every six months.

The Imaging Science Subsystem made up of a wide-angle and a narrow-angle camera is a modified version of the slow scan vidicon camera designs that were used in the earlier Mariner flights. The Imaging Science Subsystem consists of two television-type cameras, each with eight filters in a commandable filter wheel mounted in front of the vidicons. One has a low resolution 200 mm (7.9 in) focal length wide-angle lens with an aperture of f/3 (the wide-angle camera), while the other uses a higher resolution 1,500 mm (59 in) narrow-angle f/8.5 lens (the narrow-angle camera).

Computers and data processing

There are three different computer types on the Voyager spacecraft, two of each kind, sometimes used for redundancy. They are proprietary, custom-built computers built from CMOS and TTL medium scale integrated circuits and discrete components. Total number of words among the six computers is about 32K. Voyager 1 and Voyager 2 have identical computer systems.

The Computer Command System (CCS), the central controller of the spacecraft, is two 18-bit word, interrupt type processors with 4096 words each of non-volatile plated wire memory. During most of the Voyager mission the two CCS computers on each spacecraft were used non-redundantly to increase the command and processing capability of the spacecraft. The CCS is nearly identical to the system flown on the Viking spacecraft.

The Flight Data System (FDS) is two 16-bit word machines with modular memories and 8198 words each.

The Attitude and Articulation Control System (AACS) is two 18-bit word machines with 4096 words each.

Unlike the other on-board instruments, the operation of the cameras for visible light is not autonomous, but rather it is controlled by an imaging parameter table contained in one of the on-board digital computers, the Flight Data Subsystem (FDS). More recent space probes, since about 1990, usually have completely autonomous cameras.

The computer command subsystem (CCS) controls the cameras. The CCS contains fixed computer programs such as command decoding, fault detection, and correction routines, antenna pointing routines, and spacecraft sequencing routines. This computer is an improved version of the one that was used in the Viking orbiter. The hardware in both custom-built CCS subsystems in the Voyagers is identical. There is only a minor software modification for one of them that has a scientific subsystem that the other lacks.

The Attitude and Articulation Control Subsystem (AACS) controls the spacecraft orientation (its attitude). It keeps the high-gain antenna pointing towards the Earth, controls attitude changes, and points the scan platform. The custom-built AACS systems on both craft are identical.

It has been erroneously reported on the Internet that the Voyager space probes were controlled by a version of the RCA 1802 (RCA CDP1802 "COSMAC" microprocessor), but such claims are not supported by the primary design documents. The CDP1802 microprocessor was used later in the Galileo space probe, which was designed and built years later. The digital control electronics of the Voyagers were not based on a microprocessor integrated circuit chip.

Communications

The uplink communications are executed via S-band microwave communications. The downlink communications are carried out by an X-band microwave transmitter on board the spacecraft, with an S-band transmitter as a back-up. All long-range communications to and from the two Voyagers have been carried out using their 3.7-meter (12 ft) high-gain antennas. The high-gain antenna has a beamwidth of 0.5° for X-band, and 2.3° for S-band. (The low-gain antenna has a 7 dB gain and 60° beamwidth.)

Because of the inverse-square law in radio communications, the digital data rates used in the downlinks from the Voyagers have been continually decreasing the farther that they get from the Earth. For example, the data rate used from Jupiter was about 115,000 bits per second. That was halved at the distance of Saturn, and it has gone down continually since then. Some measures were taken on the ground along the way to reduce the effects of the inverse-square law. In between 1982 and 1985, the diameters of the three main parabolic dish antennas of the Deep Space Network were increased from 64 to 70 m (210 to 230 ft) dramatically increasing their areas for gathering weak microwave signals.

Whilst the craft were between Saturn and Uranus the onboard software was upgraded to do a degree of image compression and to use a more efficient Reed-Solomon error-correcting encoding.

RTGs for the Voyager program

Then between 1986 and 1989, new techniques were brought into play to combine the signals from multiple antennas on the ground into one, more powerful signal, in a kind of an antenna array. This was done at Goldstone, California, Canberra, and Madrid using the additional dish antennas available there. Also, in Australia, the Parkes Radio Telescope was brought into the array in time for the fly-by of Neptune in 1989. In the United States, the Very Large Array in New Mexico was brought into temporary use along with the antennas of the Deep Space Network at Goldstone. Using this new technology of antenna arrays helped to compensate for the immense radio distance from Neptune to the Earth.

Power

Electrical power is supplied by three MHW-RTG radioisotope thermoelectric generators (RTGs). They are powered by plutonium-238 (distinct from the Pu-239 isotope used in nuclear weapons) and provided approximately 470 W at 30 volts DC when the spacecraft was launched. Plutonium-238 decays with a half-life of 87.74 years, so RTGs using Pu-238 will lose a factor of 1−0.5(1/87.74) = 0.79% of their power output per year.

In 2011, 34 years after launch, the thermal power generated by such an RTG would be reduced to (1/2)(34/87.74) ≈ 76% of its initial power. The RTG thermocouples, which convert thermal power into electricity, also degrade over time reducing available electric power below this calculated level.

By 7 October 2011 the power generated by Voyager 1 and Voyager 2 had dropped to 267.9 W and 269.2 W respectively, about 57% of the power at launch. The level of power output was better than pre-launch predictions based on a conservative thermocouple degradation model. As the electrical power decreases, spacecraft loads must be turned off, eliminating some capabilities. There may be insufficient power for communications by 2032.

Voyager Interstellar Mission

Voyager 1 crossed the heliopause, or the edge of the heliosphere, in August 2012.
Voyager 2 crossed the heliosheath in November 2018.

The Voyager primary mission was completed in 1989, with the close flyby of Neptune by Voyager 2. The Voyager Interstellar Mission (VIM) is a mission extension, which began when the two spacecraft had already been in flight for over 12 years. The Heliophysics Division of the NASA Science Mission Directorate conducted a Heliophysics Senior Review in 2008. The panel found that the VIM "is a mission that is absolutely imperative to continue" and that VIM "funding near the optimal level and increased DSN (Deep Space Network) support is warranted."

The main objective of the VIM is to extend the exploration of the Solar System beyond the outer planets to the outer limit and if possible even beyond. The Voyagers continue to search for the heliopause boundary which is the outer limit of the Sun's magnetic field. Passing through the heliopause boundary will allow the spacecraft to make measurements of the interstellar fields, particles and waves unaffected by the solar wind.

The entire Voyager 2 scan platform, including all of the platform instruments, was switched off in 1998. All platform instruments on Voyager 1, except for the ultraviolet spectrometer (UVS) have also been switched off.

The Voyager 1 scan platform was scheduled to go off-line in late 2000 but has been left on to investigate UV emission from the upwind direction. UVS data are still captured but scans are no longer possible.

Gyro operations ended in 2016 for Voyager 2 and in 2017 for Voyager 1. Gyro operations are used to rotate the probe 360 degrees six times per year to measure the magnetic field of the spacecraft, which is then subtracted from the magnetometer science data.

The two spacecraft continue to operate, with some loss in subsystem redundancy but retain the capability to return scientific data from a full complement of Voyager Interstellar Mission (VIM) science instruments.

Both spacecraft also have adequate electrical power and attitude control propellant to continue operating until around 2025, after which there may not be electrical power to support science instrument operation; science data return and spacecraft operations will cease.

Mission details

This diagram about the heliosphere was released on 28 June 2013 and incorporates results from the Voyager spacecraft.

By the start of VIM, Voyager 1 was at a distance of 40 AU from the Earth while Voyager 2 was at 31 AU. VIM is in three phases: termination shock, heliosheath exploration, and interstellar exploration phase. The spacecraft began VIM in an environment controlled by the Sun's magnetic field with the plasma particles being dominated by those contained in the expanding supersonic solar wind. This is the characteristic environment of the termination shock phase. At some distance from the Sun, the supersonic solar wind will be held back from further expansion by the interstellar wind. The first feature encountered by a spacecraft as a result of this interstellar wind–solar wind interaction was the termination shock where the solar wind slows to subsonic speed and large changes in plasma flow direction and magnetic field orientation occur.

Voyager 1 completed the phase of termination shock in December 2004 at a distance of 94 AU while Voyager 2 completed it in August 2007 at a distance of 84 AU. After entering into the heliosheath the spacecraft are in an area that is dominated by the Sun's magnetic field and solar wind particles. After passing through the heliosheath the two Voyagers will begin the phase of interstellar exploration.

The outer boundary of the heliosheath is called the heliopause, which is where the spacecraft are headed now. This is the region where the Sun's influence begins to decrease and interstellar space can be detected. Voyager 1 is escaping the Solar System at the speed of 3.6 AU per year 35° north of the ecliptic in the general direction of the solar apex in Hercules, while Voyager 2's speed is about 3.3 AU per year, heading 48° south of the ecliptic. The Voyager spacecraft will eventually go on to the stars. In about 40,000 years, Voyager 1 will be within 1.6 light years (ly) of AC+79 3888, also known as Gliese 445, which is approaching the Sun. In 40,000 years Voyager 2 will be within 1.7 ly of Ross 248 (another star which is approaching the Sun) and in 296,000 years it will pass within 4.6 ly of Sirius which is the brightest star in the night sky.

The spacecraft are not expected to collide with a star for 1 sextillion (1020) years.

In October 2020, astronomers reported a significant unexpected increase in density in the space beyond the Solar System as detected by the Voyager 1 and Voyager 2 space probes. According to the researchers, this implies that "the density gradient is a large-scale feature of the VLISM (very local interstellar medium) in the general direction of the heliospheric nose".

Telemetry

The telemetry comes to the telemetry modulation unit (TMU) separately as a "low-rate" 40-bit-per-second (bit/s) channel and a "high-rate" channel.

Low rate telemetry is routed through the TMU such that it can only be downlinked as uncoded bits (in other words there is no error correction). At high rate, one of a set of rates between 10 bit/s and 115.2 kbit/s is downlinked as coded symbols.

Seen from 6 billion kilometers (3.7 billion miles), Earth appears as a "pale blue dot" (the blueish-white speck approximately halfway down the light band to the right).

The TMU encodes the high rate data stream with a convolutional code having constraint length of 7 with a symbol rate equal to twice the bit rate (k=7, r=1/2)

Voyager telemetry operates at these transmission rates:

  • 7200, 1400 bit/s tape recorder playbacks
  • 600 bit/s real-time fields, particles, and waves; full UVS; engineering
  • 160 bit/s real-time fields, particles, and waves; UVS subset; engineering
  • 40 bit/s real-time engineering data, no science data.

Note: At 160 and 600 bit/s different data types are interleaved.

The Voyager craft have three different telemetry formats:

High rate

  • CR-5T (ISA 35395) Science, note that this can contain some engineering data.
  • FD-12 higher accuracy (and time resolution) Engineering data, note that some science data may also be encoded.

Low rate

  • EL-40 Engineering, note that this format can contain some science data, but not all systems represented.
    This is an abbreviated format, with data truncation for some subsystems.

It is understood that there is substantial overlap of EL-40 and CR-5T (ISA 35395) telemetry, but the simpler EL-40 data does not have the resolution of the CR-5T telemetry. At least when it comes to representing available electricity to subsystems, EL-40 only transmits in integer increments—so similar behaviors are expected elsewhere.

Memory dumps are available in both engineering formats. These routine diagnostic procedures have detected and corrected intermittent memory bit flip problems, as well as detecting the permanent bit flip problem that caused a two-week data loss event mid-2010.

The cover of the golden record

Voyager Golden Record

Both spacecraft carry a 12-inch (30 cm) golden phonograph record that contains pictures and sounds of Earth, symbolic directions on the cover for playing the record, and data detailing the location of Earth. The record is intended as a combination time capsule and an interstellar message to any civilization, alien or far-future human, that may recover either of the Voyagers. The contents of this record were selected by a committee that included Timothy Ferris and was chaired by Carl Sagan.

Pale Blue Dot

The Voyager program's discoveries during the primary phase of its mission, including new close-up color photos of the major planets, were regularly documented by print and electronic media outlets. Among the best-known of these is an image of the Earth as a Pale Blue Dot, taken in 1990 by Voyager 1, and popularized by Carl Sagan,

Consider again that dot. That's here. That's home. That's us....The Earth is a very small stage in a vast cosmic arena.... To my mind, there is perhaps no better demonstration of the folly of human conceits than this distant image of our tiny world. To me, it underscores our responsibility to deal more kindly and compassionately with one another and to preserve and cherish that pale blue dot, the only home we've ever known.

Exploration

From Wikipedia, the free encyclopedia

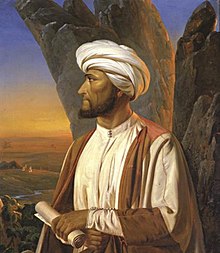
Professor G. A. Wallin (1811–1852), a Finnish explorer and orientalist, who is remembered for his journeys to the Middle East during the 1840s. Portrait of Wallin by R. W. Ekman, 1853.

Exploration is the act of searching for the purpose of discovery of information or resources, especially in the context of geography or space, rather than research and development that is usually not centred on earth sciences or astronomy. Exploration occurs in all non-sessile animal species, including humans. In human history, its most dramatic rise was during the Age of Discovery when European explorers sailed and charted much of the rest of the world for a variety of reasons. Since then, major explorations after the Age of Discovery have occurred for reasons mostly aimed at information discovery.

Concept

Exploration (like science more generally), particularly its understanding and use has been critically discussed as historically being framed and used, at the latest since the Age of Discovery up to the contemporary age of space exploration, for colonialistic ventures, discrimination and exploitation, by reinvigorating concepts such as the "frontier" (as in frontierism) and manifest destiny.

Notable historical periods of human exploration

Phoenician galley sailings

The Phoenicians (1550 BCE–300 BCE) traded throughout the Mediterranean Sea and Asia Minor though many of their routes are still unknown today. The presence of tin in some Phoenician artifacts suggests that they may have traveled to Britain. According to Virgil's Aeneid and other ancient sources, the legendary Queen Dido was a Phoenician from Tyre who sailed to North Africa and founded the city of Carthage.

Carthaginean exploration of Western Africa

Hanno the Navigator (500 BC), a Carthaginean navigator who explored the Western Coast of Africa.

Greek & Roman exploration of Northern Europe and Thule

Roman explorations

Africa Exploration

The Romans organized expeditions to cross the Sahara desert with five different routes:

All these expeditions were supported by legionaries and had mainly a commercial purpose. Only the one done by emperor Nero seemed to be a preparative for the conquest of Ethiopia or Nubia: in 62 AD two legionaries explored the sources of the Nile river.

One of the main reasons of the explorations was to get gold using the camel to transport it.

The explorations near the African western and eastern coasts were supported by Roman ships and deeply related to the naval commerce (mainly toward the Indian Ocean). The Romans also organized several explorations into Northern Europe, and explored as far as China in Asia.

30 BC-640 AD
With the acquisition of Ptolemaic Egypt, the Romans begin trading with India. The Romans now have a direct connection to the spice trade, which the Egyptians had established beginning in 118 BC.
100 AD-166 AD
Sino-Roman relations begin. Ptolemy writes of the Golden Chersonese (i.e. Malay Peninsula) and the trade port of Kattigara, now identified as Óc Eo in northern Vietnam, then part of Jiaozhou, a province of the Chinese Han Empire. The Chinese historical texts describe Roman embassies, from a land they called Daqin.
2nd century
Roman traders reach Siam, Cambodia, Sumatra, and Java.
161
An embassy from Roman Emperor Antoninus Pius or his successor Marcus Aurelius reaches Chinese Emperor Huan of Han at Luoyang.
226
A Roman diplomat or merchant lands in northern Vietnam and visits Nanjing, China and the court of Sun Quan, ruler of Eastern Wu

Chinese exploration of Central Asia

During the 2nd century BC, the Han dynasty explored much of the Eastern Northern Hemisphere. Starting in 139 BC, the Han diplomat Zhang Qian traveled west in an unsuccessful attempt to secure an alliance with the Da Yuezhi against the Xiongnu (the Yuezhi had been evicted from Gansu by the Xiongnu in 177 BC); however, Zhang's travels discovered entire countries which the Chinese were unaware of, including the remnants of the conquests of Alexander the Great (r. 336–323 BC). When Zhang returned to China in 125 BC, he reported on his visits to Dayuan (Fergana), Kangju (Sogdia), and Daxia (Bactria, formerly the Greco-Bactrian Kingdom which had just been subjugated by the Da Yuezhi). Zhang described Dayuan and Daxia as agricultural and urban countries like China, and although he did not venture there, described Shendu (the Indus River valley of Northwestern India) and Anxi (Parthian territories) further west.

Viking Age

Viking settlements and voyages

From about 800 AD to 1040 AD, the Vikings explored Iceland and much of the Western Northern Hemisphere via rivers and oceans. For example, it is known that the Norwegian Viking explorer, Erik the Red (950–1003), sailed to and settled in Greenland after being expelled from Iceland, while his son, the Icelandic explorer Leif Erikson (980–1020), reached Newfoundland and the nearby North American coast, and is believed to be the first European to land in North America.

Polynesian Age

Austronesian expansion map

Polynesians were a maritime people, who populated and explored the central and south Pacific for around 5,000 years, up to about 1280 when they discovered New Zealand. The key invention to their exploration was the outrigger canoe, which provided a swift and stable platform for carrying goods and people. Based on limited evidence, it is thought that the voyage to New Zealand was deliberate. It is unknown if one or more boats went to New Zealand, or the type of boat, or the names of those who migrated. 2011 studies at Wairau Bar in New Zealand show a high probability that one origin was Ruahine Island in the Society Islands. Polynesians may have used the prevailing north easterly trade winds to reach New Zealand in about three weeks. The Cook Islands are in direct line along the migration path and may have been an intermediate stopping point. There are cultural and language similarities between Cook Islanders and New Zealand Māori. Early Māori had different legends of their origins, but the stories were misunderstood and reinterpreted in confused written accounts by early European historians in New Zealand trying to present a coherent pattern of Māori settlement in New Zealand.

Mathematical modelling based on DNA genome studies, using state of the art techniques, have shown that a large number of Polynesian migrants (100–200), including women, arrived in New Zealand around the same time, in about 1280. Otago University studies have tried to link distinctive DNA teeth patterns, which show special dietary influence, with places in or nearby the Society Islands.

Chinese exploration of the Indian Ocean

The Chinese explorer, Wang Dayuan (fl. 1311–1350) made two major trips by ship to the Indian Ocean. During 1328–1333, he sailed along the South China Sea and visited many places in Southeast Asia and reached as far as South Asia, landing in Sri Lanka and India, and he even went to Australia. Then in 1334–1339, he visited North Africa and East Africa. Later, the Chinese admiral Zheng He (1371–1433) made seven voyages to Arabia, East Africa, India, Indonesia and Thailand.

European Age of Discovery

The Age of Discovery, also known as the Age of Exploration, is one of the most important periods of geographical exploration in human history. It started in the early 15th century and lasted until the 17th century. In that period, Europeans discovered and/or explored vast areas of the Americas, Africa, Asia and Oceania. Portugal and Spain dominated the first stages of exploration, while other European nations followed, such as England, Netherlands, and France.

Outward and return voyages of the Portuguese India run in the Atlantic and the Indian oceans, with the North Atlantic Gyre (volta do mar) picked up by Henry's navigators, and the outward route of the South Atlantic westerlies that Bartolomeu Dias discovered in 1488, followed and explored by the expeditions of Vasco da Gama and Pedro Alvares Cabral.

Important explorations during this period went to a number of continents and regions around the globe. In Africa, important explorers of this period include Diogo Cão (1452-1486) who discovered and ascended the Congo River and reached the coasts of present-day Angola and Namibia; and Bartolomeu Dias (1450–1500), the first European to reach the Cape of Good Hope and other parts of the South African coast.

Explorers of routes from Europe towards Asia, the Indian Ocean, and the Pacific Ocean, include Vasco da Gama (1460–1524), a navigator who made the first trip from Europe to India and back by the Cape of Good Hope, discovering the ocean route to the East; Pedro Álvares Cabral (c. 1467/1468 – c. 1520) who, following the path of Vasco da Gama, claimed Brazil and led the first expedition that linked Europe, Africa, America, and Asia; Diogo Dias, who discovered the eastern coast of Madagascar and rounded the corner of Africa; explorers such as Diogo Fernandes Pereira and Pedro Mascarenhas (1470–1555), among others, who discovered and mapped the Mascarene Islands and other archipelagos.

António de Abreu (1480-1514) and Francisco Serrão (14?–1521) led the first direct European fleet into the Pacific Ocean (on its western edges) and through the Sunda Islands, reaching the Moluccas. Andrés de Urdaneta (1498–1568) discovered the maritime route from Asia to the Americas.

In the Pacific Ocean, Jorge de Menezes (1498–1537) reached New Guinea while García Jofre de Loaísa (1490–1526) reached the Marshall Islands.

Discovery of America

Explorations of the Americas began with the initial discovery of America by Christopher Columbus (1451–1506), who led a Castilian (Spanish) expedition across the Atlantic, discovering America. After the discovery of America by Columbus, a number of important expeditions were sent out to explore the Western Hemisphere. This included Juan Ponce de León (1474–1521), who discovered and mapped the coast of Florida; Vasco Núñez de Balboa (c. 1475–1519), who was the first European to view the Pacific Ocean from American shores (after crossing the Isthmus of Panama) confirming that America was a separate continent from Asia; Aleixo Garcia (14?–1527), who explored the territories of present-day southern Brazil, Paraguay and Bolivia, crossing the Chaco and reaching the Andes (near Sucre).

Álvar Núñez Cabeza de Vaca (1490–1558) discovered the Mississippi River and was the first European to sail the Gulf of Mexico and cross Texas. Jacques Cartier (1491–1557) drew the first maps of part of central and maritime Canada; Francisco Vázquez de Coronado (1510–1554) discovered the Grand Canyon and the Colorado River; Francisco de Orellana (1511–1546) was the first European to navigate the length of the Amazon River.

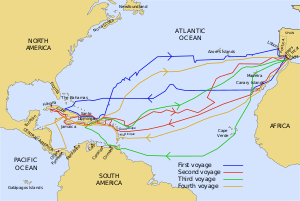
The routes of Captain James Cook's voyages. The first voyage is shown in red, second voyage in green, and third voyage in blue.
Further explorations

Ferdinand Magellan (1480–1521), was the first navigator to cross the Pacific Ocean, discovering the Strait of Magellan, the Tuamotus and Mariana Islands, and achieving a nearly complete circumnavigation of the Earth, in multiple voyages, for the first time. Juan Sebastián Elcano (1476–1526), completed the first global circumnavigation.

In the second half of the 16th century and the 17th century exploration of Asia and the Pacific Ocean continued with explorers such as Andrés de Urdaneta (1498–1568), who discovered the maritime route from Asia to the Americas; Pedro Fernandes de Queirós (1565–1614), who discovered the Pitcairn Islands and the Vanuatu archipelago; Álvaro de Mendaña de Neira (1542–1595), who discovered the Tuvalu archipelago, the Marquesas, the Solomon Islands and Wake Island.

Explorers of Australia included Willem Janszoon (1570–1630), who made the first recorded European landing in Australia; Yñigo Ortiz de Retez, who discovered and reached eastern and northern New Guinea; Luis Váez de Torres (1565–1613), who discovered the Torres Strait between Australia and New Guinea; Abel Tasman (1603–1659), who explored North Australia, discovered Tasmania, New Zealand and Tongatapu.

In North America, major explorers included Henry Hudson (156?–1611), who explored the Hudson Bay in Canada; Samuel de Champlain (1574–1635), who explored St. Lawrence River and the Great Lakes (in Canada and northern United States); and René-Robert Cavelier, Sieur de La Salle (1643–1687), who explored the Great Lakes region of the United States and Canada, and the entire length of the Mississippi River.

The Modern Age

Long after the golden age of discovery, other explorers completed the world map, such as various Russians explorers, reaching the Siberian Pacific coast and the Bering Strait, at the extreme edge of Asia and Alaska (North America); Vitus Bering (1681–1741) who in the service of the Russian Navy, explored the Bering Strait, the Bering Sea, the North American coast of Alaska, and some other northern areas of the Pacific Ocean; and James Cook, who explored the east coast of Australia, the Hawaiian Islands, and circumnavigated Antarctica.

There were still significant explorations which occurred well into the modern age. This includes the Lewis and Clark Expedition (1804-1806), an overland expedition dispatched by President Thomas Jefferson to explore the newly acquired Louisiana Purchase and to find an interior aquatic route to the Pacific Ocean, along with other objectives to examine the flora and fauna of the continent. In 1818, the British researcher Sir John Ross was the first to find that the deep sea is inhabited by life when catching jellyfish and worms in about 2,000 m (6,562 ft) depth with a special device. The United States Exploring Expedition (1838-1842) was an expedition sent by President Andrew Jackson, in order to survey the Pacific Ocean and surrounding lands.

The extreme conditions in the deep sea require elaborate methods and technologies to endure them. In the 20th century, deep-sea exploration advanced considerably through a series of technological inventions, ranging from the sonar system, which can detect the presence of objects underwater through the use of sound, to manned deep-diving submersibles. In 1960, Jacques Piccard and United States Navy Lieutenant Donald Walsh descended in the bathyscaphe Trieste into the deepest part of the world's oceans, the Mariana Trench. In 2018, DSV Limiting Factor, piloted by Victor Vescovo, completed the first mission to the deepest point of the Atlantic Ocean, diving 8,375 m (27,477 ft) below the ocean surface to the base of the Puerto Rico Trench. With the advent of satellite imagery and aviation, exploration of the surface of Earth has largely ceased, however the culture of many disconnected tribes still remain undocumented and left to be explored. Urban exploration is the exploration of manmade structures, usually abandoned ruins or hidden components of the manmade environment.

Space exploration

Space exploration started in the 20th century with the invention of exo-atmospheric rockets. This has given humans the opportunity to travel to the Moon, and to send robotic explorers to other planets and far beyond.

Both of the Voyager probes have left the Solar System, bearing imprinted gold discs with multiple data types.

Behavioral trait

A 2015 study, performed on mobile phone data and on GPS tracks of private vehicles in Italy, demonstrated that individuals naturally split into two well-defined categories according to their mobility habits, dubbed "returners" and "explorers". "Explorers" showed a star-like mobility pattern: they have a central core of locations (composed by home and work places) around which distant core of locations gravitates.

E-patient

From Wikipedia, the free encyclopedia https://en.wikipedi...