Search This Blog

Sunday, July 3, 2022

Moons of Saturn

From Wikipedia, the free encyclopedia
 
Artist's concepts of the Saturnian ring–moon system
A spherical yellow-brownish body (Saturn) can be seen on the left. It is viewed at an oblique angle with respect to its equatorial plane. Around Saturn there are rings and small ring moons. Further to the right large round moons are shown in order of their distance.
Saturn, its rings and major icy moons—from Mimas to Rhea
 
In the foreground there are six round fully illuminated bodies and some small irregular objects. A large half-illuminated body is shown in the background with circular cloud bands around the partially darkened north pole visible.
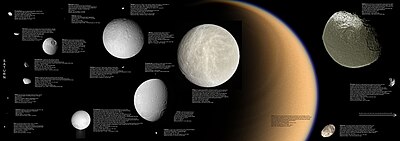
Images of several moons of Saturn. From left to right: Mimas, Enceladus, Tethys, Dione, Rhea; Titan in the background; Iapetus (top right) and irregularly shaped Hyperion (bottom right). Some small moons are also shown. All to scale.

The moons of Saturn are numerous and diverse, ranging from tiny moonlets only tens of meters across to enormous Titan, which is larger than the planet Mercury. Saturn has 83 moons with confirmed orbits that are not embedded in its rings—of which only 13 have diameters greater than 50 kilometers—as well as dense rings that contain millions of embedded moonlets and innumerable smaller ring particles. Seven Saturnian moons are large enough to have collapsed into a relaxed, ellipsoidal shape, though only one or two of those, Titan and possibly Rhea, are currently in hydrostatic equilibrium. Particularly notable among Saturn's moons are Titan, the second-largest moon in the Solar System (after Jupiter's Ganymede), with a nitrogen-rich Earth-like atmosphere and a landscape featuring dry river networks and hydrocarbon lakes, Enceladus, which emits jets of gas and dust from its south-polar region, and Iapetus, with its contrasting black and white hemispheres.

Twenty-four of Saturn's moons are regular satellites; they have prograde orbits not greatly inclined to Saturn's equatorial plane. They include the seven major satellites, four small moons that exist in a trojan orbit with larger moons, two mutually co-orbital moons and two moons that act as shepherds of Saturn's F Ring. Two other known regular satellites orbit within gaps in Saturn's rings. The relatively large Hyperion is locked in a resonance with Titan. The remaining regular moons orbit near the outer edge of the A Ring, within the G Ring and between the major moons Mimas and Enceladus. The regular satellites are traditionally named after Titans and Titanesses or other figures associated with the mythological Saturn.

The remaining fifty-nine, with mean diameters ranging from 4 to 213 km, are irregular satellites, whose orbits are much farther from Saturn, have high inclinations, and are mixed between prograde and retrograde. These moons are probably captured minor planets, or debris from the breakup of such bodies after they were captured, creating collisional families. The irregular satellites have been classified by their orbital characteristics into the Inuit, Norse, and Gallic groups, and their names are chosen from the corresponding mythologies, with two exceptions. One of these is Phoebe (part of the Norse group but named for a Greek Titaness), the ninth moon of Saturn and largest irregular, discovered at the end of the 19th century; the other is Bebhionn, which, though in the Gallic group, is named after an Irish goddess.

The rings of Saturn are made up of objects ranging in size from microscopic to moonlets hundreds of meters across, each in its own orbit around Saturn.[8] Thus a precise number of Saturnian moons cannot be given, because there is no objective boundary between the countless small anonymous objects that form Saturn's ring system and the larger objects that have been named as moons. Over 150 moonlets embedded in the rings have been detected by the disturbance they create in the surrounding ring material, though this is thought to be only a small sample of the total population of such objects.[9]

There are still 30 unnamed moons (as of November 2021), of which all but one is irregular. If named, they will receive names from Gallic, Norse and Inuit mythology based on the orbital groups of the moons.

Discovery

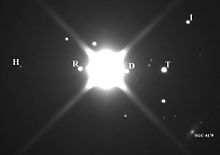
A large bright circle in the center is surrounded by small circles.
Saturn (overexposed) and the moons Iapetus, Titan, Dione, Hyperion, and Rhea viewed through a 12.5-inch telescope

Early observations

Before the advent of telescopic photography, eight moons of Saturn were discovered by direct observation using optical telescopes. Saturn's largest moon, Titan, was discovered in 1655 by Christiaan Huygens using a 57-millimeter (2.2 in) objective lens on a refracting telescope of his own design. Tethys, Dione, Rhea and Iapetus (the "Sidera Lodoicea") were discovered between 1671 and 1684 by Giovanni Domenico Cassini. Mimas and Enceladus were discovered in 1789 by William Herschel. Hyperion was discovered in 1848 by W. C. Bond, G. P. Bond and William Lassell.

The use of long-exposure photographic plates made possible the discovery of additional moons. The first to be discovered in this manner, Phoebe, was found in 1899 by W. H. Pickering. In 1966 the tenth satellite of Saturn was discovered by Audouin Dollfus, when the rings were observed edge-on near an equinox. It was later named Janus. A few years later it was realized that all observations of 1966 could only be explained if another satellite had been present and that it had an orbit similar to that of Janus. This object is now known as Epimetheus, the eleventh moon of Saturn. It shares the same orbit with Janus—the only known example of co-orbitals in the Solar System. In 1980, three additional Saturnian moons were discovered from the ground and later confirmed by the Voyager probes. They are trojan moons of Dione (Helene) and Tethys (Telesto and Calypso).

Observations by spacecraft

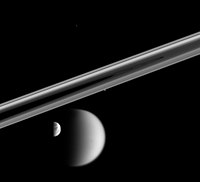
Circular complex rings of Saturn are seen at the low angle. The rings look like two grayish bands running parallel to each other from the left to right and connecting at the far right. Half illuminated Titan and Dione are visible slightly below the rings in the foreground. Two bright dots: one at the lower edge of rings and another above the rings can be seen. They are Prometheus and Telepso.
Four moons of Saturn can be seen on this image by the Cassini spacecraft: The larger Titan and Dione at the bottom, small Prometheus (under the rings) and small Telesto above center.
 
Five moons in another Cassini image: Rhea bisected in the far-right foreground, Mimas behind it, bright Enceladus above and beyond the rings, Pandora eclipsed by the F Ring, and Janus off to the left.

The study of the outer planets has since been revolutionized by the use of unmanned space probes. The arrival of the Voyager spacecraft at Saturn in 1980–1981 resulted in the discovery of three additional moons – Atlas, Prometheus and Pandora, bringing the total to 17. In addition, Epimetheus was confirmed as distinct from Janus. In 1990, Pan was discovered in archival Voyager images.

The Cassini mission, which arrived at Saturn in the summer of 2004, initially discovered three small inner moons including Methone and Pallene between Mimas and Enceladus as well as the second trojan moon of Dione – Polydeuces. It also observed three suspected but unconfirmed moons in the F Ring. In November 2004 Cassini scientists announced that the structure of Saturn's rings indicates the presence of several more moons orbiting within the rings, although only one, Daphnis, had been visually confirmed at the time. In 2007 Anthe was announced. In 2008 it was reported that Cassini observations of a depletion of energetic electrons in Saturn's magnetosphere near Rhea might be the signature of a tenuous ring system around Saturn's second largest moon. In March 2009, Aegaeon, a moonlet within the G Ring, was announced. In July of the same year, S/2009 S 1, the first moonlet within the B Ring, was observed. In April 2014, the possible beginning of a new moon, within the A Ring, was reported.

Outer moons

Quadruple Saturn–moon transit captured by the Hubble Space Telescope

Study of Saturn's moons has also been aided by advances in telescope instrumentation, primarily the introduction of digital charge-coupled devices which replaced photographic plates. For the 20th century, Phoebe stood alone among Saturn's known moons with its highly irregular orbit. Then in 2000, three dozen additional irregular moons have been discovered using ground-based telescopes. A survey starting in late 2000 and conducted using three medium-size telescopes found thirteen new moons orbiting Saturn at a great distance, in eccentric orbits, which are highly inclined to both the equator of Saturn and the ecliptic. They are probably fragments of larger bodies captured by Saturn's gravitational pull. In 2005, astronomers using the Mauna Kea Observatory announced the discovery of twelve more small outer moons, in 2006, astronomers using the Subaru 8.2 m telescope reported the discovery of nine more irregular moons, in April 2007, Tarqeq (S/2007 S 1) was announced and in May of the same year S/2007 S 2 and S/2007 S 3 were reported. In 2019, twenty new irregular satellites of Saturn were reported, resulting in Saturn overtaking Jupiter as the planet with the most known moons for the first time since 2000. Yet another was reported in 2021, after a survey for Saturnian moons took place in 2019.

Some of the 83 known satellites of Saturn are considered lost because they have not been observed since their discovery and hence their orbits are not known well enough to pinpoint their current locations. Work has been done to recover many of them in surveys from 2009 onwards, but four – S/2004 S 13, S/2004 S 17, S/2004 S 7, and S/2007 S 3 – still remain lost today.

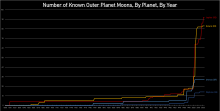
The number of moons known for each of the four outer planets up to October 2019. Saturn currently has 83 known satellites.

Naming

The modern names for Saturnian moons were suggested by John Herschel in 1847. He proposed to name them after mythological figures associated with the Roman titan of time, Saturn (equated to the Greek Cronus). In particular, the then known seven satellites were named after Titans, Titanesses and Giants—brothers and sisters of Cronus. In 1848, Lassell proposed that the eighth satellite of Saturn be named Hyperion after another Titan. When in the 20th century the names of Titans were exhausted, the moons were named after different characters of the Greco-Roman mythology or giants from other mythologies. All the irregular moons (except Phoebe) are named after Inuit and Gallic gods and after Norse ice giants.

Some asteroids share the same names as moons of Saturn: 55 Pandora, 106 Dione, 577 Rhea, 1809 Prometheus, 1810 Epimetheus, and 4450 Pan. In addition, two more asteroids previously shared the names of Saturnian moons until spelling differences were made permanent by the International Astronomical Union (IAU): Calypso and asteroid 53 Kalypso; and Helene and asteroid 101 Helena.

Sizes

Saturn's satellite system is very lopsided: one moon, Titan, comprises more than 96% of the mass in orbit around the planet. The six other planemo (ellipsoidal) moons constitute roughly 4% of the mass, and the remaining 76 small moons, together with the rings, comprise only 0.04%.

The relative masses of Saturn's moons. Values are ×1021 kg. With Titan in the comparison (left), Mimas and Enceladus are invisible at this scale. Even excluding Titan (right), Phoebe, Hyperion, the smaller moons and the rings are still invisible.
 
Saturn's major satellites, compared to the Moon
Name
Diameter
(km)
Mass
(kg)
Orbital radius
(km)
Orbital period
(days)
Mimas 396
(12% Moon)
4×10¹⁹
(0.05% Moon)
185,539
(48% Moon)
0.9
(3% Moon)
Enceladus 504
(14% Moon)
1.1×10²⁰
(0.2% Moon)
237,948
(62% Moon)
1.4
(5% Moon)
Tethys 1,062
(30% Moon)
6.2×10²⁰
(0.8% Moon)
294,619
(77% Moon)
1.9
(7% Moon)
Dione 1,123
(32% Moon)
1.1×10²¹
(1.5% Moon)
377,396
(98% Moon)
2.7
(10% Moon)
Rhea 1,527
(44% Moon)
2.3×10²¹
(3% Moon)
527,108
(137% Moon)
4.5
(20% Moon)
Titan 5,149
(148% Moon)
(75% Mars)
1.35×10²³
(180% Moon)
1,221,870
(318% Moon)
16
(60% Moon)
Iapetus 1,470
(42% Moon)
1.8×10²¹
(2.5% Moon)
3,560,820
(926% Moon)
79
(290% Moon)

Orbital groups

Although the boundaries may be somewhat vague, Saturn's moons can be divided into ten groups according to their orbital characteristics. Many of them, such as Pan and Daphnis, orbit within Saturn's ring system and have orbital periods only slightly longer than the planet's rotation period. The innermost moons and most regular satellites all have mean orbital inclinations ranging from less than a degree to about 1.5 degrees (except Iapetus, which has an inclination of 7.57 degrees) and small orbital eccentricities. On the other hand, irregular satellites in the outermost regions of Saturn's moon system, in particular the Norse group, have orbital radii of millions of kilometers and orbital periods lasting several years. The moons of the Norse group also orbit in the opposite direction to Saturn's rotation.

Ring moonlets

Saturn's F Ring along with the moons, Enceladus and Rhea
 
Sequence of Cassini images of Aegaeon embedded within the bright arc of Saturn's G Ring

During late July 2009, a moonlet, S/2009 S 1, was discovered in the B Ring, 480 km from the outer edge of the ring, by the shadow it cast. It is estimated to be 300 m in diameter. Unlike the A Ring moonlets (see below), it does not induce a 'propeller' feature, probably due to the density of the B Ring.

In 2006, four tiny moonlets were found in Cassini images of the A Ring. Before this discovery only two larger moons had been known within gaps in the A Ring: Pan and Daphnis. These are large enough to clear continuous gaps in the ring. In contrast, a moonlet is only massive enough to clear two small—about 10 km across—partial gaps in the immediate vicinity of the moonlet itself creating a structure shaped like an airplane propeller. The moonlets themselves are tiny, ranging from about 40 to 500 meters in diameter, and are too small to be seen directly.

Possible beginning of a new moon of Saturn imaged on 15 April 2014

In 2007, the discovery of 150 more moonlets revealed that they (with the exception of two that have been seen outside the Encke gap) are confined to three narrow bands in the A Ring between 126,750 and 132,000 km from Saturn's center. Each band is about a thousand kilometers wide, which is less than 1% the width of Saturn's rings. This region is relatively free from the disturbances caused by resonances with larger satellites, although other areas of the A Ring without disturbances are apparently free of moonlets. The moonlets were probably formed from the breakup of a larger satellite. It is estimated that the A Ring contains 7,000–8,000 propellers larger than 0.8 km in size and millions larger than 0.25 km. In April 2014, NASA scientists reported the possible consolidation of a new moon within the A Ring, implying that Saturn's present moons may have formed in a similar process in the past when Saturn's ring system was much more massive.

Similar moonlets may reside in the F Ring. There, "jets" of material may be due to collisions, initiated by perturbations from the nearby small moon Prometheus, of these moonlets with the core of the F Ring. One of the largest F Ring moonlets may be the as-yet unconfirmed object S/2004 S 6. The F Ring also contains transient "fans" which are thought to result from even smaller moonlets, about 1 km in diameter, orbiting near the F Ring core.

One of the recently discovered moons, Aegaeon, resides within the bright arc of G Ring and is trapped in the 7:6 mean-motion resonance with Mimas. This means that it makes exactly seven revolutions around Saturn while Mimas makes exactly six. The moon is the largest among the population of bodies that are sources of dust in this ring.

Ring shepherds

Shepherd moon Daphnis in the Keeler gap
 
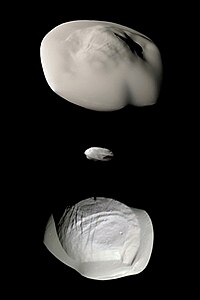
Shepherd moons Atlas, Daphnis and Pan (enhanced color). They bear distinct equatorial ridges that appear to have formed from material accreted from Saturn's rings.

Shepherd satellites are small moons that orbit within, or just beyond, a planet's ring system. They have the effect of sculpting the rings: giving them sharp edges, and creating gaps between them. Saturn's shepherd moons are Pan (Encke gap), Daphnis (Keeler gap), Atlas (A Ring), Prometheus (F Ring) and Pandora (F Ring). These moons together with co-orbitals (see below) probably formed as a result of accretion of the friable ring material on preexisting denser cores. The cores with sizes from one-third to one-half the present-day moons may be themselves collisional shards formed when a parental satellite of the rings disintegrated.

Co-orbitals

Janus and Epimetheus are called co-orbital moons. They are of roughly equal size, with Janus being slightly larger than Epimetheus. Janus and Epimetheus have orbits with only a few kilometers difference in semi-major axis, close enough that they would collide if they attempted to pass each other. Instead of colliding, their gravitational interaction causes them to swap orbits every four years.

Inner large

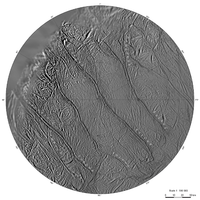
A circular part of a grayish surface, which is intersected from the top-left to the bottom-right by four wide sinuous groves. Smaller and shorter grooves can be seen between them running either parallel to the large grooves or criss-crossing them. There is a rough terrain in the top-left corner.
South pole map of tiger stripes on Enceladus
 
Saturn's moons from bottom to top: Mimas, Enceladus, and Tethys
 
Tethys and the rings of Saturn
 
Color view of Dione in front of Saturn

The innermost large moons of Saturn orbit within its tenuous E Ring, along with three smaller moons of the Alkyonides group.

  • Mimas is the smallest and least massive of the inner round moons, although its mass is sufficient to alter the orbit of Methone. It is noticeably ovoid-shaped, having been made shorter at the poles and longer at the equator (by about 20 km) by the effects of Saturn's gravity. Mimas has a large impact crater one-third its diameter, Herschel, situated on its leading hemisphere. Mimas has no known past or present geologic activity, and its surface is dominated by impact craters. The only tectonic features known are a few arcuate and linear troughs, which probably formed when Mimas was shattered by the Herschel impact.
  • Enceladus is one of the smallest of Saturn's moons that is spherical in shape—only Mimas is smaller—yet is the only small Saturnian moon that is currently endogenously active, and the smallest known body in the Solar System that is geologically active today. Its surface is morphologically diverse; it includes ancient heavily cratered terrain as well as younger smooth areas with few impact craters. Many plains on Enceladus are fractured and intersected by systems of lineaments. The area around its south pole was found by Cassini to be unusually warm and cut by a system of fractures about 130 km long called "tiger stripes", some of which emit jets of water vapor and dust. These jets form a large plume off its south pole, which replenishes Saturn's E ring and serves as the main source of ions in the magnetosphere of Saturn. The gas and dust are released with a rate of more than 100 kg/s. Enceladus may have liquid water underneath the south-polar surface. The source of the energy for this cryovolcanism is thought to be a 2:1 mean-motion resonance with Dione. The pure ice on the surface makes Enceladus one of the brightest known objects in the Solar System—its geometrical albedo is more than 140%.
  • Tethys is the third largest of Saturn's inner moons. Its most prominent features are a large (400 km diameter) impact crater named Odysseus on its leading hemisphere and a vast canyon system named Ithaca Chasma extending at least 270° around Tethys. The Ithaca Chasma is concentric with Odysseus, and these two features may be related. Tethys appears to have no current geological activity. A heavily cratered hilly terrain occupies the majority of its surface, while a smaller and smoother plains region lies on the hemisphere opposite to that of Odysseus. The plains contain fewer craters and are apparently younger. A sharp boundary separates them from the cratered terrain. There is also a system of extensional troughs radiating away from Odysseus. The density of Tethys (0.985 g/cm3) is less than that of water, indicating that it is made mainly of water ice with only a small fraction of rock.
  • Dione is the second-largest inner moon of Saturn. It has a higher density than the geologically dead Rhea, the largest inner moon, but lower than that of active Enceladus. While the majority of Dione's surface is heavily cratered old terrain, this moon is also covered with an extensive network of troughs and lineaments, indicating that in the past it had global tectonic activity. The troughs and lineaments are especially prominent on the trailing hemisphere, where several intersecting sets of fractures form what is called "wispy terrain". The cratered plains have a few large impact craters reaching 250 km in diameter. Smooth plains with low impact-crater counts are also present on a small fraction of its surface. They were probably tectonically resurfaced relatively later in the geological history of Dione. At two locations within smooth plains strange landforms (depressions) resembling oblong impact craters have been identified, both of which lie at the centers of radiating networks of cracks and troughs; these features may be cryovolcanic in origin. Dione may be geologically active even now, although on a scale much smaller than the cryovolcanism of Enceladus. This follows from Cassini magnetic measurements that show Dione is a net source of plasma in the magnetosphere of Saturn, much like Enceladus.

Alkyonides

Three small moons orbit between Mimas and Enceladus: Methone, Anthe, and Pallene. Named after the Alkyonides of Greek mythology, they are some of the smallest moons in the Saturn system. Anthe and Methone have very faint ring arcs along their orbits, whereas Pallene has a faint complete ring. Of these three moons, only Methone has been photographed at close range, showing it to be egg-shaped with very few or no craters.

Trojan

Trojan moons are a unique feature only known from the Saturnian system. A trojan body orbits at either the leading L4 or trailing L5 Lagrange point of a much larger object, such as a large moon or planet. Tethys has two trojan moons, Telesto (leading) and Calypso (trailing), and Dione also has two, Helene (leading) and Polydeuces (trailing). Helene is by far the largest trojan moon, while Polydeuces is the smallest and has the most chaotic orbit. These moons are coated with dusty material that has smoothed out their surfaces.

Outer large

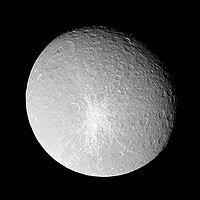
A spherical body is almost fully illuminated. Its grayish surface is covered by numerous circular craters. The terminator is located near the upper-right limb. A large crater can be seen near the limb in the upper-left part of the body. Another smaller bright crater can be seen in the center. It is surrounded by a large bright patch having the shape of a five-pointed star.
Inktomi or "The Splat", a relatively young crater with prominent butterfly-shaped ejecta on Rhea's leading hemisphere
 
Titan in front of Dione and the rings of Saturn
 
An irregularly-shaped and heavily cratered body, pock-marked with dark pits and ridges on its tan-colored icy surface.
Cassini image of Hyperion
 
A part of a spherical body illuminated from the above and behind. The convex limb runs from the lower-left to the upper-right corner. The black outer space is in the upper-left corner. The terminator is near the bottom. The surface of the body is covered with numerous craters. A large ridge runs in the center from the top to bottom.
Equatorial ridge on Iapetus

These moons all orbit beyond the E Ring. They are:

  • Rhea is the second-largest of Saturn's moons. It is even slightly larger than Oberon, the second-largest moon of Uranus. In 2005 Cassini detected a depletion of electrons in the plasma wake of Rhea, which forms when the co-rotating plasma of Saturn's magnetosphere is absorbed by the moon. The depletion was hypothesized to be caused by the presence of dust-sized particles concentrated in a few faint equatorial rings. Such a ring system would make Rhea the only moon in the Solar System known to have rings. Subsequent targeted observations of the putative ring plane from several angles by Cassini's narrow-angle camera turned up no evidence of the expected ring material, leaving the origin of the plasma observations unresolved. Otherwise Rhea has rather a typical heavily cratered surface, with the exceptions of a few large Dione-type fractures (wispy terrain) on the trailing hemisphere and a very faint "line" of material at the equator that may have been deposited by material deorbiting from present or former rings. Rhea also has two very large impact basins on its anti-Saturnian hemisphere, which are about 400 and 500 km across. The first, Tirawa, is roughly comparable to the Odysseus basin on Tethys. There is also a 48 km-diameter impact crater called Inktomi at 112°W that is prominent because of an extended system of bright rays, which may be one of the youngest craters on the inner moons of Saturn. No evidence of any endogenic activity has been discovered on the surface of Rhea.
  • Titan, at 5,149 km diameter, is the second largest moon in the Solar System and Saturn's largest. Out of all the large moons, Titan is the only one with a dense (surface pressure of 1.5 atm), cold atmosphere, primarily made of nitrogen with a small fraction of methane. The dense atmosphere frequently produces bright white convective clouds, especially over the south pole region. On June 6, 2013, scientists at the IAA-CSIC reported the detection of polycyclic aromatic hydrocarbons in the upper atmosphere of Titan. On June 23, 2014, NASA claimed to have strong evidence that nitrogen in the atmosphere of Titan came from materials in the Oort cloud, associated with comets, and not from the materials that formed Saturn in earlier times. The surface of Titan, which is difficult to observe due to persistent atmospheric haze, shows only a few impact craters and is probably very young. It contains a pattern of light and dark regions, flow channels and possibly cryovolcanos. Some dark regions are covered by longitudinal dune fields shaped by tidal winds, where sand is made of frozen water or hydrocarbons. Titan is the only body in the Solar System beside Earth with bodies of liquid on its surface, in the form of methane–ethane lakes in Titan's north and south polar regions. The largest lake, Kraken Mare, is larger than the Caspian Sea. Like Europa and Ganymede, it is believed that Titan has a subsurface ocean made of water mixed with ammonia, which can erupt to the surface of the moon and lead to cryovolcanism. On July 2, 2014, NASA reported the ocean inside Titan may be "as salty as the Earth's Dead Sea".
  • Hyperion is Titan's nearest neighbor in the Saturn system. The two moons are locked in a 4:3 mean-motion resonance with each other, meaning that while Titan makes four revolutions around Saturn, Hyperion makes exactly three. With an average diameter of about 270 km, Hyperion is smaller and lighter than Mimas. It has an extremely irregular shape, and a very odd, tan-colored icy surface resembling a sponge, though its interior may be partially porous as well. The average density of about 0.55 g/cm3 indicates that the porosity exceeds 40% even assuming it has a purely icy composition. The surface of Hyperion is covered with numerous impact craters—those with diameters 2–10 km are especially abundant. It is the only moon besides the small moons of Pluto known to have a chaotic rotation, which means Hyperion has no well-defined poles or equator. While on short timescales the satellite approximately rotates around its long axis at a rate of 72–75° per day, on longer timescales its axis of rotation (spin vector) wanders chaotically across the sky. This makes the rotational behavior of Hyperion essentially unpredictable.
  • Iapetus is the third-largest of Saturn's moons. Orbiting the planet at 3.5 million km, it is by far the most distant of Saturn's large moons, and also has the largest orbital inclination, at 15.47°. Iapetus has long been known for its unusual two-toned surface; its leading hemisphere is pitch-black and its trailing hemisphere is almost as bright as fresh snow. Cassini images showed that the dark material is confined to a large near-equatorial area on the leading hemisphere called Cassini Regio, which extends approximately from 40°N to 40°S. The pole regions of Iapetus are as bright as its trailing hemisphere. Cassini also discovered a 20 km tall equatorial ridge, which spans nearly the moon's entire equator. Otherwise both dark and bright surfaces of Iapetus are old and heavily cratered. The images revealed at least four large impact basins with diameters from 380 to 550 km and numerous smaller impact craters. No evidence of any endogenic activity has been discovered. A clue to the origin of the dark material covering part of Iapetus's starkly dichromatic surface may have been found in 2009, when NASA's Spitzer Space Telescope discovered a vast, nearly invisible disk around Saturn, just inside the orbit of the moon Phoebe – the Phoebe ring. Scientists believe that the disk originates from dust and ice particles kicked up by impacts on Phoebe. Because the disk particles, like Phoebe itself, orbit in the opposite direction to Iapetus, Iapetus collides with them as they drift in the direction of Saturn, darkening its leading hemisphere slightly. Once a difference in albedo, and hence in average temperature, was established between different regions of Iapetus, a thermal runaway process of water ice sublimation from warmer regions and deposition of water vapor onto colder regions ensued. Iapetus's present two-toned appearance results from the contrast between the bright, primarily ice-coated areas and regions of dark lag, the residue left behind after the loss of surface ice.

Irregular

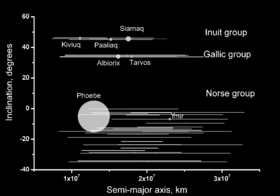
Diagram illustrating the orbits of the irregular satellites of Saturn. The inclination and semi-major axis are represented on the Y and X-axis, respectively. The eccentricity of the orbits is shown by the segments extending from the pericenter to apocenter. The satellites with positive inclinations are prograde, those with negative are retrograde. The X-axis is labeled in km. The prograde Inuit and Gallic groups and the retrograde Norse group are identified.
 
Orbits and positions of Saturn's irregular moons as of 1 January 2021. Prograde orbits are colored blue while retrograde orbits are colored red.

Irregular moons are small satellites with large-radii, inclined, and frequently retrograde orbits, believed to have been acquired by the parent planet through a capture process. They often occur as collisional families or groups. The precise size as well as albedo of the irregular moons are not known for sure because the moons are very small to be resolved by a telescope, although the latter is usually assumed to be quite low—around 6% (albedo of Phoebe) or less. The irregulars generally have featureless visible and near infrared spectra dominated by water absorption bands. They are neutral or moderately red in color—similar to C-type, P-type, or D-type asteroids, though they are much less red than Kuiper belt objects.

Inuit

The Inuit group includes eight prograde outer moons that are similar enough in their distances from the planet (186–297 radii of Saturn), their orbital inclinations (45–50°) and their colors that they can be considered a group. The moons are Ijiraq, Kiviuq, Paaliaq, Siarnaq, and Tarqeq, along with three unnamed moons Saturn LX, S/2004 S 31, and S/2019 S 1. The largest among them is Siarnaq with an estimated size of about 40 km.

Gallic

The Gallic group are four prograde outer moons that are similar enough in their distance from the planet (207–302 radii of Saturn), their orbital inclination (35–40°) and their color that they can be considered a group. They are Albiorix, Bebhionn, Erriapus, and Tarvos. The largest among these moons is Albiorix with an estimated size of about 32 km. There is an additional satellite S/2004 S 24 that could belong to this group, but more observations are needed to confirm or disprove its categorization. S/2004 S 24 has the most distant prograde orbit of Saturn's known satellites.

Norse

The Norse (or Phoebe) group consists of 46 retrograde outer moons. They are Aegir, Bergelmir, Bestla, Farbauti, Fenrir, Fornjot, Greip, Hati, Hyrrokkin, Jarnsaxa, Kari, Loge, Mundilfari, Narvi, Phoebe, Skathi, Skoll, Surtur, Suttungr, Thrymr, Ymir, and twenty-five unnamed satellites. After Phoebe, Ymir is the largest of the known retrograde irregular moons, with an estimated diameter of only 18 km. The Norse group may itself consist of several smaller subgroups.

  • Phoebe, at 213±1.4 km in diameter, is by far the largest of Saturn's irregular satellites. It has a retrograde orbit and rotates on its axis every 9.3 hours. Phoebe was the first moon of Saturn to be studied in detail by Cassini, in June 2004; during this encounter Cassini was able to map nearly 90% of the moon's surface. Phoebe has a nearly spherical shape and a relatively high density of about 1.6 g/cm3. Cassini images revealed a dark surface scarred by numerous impacts—there are about 130 craters with diameters exceeding 10 km. Spectroscopic measurement showed that the surface is made of water ice, carbon dioxide, phyllosilicates, organics and possibly iron bearing minerals. Phoebe is believed to be a captured centaur that originated in the Kuiper belt. It also serves as a source of material for the largest known ring of Saturn, which darkens the leading hemisphere of Iapetus (see above).

List

Orbital diagram of the orbital inclination and orbital distances for Saturn's rings and moon system at various scales. Notable moons, moon groups, and rings are individually labeled. Open the image for full resolution.

Hypothetical

Two moons were claimed to be discovered by different astronomers but never seen again. Both moons were said to orbit between Titan and Hyperion.

  • Chiron which was supposedly sighted by Hermann Goldschmidt in 1861, but never observed by anyone else.
  • Themis was allegedly discovered in 1905 by astronomer William Pickering, but never seen again. Nevertheless, it was included in numerous almanacs and astronomy books until the 1960s.

Temporary

Much like Jupiter, asteroids and comets will infrequently make close approaches to Saturn, even more infrequently becoming captured into orbit of the planet. The comet P/2020 F1 (Leonard) is calculated to have made a close approach of 978000±65000 km (608000±40000 mi to Saturn on 8 May 1936, closer than the orbit of Titan to the planet, with an orbital eccentricity of only 1.098±0.007. The comet may have been orbiting Saturn prior to this as a temporary satellite, but difficulty modelling the non-gravitational forces makes whether or not it was indeed a temporary satellite uncertain.

Other comets and asteroids may have temporarily orbited Saturn at some point, but none are presently known to have.

Formation

It is thought that the Saturnian system of Titan, mid-sized moons, and rings developed from a set-up closer to the Galilean moons of Jupiter, though the details are unclear. It has been proposed either that a second Titan-sized moon broke up, producing the rings and inner mid-sized moons, or that two large moons fused to form Titan, with the collision scattering icy debris that formed the mid-sized moons. On June 23, 2014, NASA claimed to have strong evidence that nitrogen in the atmosphere of Titan came from materials in the Oort cloud, associated with comets, and not from the materials that formed Saturn in earlier times. Studies based on Enceladus's tidal-based geologic activity and the lack of evidence of extensive past resonances in Tethys, Dione, and Rhea's orbits suggest that the moons up to and including Rhea may be only 100 million years old.

Paleocene–Eocene Thermal Maximum

Climate change during the last 65 million years as expressed by the oxygen isotope composition of benthic foraminifera. The Paleocene-Eocene Thermal Maximum (PETM) is characterized by a brief but prominent negative excursion, attributed to rapid warming. Note that the excursion is understated in this graph due to the smoothing of data.

The Paleocene–Eocene Thermal Maximum (PETM), alternatively "Eocene thermal maximum 1" (ETM1), and formerly known as the "Initial Eocene" or "Late Paleocene Thermal Maximum", was a time period with a more than 5–8 °C global average temperature rise across the event. This climate event occurred at the time boundary of the Paleocene and Eocene geological epochs. The exact age and duration of the event is uncertain but it is estimated to have occurred around 55.5 million years ago.

The associated period of massive carbon release into the atmosphere has been estimated to have lasted from 20,000 to 50,000 years. The entire warm period lasted for about 200,000 years. Global temperatures increased by 5–8 °C.

The onset of the Paleocene–Eocene Thermal Maximum has been linked to volcanism and uplift associated with the North Atlantic Igneous Province, causing extreme changes in Earth's carbon cycle and a significant temperature rise. The period is marked by a prominent negative excursion in carbon stable isotope (δ13C) records from around the globe; more specifically, there was a large decrease in 13C/12C ratio of marine and terrestrial carbonates and organic carbon. Paired δ13C, δ11B, and δ18O data suggest that ~12000 Gt of carbon (at least 44000 Gt CO2e) were released over 50,000 years, averaging 0.24 Gt per year.

Stratigraphic sections of rock from this period reveal numerous other changes. Fossil records for many organisms show major turnovers. For example, in the marine realm, a mass extinction of benthic foraminifera, a global expansion of subtropical dinoflagellates, and an appearance of excursion, planktic foraminifera and calcareous nanofossils all occurred during the beginning stages of PETM. On land, modern mammal orders (including primates) suddenly appear in Europe and in North America. Sediment deposition changed significantly at many outcrops and in many drill cores spanning this time interval.

Since at least 1997, the Paleocene–Eocene Thermal Maximum has been investigated in geoscience as an analog to understand the effects of global warming and of massive carbon inputs to the ocean and atmosphere, including ocean acidification. Humans today emit about 10 Gt of carbon (about 37 Gt CO2e) per year, and will have released a comparable amount in about 1,000 years at that rate. A main difference is that during the Paleocene–Eocene Thermal Maximum, the planet was ice-free, as the Drake Passage had not yet opened and the Central American Seaway had not yet closed. Although the PETM is now commonly held to be a "case study" for global warming and massive carbon emission, the cause, details, and overall significance of the event remain uncertain.

Setting

The configuration of oceans and continents was somewhat different during the early Paleogene relative to the present day. The Panama Isthmus did not yet connect North America and South America, and this allowed direct low-latitude circulation between the Pacific and Atlantic Oceans. The Drake Passage, which now separates South America and Antarctica, was closed, and this perhaps prevented thermal isolation of Antarctica. The Arctic was also more restricted. Although various proxies for past atmospheric CO2 levels in the Eocene do not agree in absolute terms, all suggest that levels then were much higher than at present. In any case, there were no significant ice sheets during this time.

Earth surface temperatures increased by about 6 °C from the late Paleocene through the early Eocene, culminating in the "Early Eocene Climatic Optimum" (EECO). Superimposed on this long-term, gradual warming were at least two (and probably more) "hyperthermals". These can be defined as geologically brief (<200,000 year) events characterized by rapid global warming, major changes in the environment, and massive carbon addition. Of these, the PETM was the most extreme and perhaps the first (at least within the Cenozoic). Another hyperthermal clearly occurred at approximately 53.7 Ma, and is now called ETM-2 (also referred to as H-1, or the Elmo event). However, additional hyperthermals probably occurred at about 53.6 Ma (H-2), 53.3 (I-1), 53.2 (I-2) and 52.8 Ma (informally called K, X or ETM-3). The number, nomenclature, absolute ages, and relative global impact of the Eocene hyperthermals are the source of considerable current research. Whether they only occurred during the long-term warming, and whether they are causally related to apparently similar events in older intervals of the geological record (e.g. the Toarcian turnover of the Jurassic) are open issues.

Acidification of deep waters, and the later spreading from the North Atlantic can explain spatial variations in carbonate dissolution. Model simulations show acidic water accumulation in the deep North Atlantic at the onset of the event.

Evidence for global warming

A stacked record of temperatures and ice volume in the deep ocean through the Mesozoic and Cenozoic periods.
LPTM— Paleocene-Eocene Thermal Maximum
OAEs— Oceanic Anoxic Events
MME— Mid-Maastrichtian Event

At the start of the PETM, average global temperatures increased by approximately 6 °C (11 °F) within about 20,000 years. This warming was superimposed on "long-term" early Paleogene warming, and is based on several lines of evidence. There is a prominent (>1) negative excursion in the δ18O of foraminifera shells, both those made in surface and deep ocean water. Because there was a paucity of continental ice in the early Paleogene, the shift in δ18O very probably signifies a rise in ocean temperature. The temperature rise is also supported by analyses of fossil assemblages, the Mg/Ca ratios of foraminifera, and the ratios of certain organic compounds, such as TEX86.

Precise limits on the global temperature rise during the PETM and whether this varied significantly with latitude remain open issues. Oxygen isotope and Mg/Ca of carbonate shells precipitated in surface waters of the ocean are commonly used measurements for reconstructing past temperature; however, both paleotemperature proxies can be compromised at low latitude locations, because re-crystallization of carbonate on the seafloor renders lower values than when formed. On the other hand, these and other temperature proxies (e.g., TEX86) are impacted at high latitudes because of seasonality; that is, the “temperature recorder” is biased toward summer, and therefore higher values, when the production of carbonate and organic carbon occurred.

Certainly, the central Arctic Ocean was ice-free before, during, and after the PETM. This can be ascertained from the composition of sediment cores recovered during the Arctic Coring Expedition (ACEX) at 87°N on Lomonosov Ridge. Moreover, temperatures increased during the PETM, as indicated by the brief presence of subtropical dinoflagellates, and a marked increase in TEX86. The latter record is intriguing, though, because it suggests a 6 °C (11 °F) rise from ~17 °C (63 °F) before the PETM to ~23 °C (73 °F) during the PETM. Assuming the TEX86 record reflects summer temperatures, it still implies much warmer temperatures on the North Pole compared to the present day, but no significant latitudinal amplification relative to surrounding time.

The above considerations are important because, in many global warming simulations, high latitude temperatures increase much more at the poles through an ice–albedo feedback. It may be the case, however, that during the PETM, this feedback was largely absent because of limited polar ice, so temperatures on the Equator and at the poles increased similarly.

Evidence for carbon addition

Clear evidence for massive addition of 13C-depleted carbon at the onset of the PETM comes from two observations. First, a prominent negative excursion in the carbon isotope composition (δ13C) of carbon-bearing phases characterizes the PETM in numerous (>130) widespread locations from a range of environments. Second, carbonate dissolution marks the PETM in sections from the deep sea.

The total mass of carbon injected to the ocean and atmosphere during the PETM remains the source of debate. In theory, it can be estimated from the magnitude of the negative carbon isotope excursion (CIE), the amount of carbonate dissolution on the seafloor, or ideally both. However, the shift in the δ13C across the PETM depends on the location and the carbon-bearing phase analyzed. In some records of bulk carbonate, it is about 2‰ (per mil); in some records of terrestrial carbonate or organic matter it exceeds 6‰. Carbonate dissolution also varies throughout different ocean basins. It was extreme in parts of the north and central Atlantic Ocean, but far less pronounced in the Pacific Ocean. With available information, estimates of the carbon addition range from about 2,000 to 7,000 gigatons.

Comparison with today's climate change

Model simulations of peak carbon addition to the ocean–atmosphere system during the PETM give a probable range of 0.3–1.7 petagrams of carbon per year (Pg C/yr), which is much slower than the currently observed rate of carbon emissions. It has been suggested that today's methane emission regime from the ocean floor is potentially similar to that during the PETM. (One petagram of carbon = 1 gigaton of carbon, GtC; the current rate of carbon injection into the atmosphere is over 10 GtC/yr, much larger than the carbon injection rate that occurred during the PETM.)

Professor of Earth and planetary sciences James Zachos notes that IPCC projections for 2300 in the 'business-as-usual' scenario could "potentially bring global temperature to a level the planet has not seen in 50 million years" – during the early Eocene. Some have described the PETM as arguably the best ancient analog of modern climate change. Scientists have investigated effects of climate change on chemistry of the oceans by exploring oceanic changes during the PETM.

A study found that the PETM shows that substantial climate-shifting tipping points in the Earth system exist, which "can trigger release of additional carbon reservoirs and drive Earth's climate into a hotter state".

Timing of carbon addition and warming

The timing of the PETM δ13C excursion is of considerable interest. This is because the total duration of the CIE, from the rapid drop in δ13C through the near recovery to initial conditions, relates to key parameters of our global carbon cycle, and because the onset provides insight to the source of 13C-depleted CO2.

The total duration of the CIE can be estimated in several ways. The iconic sediment interval for examining and dating the PETM is a core recovered in 1987 by the Ocean Drilling Program at Hole 690B at Maud Rise in the South Atlantic Ocean. At this location, the PETM CIE, from start to end, spans about 2 m. Long-term age constraints, through biostratigraphy and magnetostratigraphy, suggest an average Paleogene sedimentation rate of about 1.23 cm/1,000yrs. Assuming a constant sedimentation rate, the entire event, from onset though termination, was therefore estimated at 200,000 years. Subsequently, it was noted that the CIE spanned 10 or 11 subtle cycles in various sediment properties, such as Fe content. Assuming these cycles represent precession, a similar but slightly longer age was calculated by Rohl et al. 2000. A ~200,000 year duration for the CIE is estimated from models of global carbon cycling. If a massive amount of 13C-depleted CO2 is rapidly injected into the modern ocean or atmosphere and projected into the future, a ~200,000 year CIE results because of slow flushing through quasi steady-state inputs (weathering and volcanism) and outputs (carbonate and organic) of carbon.

The above approach can be performed at many sections containing the PETM. This has led to an intriguing result. At some locations (mostly deep-marine), sedimentation rates must have decreased across the PETM, presumably because of carbonate dissolution on the seafloor; at other locations (mostly shallow-marine), sedimentation rates must have increased across the PETM, presumably because of enhanced delivery of riverine material during the event.

Age constraints at several deep-sea sites have been independently examined using 3He contents, assuming the flux of this cosmogenic nuclide is roughly constant over short time periods. This approach also suggests a rapid onset for the PETM CIE (<20,000 years). However, the 3He records support a faster recovery to near initial conditions (<100,000 years) than predicted by flushing via weathering inputs and carbonate and organic outputs.

There is other evidence to suggest that warming predated the δ13C excursion by some 3,000 years.

Effects

Weather

Azolla floating ferns, fossils of this genus indicate subtropical weather at the North Pole

The climate would also have become much wetter, with the increase in evaporation rates peaking in the tropics. Deuterium isotopes reveal that much more of this moisture was transported polewards than normal. Warm weather would have predominated as far north as the Polar basin. Finds of fossils of Azolla floating ferns in polar regions indicate subtropic temperatures at the poles. The Messel pit biota, dated to the middle of the thermal maximum, indicate a tropical rainforest environment in South Germany. Unlike modern rainforests, its latitude would have made it seasonal combined with equatorial temperatures, a weather system and corresponding environment unmatched anywhere on Earth today.

Ocean

The amount of freshwater in the Arctic Ocean increased, in part due to northern hemisphere rainfall patterns, fueled by poleward storm track migrations under global warming conditions.

Anoxia

In parts of the oceans, especially the north Atlantic Ocean, bioturbation was absent. This may be due to bottom-water anoxia, or by changing ocean circulation patterns changing the temperatures of the bottom water. However, many ocean basins remained bioturbated through the PETM.

Sea level

Along with the global lack of ice, the sea level would have risen due to thermal expansion. Evidence for this can be found in the shifting palynomorph assemblages of the Arctic Ocean, which reflect a relative decrease in terrestrial organic material compared to marine organic matter.

Currents

At the start of the PETM, the ocean circulation patterns changed radically in the course of under 5,000 years. Global-scale current directions reversed due to a shift in overturning from the southern hemisphere to northern hemisphere overturning. This "backwards" flow persisted for 40,000 years. Such a change would transport warm water to the deep oceans, enhancing further warming.

Lysocline

The lysocline marks the depth at which carbonate starts to dissolve (above the lysocline, carbonate is oversaturated): today, this is at about 4 km, comparable to the median depth of the oceans. This depth depends on (among other things) temperature and the amount of CO2 dissolved in the ocean. Adding CO2 initially raises the lysocline, resulting in the dissolution of deep water carbonates. This deep-water acidification can be observed in ocean cores, which show (where bioturbation has not destroyed the signal) an abrupt change from grey carbonate ooze to red clays (followed by a gradual grading back to grey). It is far more pronounced in north Atlantic cores than elsewhere, suggesting that acidification was more concentrated here, related to a greater rise in the level of the lysocline. In parts of the southeast Atlantic, the lysocline rose by 2 km in just a few thousand years.

Life

Stoichiometric magnetite (Fe
3
O
4
) particles were obtained from PETM-age marine sediments. The study from 2008 found elongate prism and spearhead crystal morphologies, considered unlike any magnetite crystals previously reported, and are potentially of biogenic origin. These biogenic magnetite crystals show unique gigantism, and probably are of aquatic origin. The study suggests that development of thick suboxic zones with high iron bioavailability, the result of dramatic changes in weathering and sedimentation rates, drove diversification of magnetite-forming organisms, likely including eukaryotes. Biogenic magnetites in animals have a crucial role in geomagnetic field navigation.

Ocean

The PETM is accompanied by a mass extinction of 35–50% of benthic foraminifera (especially in deeper waters) over the course of ~1,000 years – the group suffering more than during the dinosaur-slaying K-T extinction. Contrarily, planktonic foraminifera diversified, and dinoflagellates bloomed. Success was also enjoyed by the mammals, who radiated extensively around this time.

The deep-sea extinctions are difficult to explain, because many species of benthic foraminifera in the deep-sea are cosmopolitan, and can find refugia against local extinction. General hypotheses such as a temperature-related reduction in oxygen availability, or increased corrosion due to carbonate undersaturated deep waters, are insufficient as explanations. Acidification may also have played a role in the extinction of the calcifying foraminifera, and the higher temperatures would have increased metabolic rates, thus demanding a higher food supply. Such a higher food supply might not have materialized because warming and increased ocean stratification might have led to declining productivity and/or increased remineralization of organic matter in the water column, before it reached the benthic foraminifera on the sea floor. The only factor global in extent was an increase in temperature. Regional extinctions in the North Atlantic can be attributed to increased deep-sea anoxia, which could be due to the slowdown of overturning ocean currents, or the release and rapid oxidation of large amounts of methane. Oxygen minimum zones in the oceans may have expanded.

In shallower waters, it's undeniable that increased CO2 levels result in a decreased oceanic pH, which has a profound negative effect on corals. Experiments suggest it is also very harmful to calcifying plankton. However, the strong acids used to simulate the natural increase in acidity which would result from elevated CO2 concentrations may have given misleading results, and the most recent evidence is that coccolithophores (E. huxleyi at least) become more, not less, calcified and abundant in acidic waters. No change in the distribution of calcareous nanoplankton such as the coccolithophores can be attributed to acidification during the PETM. Acidification did lead to an abundance of heavily calcified algae and weakly calcified forams.

A study published in May 2021 concluded that fish thrived in at least some tropical areas during the PETM, based on discovered fish fossils including Mene maculata at Ras Gharib, Egypt.

Land

Humid conditions caused migration of modern Asian mammals northward, dependent on the climatic belts. Uncertainty remains for the timing and tempo of migration.

The increase in mammalian abundance is intriguing. Increased CO2 levels may have promoted dwarfing – which may have encouraged speciation. Many major mammalian orders – including the Artiodactyla, horses, and primates – appeared and spread around the globe 13,000 to 22,000 years after the initiation of the PETM.

Temperature

Proxy data from one of the studied sites show rapid +8 °C temperature rise, in accordance with existing regional records of marine and terrestrial environments. Notable is the absence of documented greater warming in polar regions. This implies a non-existing ice-albedo feedback, suggesting no sea or land ice was present in the late Paleocene.

Terrestrial

During the PETM, sediments are enriched with kaolinite from a detrital source due to denudation (initial processes such as volcanoes, earthquakes, and plate tectonics). This suggests increased precipitation, and enhanced erosion of older kaolinite-rich soils and sediments. Increased weathering from the enhanced runoff formed thick paleosoil enriched with carbonate nodules (Microcodium like), and this suggests a semi-arid climate.

Possible causes

Discriminating between different possible causes of the PETM is difficult. Temperatures were rising globally at a steady pace, and a mechanism must be invoked to produce an instantaneous spike which may have been accentuated or catalyzed by positive feedback (or activation of "tipping or points"). The biggest aid in disentangling these factors comes from a consideration of the carbon isotope mass balance. We know the entire exogenic carbon cycle (i.e. the carbon contained within the oceans and atmosphere, which can change on short timescales) underwent a −0.2 % to −0.3 % perturbation in δ13C, and by considering the isotopic signatures of other carbon reserves, can consider what mass of the reserve would be necessary to produce this effect. The assumption underpinning this approach is that the mass of exogenic carbon was the same in the Paleogene as it is today – something which is very difficult to confirm.

Eruption of large kimberlite field

Although the cause of the initial warming has been attributed to a massive injection of carbon (CO2 and/or CH4) into the atmosphere, the source of the carbon has yet to be found. The emplacement of a large cluster of kimberlite pipes at ~56 Ma in the Lac de Gras region of northern Canada may have provided the carbon that triggered early warming in the form of exsolved magmatic CO2. Calculations indicate that the estimated 900–1,100 Pg of carbon required for the initial approximately 3 °C of ocean water warming associated with the Paleocene-Eocene thermal maximum could have been released during the emplacement of a large kimberlite cluster. The transfer of warm surface ocean water to intermediate depths led to thermal dissociation of seafloor methane hydrates, providing the isotopically depleted carbon that produced the carbon isotopic excursion. The coeval ages of two other kimberlite clusters in the Lac de Gras field and two other early Cenozoic hyperthermals indicate that CO2 degassing during kimberlite emplacement is a plausible source of the CO2 responsible for these sudden global warming events.

Volcanic activity

Satellite photo of Ardnamurchan – with clearly visible circular shape, which is the 'plumbings of an ancient volcano'

To balance the mass of carbon and produce the observed δ13C value, at least 1,500 gigatons of carbon would have to degas from the mantle via volcanoes over the course of the two, 1,000 year, steps. To put this in perspective, this is about 200 times the background rate of degassing for the rest of the Paleocene. There is no indication that such a burst of volcanic activity has occurred at any point in Earth's history. However, substantial volcanism had been active in East Greenland for around the preceding million years or so, but this struggles to explain the rapidity of the PETM. Even if the bulk of the 1,500 gigatons of carbon was released in a single pulse, further feedbacks would be necessary to produce the observed isotopic excursion.

On the other hand, there are suggestions that surges of activity occurred in the later stages of the volcanism and associated continental rifting. Intrusions of hot magma into carbon-rich sediments may have triggered the degassing of isotopically light methane in sufficient volumes to cause global warming and the observed isotope anomaly. This hypothesis is documented by the presence of extensive intrusive sill complexes and thousands of kilometer-sized hydrothermal vent complexes in sedimentary basins on the mid-Norwegian margin and west of Shetland. Volcanic eruptions of a large magnitude can impact global climate, reducing the amount of solar radiation reaching the Earth's surface, lowering temperatures in the troposphere, and changing atmospheric circulation patterns. Large-scale volcanic activity may last only a few days, but the massive outpouring of gases and ash can influence climate patterns for years. Sulfuric gases convert to sulfate aerosols, sub-micron droplets containing about 75 percent sulfuric acid. Following eruptions, these aerosol particles can linger as long as three to four years in the stratosphere. Further phases of volcanic activity could have triggered the release of more methane, and caused other early Eocene warm events such as the ETM2. It has also been suggested that volcanic activity around the Caribbean may have disrupted the circulation of oceanic currents, amplifying the magnitude of climate change.

A 2017 study noted strong evidence of a volcanic carbon source (greater than 10,000 petagrams of carbon), associated with the North Atlantic Igneous Province. A 2021 study found the PETM was directly preceded by volcanism.

Comet impact

A briefly popular theory held that a 12C-rich comet struck the earth and initiated the warming event. A cometary impact coincident with the P/E boundary can also help explain some enigmatic features associated with this event, such as the iridium anomaly at Zumaia, the abrupt appearance of kaolinitic clays with abundant magnetic nanoparticles on the coastal shelf of New Jersey, and especially the nearly simultaneous onset of the carbon isotope excursion and the thermal maximum. Indeed, a key feature and testable prediction of a comet impact is that it should produce virtually instantaneous environmental effects in the atmosphere and surface ocean with later repercussions in the deeper ocean. Even allowing for feedback processes, this would require at least 100 gigatons of extraterrestrial carbon. Such a catastrophic impact should have left its mark on the globe. However, the evidence put forward does not stand up to scrutiny. An unusual 9-meter-thick clay layer supposedly formed soon after the impact, containing unusual amounts of magnetite, but it formed too slowly for these magnetic particles to have been a result of the comet's impact. and it turns out they were created by bacteria. However, recent analyses have shown that isolated particles of non-biogenic origin make up the majority of the magnetic particles in the thick clay unit.

A 2016 report in Science describes the discovery of impact ejecta from three marine P-E boundary sections from the Atlantic margin of the eastern U.S., indicating that an extraterrestrial impact occurred during the carbon isotope excursion at the P-E boundary. The silicate glass spherules found were identified as microtektites and microkrystites.

Burning of peat

The combustion of prodigious quantities of peat was once postulated, because there was probably a greater mass of carbon stored as living terrestrial biomass during the Paleocene than there is today since plants in fact grew more vigorously during the period of the PETM. This theory was refuted, because in order to produce the δ13C excursion observed, over 90 percent of the Earth's biomass would have to have been combusted. However, the Paleocene is also recognized as a time of significant peat accumulation worldwide. A comprehensive search failed to find evidence for the combustion of fossil organic matter, in the form of soot or similar particulate carbon.

Orbital forcing

The presence of later (smaller) warming events of a global scale, such as the Elmo horizon (aka ETM2), has led to the hypothesis that the events repeat on a regular basis, driven by maxima in the 400,000 and 100,000 year eccentricity cycles in the Earth's orbit. The current warming period is expected to last another 50,000 years due to a minimum in the eccentricity of the Earth's orbit. Orbital increase in insolation (and thus temperature) would force the system over a threshold and unleash positive feedbacks.

Methane release

None of the above causes are alone sufficient to cause the carbon isotope excursion or warming observed at the PETM. The most obvious feedback mechanism that could amplify the initial perturbation is that of methane clathrates. Under certain temperature and pressure conditions, methane – which is being produced continually by decomposing microbes in sea bottom sediments – is stable in a complex with water, which forms ice-like cages trapping the methane in solid form. As temperature rises, the pressure required to keep this clathrate configuration stable increases, so shallow clathrates dissociate, releasing methane gas to make its way into the atmosphere. Since biogenic clathrates have a δ13C signature of −60 ‰ (inorganic clathrates are the still rather large −40 ‰), relatively small masses can produce large δ13C excursions. Further, methane is a potent greenhouse gas as it is released into the atmosphere, so it causes warming, and as the ocean transports this warmth to the bottom sediments, it destabilizes more clathrates. It would take around 2,300 years for an increased temperature to diffuse warmth into the sea bed to a depth sufficient to cause a release of clathrates, although the exact time-frame is highly dependent on a number of poorly constrained assumptions. Ocean warming due to flooding and pressure changes due to a sea-level drop may have caused clathrates to become unstable and release methane. This can take place over as short of a period as a few thousand years. The reverse process, that of fixing methane in clathrates, occurs over a larger scale of tens of thousands of years.

In order for the clathrate hypothesis to work, the oceans must show signs of having been warmer slightly before the carbon isotope excursion, because it would take some time for the methane to become mixed into the system and δ13C-reduced carbon to be returned to the deep ocean sedimentary record. Until recently, the evidence suggested that the two peaks were in fact simultaneous, weakening the support for the methane theory. But recent (2002) work has managed to detect a short gap between the initial warming and the δ13C excursion. Chemical markers of surface temperature (TEX86) also indicate that warming occurred around 3,000 years before the carbon isotope excursion, but this does not seem to hold true for all cores. Notably, deeper (non-surface) waters do not appear to display evidence of this time gap. Moreover, the small apparent change in TEX86 that precede the δ13C anomaly can easily (and more plausibly) be ascribed to local variability (especially on the Atlantic coastal plain, e.g. Sluijs, et al., 2007) as the TEX86 paleo-thermometer is prone to significant biological effects. The δ18O of benthic or planktonic forams does not show any pre-warming in any of these localities, and in an ice-free world, it is generally a much more reliable indicator of past ocean temperatures.

Analysis of these records reveals another interesting fact: planktonic (floating) forams record the shift to lighter isotope values earlier than benthic (bottom dwelling) forams. The lighter (lower δ13C) methanogenic carbon can only be incorporated into the forams' shells after it has been oxidised. A gradual release of the gas would allow it to be oxidised in the deep ocean, which would make benthic forams show lighter values earlier. The fact that the planktonic forams are the first to show the signal suggests that the methane was released so rapidly that its oxidation used up all the oxygen at depth in the water column, allowing some methane to reach the atmosphere unoxidised, where atmospheric oxygen would react with it. This observation also allows us to constrain the duration of methane release to under around 10,000 years.

However, there are several major problems with the methane hydrate dissociation hypothesis. The most parsimonious interpretation for surface-water forams to show the δ13C excursion before their benthic counterparts (as in the Thomas et al. paper) is that the perturbation occurred from the top down, and not the bottom up. If the anomalous δ13C (in whatever form: CH4 or CO2) entered the atmospheric carbon reservoir first, and then diffused into the surface ocean waters, which mix with the deeper ocean waters over much longer time-scales, we would expect to observe the planktonics shifting toward lighter values before the benthics. Moreover, careful examination of the Thomas et al. data set shows that there is not a single intermediate planktonic foram value, implying that the perturbation and attendant δ13C anomaly happened over the lifespan of a single foram – much too fast for the nominal 10,000-year release needed for the methane hypothesis to work.

There is a debate about whether there was a large enough amount of methane hydrate to be a major carbon source; a recent paper proposed that was the case. The present-day global methane hydrate reserve is poorly constrained, but is mostly considered to be between 2,000 and 10,000 Gt. However, because the global ocean bottom temperatures were ~6 °C higher than today, which implies a much smaller volume of sediment hosting gas hydrate than today, the global amount of hydrate before the PETM has been thought to be much less than present-day estimates. in a 2006 study, scientists regarded the source of carbon for the PETM to be a mystery. A 2011 study, using numerical simulations suggests that enhanced organic carbon sedimentation and methanogenesis could have compensated for the smaller volume of hydrate stability.

A 2016 study based on reconstructions of atmospheric CO2 content during the PETM's carbon isotope excursions (CIE), using triple oxygen isotope analysis, suggests a massive release of seabed methane into the atmosphere as the driver of climatic changes. The authors also note:

A massive release of methane clathrates by thermal dissociation has been the most convincing hypothesis to explain the CIE since it was first identified.

Ocean circulation

The large scale patterns of ocean circulation are important when considering how heat was transported through the oceans. Our understanding of these patterns is still in a preliminary stage. Models show that there are possible mechanisms to quickly transport heat to the shallow, clathrate-containing ocean shelves, given the right bathymetric profile, but the models cannot yet match the distribution of data we observe. "Warming accompanying a south-to-north switch in deepwater formation would produce sufficient warming to destabilize seafloor gas hydrates over most of the world ocean to a water depth of at least 1900 m." This destabilization could have resulted in the release of more than 2000 gigatons of methane gas from the clathrate zone of the ocean floor.

Arctic freshwater input into the North Pacific could serve as a catalyst for methane hydrate destabilization, an event suggested as a precursor to the onset of the PETM.

Recovery

Climate proxies, such as ocean sediments (depositional rates) indicate a duration of ∼83 ka, with ∼33 ka in the early rapid phase and ∼50 ka in a subsequent gradual phase.

The most likely method of recovery involves an increase in biological productivity, transporting carbon to the deep ocean. This would be assisted by higher global temperatures and CO2 levels, as well as an increased nutrient supply (which would result from higher continental weathering due to higher temperatures and rainfall; volcanoes may have provided further nutrients). Evidence for higher biological productivity comes in the form of bio-concentrated barium. However, this proxy may instead reflect the addition of barium dissolved in methane. Diversifications suggest that productivity increased in near-shore environments, which would have been warm and fertilized by run-off, outweighing the reduction in productivity in the deep oceans.

Platinum group

From Wikipedia, the free encyclopedia ...