From Wikipedia, the free encyclopedia
The number π (; spelled out as "pi") is a mathematical constant that is the ratio of a circle's circumference to its diameter, approximately equal to 3.14159. The number π appears in many formulas across mathematics and physics. It is an irrational number, meaning that it cannot be expressed exactly as a ratio of two integers, although fractions such as 22/7 are commonly used to approximate it. Consequently, its decimal representation never ends, nor enters a permanently repeating pattern. It is a transcendental number, meaning that it cannot be a solution of an equation involving only sums, products, powers, and integers. The transcendence of π implies that it is impossible to solve the ancient challenge of squaring the circle with a compass and straightedge. The decimal digits of π appear to be randomly distributed, but no proof of this conjecture has been found.
For thousands of years, mathematicians have attempted to extend their understanding of π, sometimes by computing its value to a high degree of accuracy. Ancient civilizations, including the Egyptians and Babylonians, required fairly accurate approximations of π for practical computations. Around 250 BC, the Greek mathematician Archimedes created an algorithm to approximate π with arbitrary accuracy. In the 5th century AD, Chinese mathematicians approximated π to seven digits, while Indian mathematicians made a five-digit approximation, both using geometrical techniques. The first computational formula for π, based on infinite series, was discovered a millennium later. The earliest known use of the Greek letter π to represent the ratio of a circle's circumference to its diameter was by the Welsh mathematician William Jones in 1706.
The invention of calculus soon led to the calculation of hundreds of digits of π, enough for all practical scientific computations. Nevertheless, in the 20th and 21st centuries, mathematicians and computer scientists have pursued new approaches that, when combined with increasing computational power, extended the decimal representation of π to many trillions of digits.
These computations are motivated by the development of efficient
algorithms to calculate numeric series, as well as the human quest to
break records. The extensive computations involved have also been used to test supercomputers.
Because its definition relates to the circle, π is found in many formulae in trigonometry and geometry, especially those concerning circles, ellipses and spheres. It is also found in formulae from other topics in science, such as cosmology, fractals, thermodynamics, mechanics, and electromagnetism. In modern mathematical analysis,
it is often instead defined without any reference to geometry;
therefore, it also appears in areas having little to do with geometry,
such as number theory and statistics. The ubiquity of π makes it one of the most widely known mathematical constants inside and outside of science. Several books devoted to π have been published, and record-setting calculations of the digits of π often result in news headlines.
Fundamentals
Name
The symbol used by mathematicians to represent the ratio of a circle's circumference to its diameter is the lowercase Greek letter π, sometimes spelled out as pi. In English, π is pronounced as "pie" ( PY). In mathematical use, the lowercase letter π is distinguished from its capitalized and enlarged counterpart Π, which denotes a product of a sequence, analogous to how Σ denotes summation.
The choice of the symbol π is discussed in the section Adoption of the symbol π.
Definition
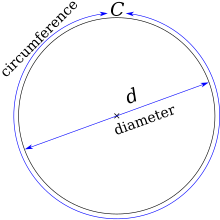
The circumference of a circle is slightly more than three times as long as its diameter. The exact ratio is called π.
π is commonly defined as the ratio of a circle's circumference C to its diameter d:

The ratio C/d is constant,
regardless of the circle's size. For example, if a circle has twice the
diameter of another circle, it will also have twice the circumference,
preserving the ratio C/d. This definition of π implicitly makes use of flat (Euclidean) geometry; although the notion of a circle can be extended to any curve (non-Euclidean) geometry, these new circles will no longer satisfy the formula π = C/d.
Here, the circumference of a circle is the arc length around the perimeter of the circle, a quantity which can be formally defined independently of geometry using limits—a concept in calculus. For example, one may directly compute the arc length of the top half of the unit circle, given in Cartesian coordinates by the equation x2 + y2 = 1, as the integral:

An integral such as this was adopted as the definition of π by Karl Weierstrass, who defined it directly as an integral in 1841.
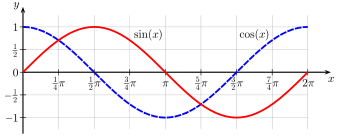
Integration is no longer commonly used in a first analytical definition because, as Remmert 2012 explains, differential calculus typically precedes integral calculus in the university curriculum, so it is desirable to have a definition of π that does not rely on the latter. One such definition, due to Richard Baltzer and popularized by Edmund Landau, is the following: π is twice the smallest positive number at which the cosine function equals 0. π is also the smallest positive number at which the sine
function equals zero, and the difference between consecutive zeroes of
the sine function. The cosine and sine can be defined independently of
geometry as a power series, or as the solution of a differential equation.
In a similar spirit, π can be defined using properties of the complex exponential, exp z, of a complex variable z. Like the cosine, the complex exponential can be defined in one of several ways. The set of complex numbers at which exp z is equal to one is then an (imaginary) arithmetic progression of the form:

and there is a unique positive real number π with this property.
A variation on the same idea, making use of sophisticated mathematical concepts of topology and algebra, is the following theorem: there is a unique (up to automorphism) continuous isomorphism from the group R/Z of real numbers under addition modulo integers (the circle group), onto the multiplicative group of complex numbers of absolute value one. The number π is then defined as half the magnitude of the derivative of this homomorphism.
Irrationality and normality
π is an irrational number, meaning that it cannot be written as the ratio of two integers. Fractions such as 22/7 and 355/113 are commonly used to approximate π, but no common fraction (ratio of whole numbers) can be its exact value. Because π is irrational, it has an infinite number of digits in its decimal representation, and does not settle into an infinitely repeating pattern of digits. There are several proofs that π is irrational; they generally require calculus and rely on the reductio ad absurdum technique. The degree to which π can be approximated by rational numbers (called the irrationality measure) is not precisely known; estimates have established that the irrationality measure is larger than the measure of e or ln 2 but smaller than the measure of Liouville numbers.
The digits of π have no apparent pattern and have passed tests for statistical randomness, including tests for normality; a number of infinite length is called normal when all possible sequences of digits (of any given length) appear equally often. The conjecture that π is normal has not been proven or disproven.
Since the advent of computers, a large number of digits of π have been available on which to perform statistical analysis. Yasumasa Kanada has performed detailed statistical analyses on the decimal digits of π, and found them consistent with normality; for example, the frequencies of the ten digits 0 to 9 were subjected to statistical significance tests, and no evidence of a pattern was found. Any random sequence of digits contains arbitrarily long subsequences that appear non-random, by the infinite monkey theorem. Thus, because the sequence of π's digits passes statistical tests for randomness, it contains some sequences of digits that may appear non-random, such as a sequence of six consecutive 9s that begins at the 762nd decimal place of the decimal representation of π. This is also called the "Feynman point" in mathematical folklore, after Richard Feynman, although no connection to Feynman is known.
Transcendence
In addition to being irrational, π is also a transcendental number, which means that it is not the solution of any non-constant polynomial equation with rational coefficients, such as x5/120 − x3/6 + x = 0.
The transcendence of π has two important consequences: First, π cannot be expressed using any finite combination of rational numbers and square roots or n-th roots (such as 3√31 or √10). Second, since no transcendental number can be constructed with compass and straightedge, it is not possible to "square the circle".
In other words, it is impossible to construct, using compass and
straightedge alone, a square whose area is exactly equal to the area of a
given circle. Squaring a circle was one of the important geometry problems of the classical antiquity.
Amateur mathematicians in modern times have sometimes attempted to
square the circle and claim success—despite the fact that it is
mathematically impossible.
Continued fractions
Like all irrational numbers, π cannot be represented as a common fraction (also known as a simple or vulgar fraction), by the very definition of irrational number (i.e., not a rational number). But every irrational number, including π, can be represented by an infinite series of nested fractions, called a continued fraction:

Truncating the continued fraction at any point yields a rational approximation for π; the first four of these are 3, 22/7, 333/106, and 355/113.
These numbers are among the best-known and most widely used historical
approximations of the constant. Each approximation generated in this way
is a best rational approximation; that is, each is closer to π than any other fraction with the same or a smaller denominator. Because π is known to be transcendental, it is by definition not algebraic and so cannot be a quadratic irrational. Therefore, π cannot have a periodic continued fraction. Although the simple continued fraction for π (shown above) also does not exhibit any other obvious pattern, mathematicians have discovered several generalized continued fractions that do, such as:

Approximate value and digits
Some approximations of pi include:
- Integers: 3
- Fractions: Approximate fractions include (in order of increasing accuracy) 22/7, 333/106, 355/113, 52163/16604, 103993/33102, 104348/33215, and 245850922/78256779. (List is selected terms from OEIS: A063674 and OEIS: A063673.)
- Digits: The first 50 decimal digits are 3.14159265358979323846264338327950288419716939937510... (see OEIS: A000796)
Digits in other number systems
Complex numbers and Euler's identity
Any complex number, say z, can be expressed using a pair of real numbers. In the polar coordinate system, one number (radius or r) is used to represent z's distance from the origin of the complex plane, and the other (angle or φ) the counter-clockwise rotation from the positive real line:

where i is the imaginary unit satisfying i2 = −1. The frequent appearance of π in complex analysis can be related to the behaviour of the exponential function of a complex variable, described by Euler's formula:

where the constant e is the base of the natural logarithm. This formula establishes a correspondence between imaginary powers of e and points on the unit circle centered at the origin of the complex plane. Setting φ = π in Euler's formula results in Euler's identity, celebrated in mathematics due to it containing the five most important mathematical constants:

There are n different complex numbers z satisfying zn = 1, and these are called the "n-th roots of unity" and are given by the formula:

History
Antiquity
The best-known approximations to π dating before the Common Era were accurate to two decimal places; this was improved upon in Chinese mathematics in particular by the mid-first millennium, to an accuracy of seven decimal places.
After this, no further progress was made until the late medieval period.
Based on the measurements of the Great Pyramid of Giza (c. 2560 BC), some Egyptologists have claimed that the ancient Egyptians used an approximation of π as 22/7 from as early as the Old Kingdom. This claim has been met with skepticism.
The earliest written approximations of π are found in Babylon and Egypt, both within one per cent of the true value. In Babylon, a clay tablet dated 1900–1600 BC has a geometrical statement that, by implication, treats π as 25/8 = 3.125. In Egypt, the Rhind Papyrus, dated around 1650 BC but copied from a document dated to 1850 BC, has a formula for the area of a circle that treats π as (16/9)2 ≈ 3.16.
Astronomical calculations in the Shatapatha Brahmana (ca. 4th century BC) use a fractional approximation of 339/108 ≈ 3.139 (with a relative error of 9×10⁻⁴). Other Indian sources by about 150 BC treat π as √10 ≈ 3.1622.
Polygon approximation era
π can be estimated by computing the perimeters of circumscribed and inscribed polygons.
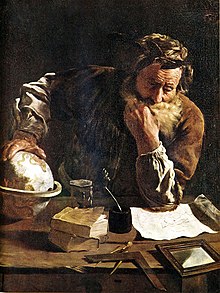
Archimedes developed the polygonal approach to approximating
π.
The first recorded algorithm for rigorously calculating the value of π was a geometrical approach using polygons, devised around 250 BC by the Greek mathematician Archimedes. This polygonal algorithm dominated for over 1,000 years, and as a result π is sometimes referred to as Archimedes's constant. Archimedes computed upper and lower bounds of π
by drawing a regular hexagon inside and outside a circle, and
successively doubling the number of sides until he reached a 96-sided
regular polygon. By calculating the perimeters of these polygons, he
proved that 223/71 < π < 22/7 (that is 3.1408 < π < 3.1429). Archimedes' upper bound of 22/7 may have led to a widespread popular belief that π is equal to 22/7. Around 150 AD, Greek-Roman scientist Ptolemy, in his Almagest, gave a value for π of 3.1416, which he may have obtained from Archimedes or from Apollonius of Perga. Mathematicians using polygonal algorithms reached 39 digits of π in 1630, a record only broken in 1699 when infinite series were used to reach 71 digits.
In ancient China, values for π included 3.1547 (around 1 AD), √10 (100 AD, approximately 3.1623), and 142/45 (3rd century, approximately 3.1556). Around 265 AD, the Wei Kingdom mathematician Liu Hui created a polygon-based iterative algorithm and used it with a 3,072-sided polygon to obtain a value of π of 3.1416. Liu later invented a faster method of calculating π
and obtained a value of 3.14 with a 96-sided polygon, by taking
advantage of the fact that the differences in area of successive
polygons form a geometric series with a factor of 4. The Chinese mathematician Zu Chongzhi, around 480 AD, calculated that 3.1415926 < π < 3.1415927 and suggested the approximations π ≈ 355/113 = 3.14159292035... and π ≈ 22/7 = 3.142857142857..., which he termed the Milü (''close ratio") and Yuelü ("approximate ratio"), respectively, using Liu Hui's algorithm
applied to a 12,288-sided polygon. With a correct value for its seven
first decimal digits, this value remained the most accurate
approximation of π available for the next 800 years.
The Indian astronomer Aryabhata used a value of 3.1416 in his Āryabhaṭīya (499 AD). Fibonacci in c. 1220 computed 3.1418 using a polygonal method, independent of Archimedes. Italian author Dante apparently employed the value 3+√2/10 ≈ 3.14142.
The Persian astronomer Jamshīd al-Kāshī produced 9 sexagesimal digits, roughly the equivalent of 16 decimal digits, in 1424 using a polygon with 3×228 sides, which stood as the world record for about 180 years. French mathematician François Viète in 1579 achieved 9 digits with a polygon of 3×217 sides. Flemish mathematician Adriaan van Roomen arrived at 15 decimal places in 1593. In 1596, Dutch mathematician Ludolph van Ceulen reached 20 digits, a record he later increased to 35 digits (as a result, π was called the "Ludolphian number" in Germany until the early 20th century). Dutch scientist Willebrord Snellius reached 34 digits in 1621, and Austrian astronomer Christoph Grienberger arrived at 38 digits in 1630 using 1040 sides. Christiaan Huygens was able to arrive at 10 decimals places in 1654 using a slightly different method equivalent to Richardson extrapolation.
Infinite series
Comparison of the convergence of several historical infinite series for π. Sn is the approximation after taking n terms. Each subsequent subplot magnifies the shaded area horizontally by 10 times.
The calculation of π was revolutionized by the development of infinite series techniques in the 16th and 17th centuries. An infinite series is the sum of the terms of an infinite sequence. Infinite series allowed mathematicians to compute π with much greater precision than Archimedes and others who used geometrical techniques. Although infinite series were exploited for π most notably by European mathematicians such as James Gregory and Gottfried Wilhelm Leibniz, the approach also appeared in the Kerala school sometime between 1400 and 1500 AD. Around 1500 AD, a written description of an infinite series that could be used to compute π was laid out in Sanskrit verse in Tantrasamgraha by Nilakantha Somayaji. The series are presented without proof, but proofs are presented in a later work, Yuktibhāṣā, from around 1530 AD. Nilakantha attributes the series to an earlier Indian mathematician, Madhava of Sangamagrama, who lived c. 1350 – c. 1425. Several infinite series are described, including series for sine, tangent, and cosine, which are now referred to as the Madhava series or Gregory–Leibniz series. Madhava used infinite series to estimate π to 11 digits around 1400, but that value was improved on around 1430 by the Persian mathematician Jamshīd al-Kāshī, using a polygonal algorithm.
In 1593, François Viète published what is now known as Viète's formula, an infinite product (rather than an infinite sum, which is more typically used in π calculations):

In 1655, John Wallis published what is now known as Wallis product, also an infinite product:

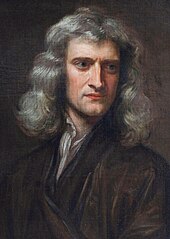
Isaac Newton used
infinite series to compute
π to 15 digits, later writing "I am ashamed to tell you to how many figures I carried these computations".
In the 1660s, the English scientist Isaac Newton and German mathematician Gottfried Wilhelm Leibniz discovered calculus, which led to the development of many infinite series for approximating π. Newton himself used an arcsin series to compute a 15 digit approximation of π
in 1665 or 1666, writing "I am ashamed to tell you to how many figures I
carried these computations, having no other business at the time."
In 1671, James Gregory, and independently, Leibniz in 1674, published the series:

This series, sometimes called Gregory–Leibniz series, equals π/4 when evaluated with z = 1.
In 1699, English mathematician Abraham Sharp used the Gregory–Leibniz series for  to compute π to 71 digits, breaking the previous record of 39 digits, which was set with a polygonal algorithm. The Gregory–Leibniz for
  series is simple, but converges very slowly (that is, approaches the answer gradually), so it is not used in modern π calculations.
In 1706, John Machin used the Gregory–Leibniz series to produce an algorithm that converged much faster:

Machin reached 100 digits of π with this formula. Other mathematicians created variants, now known as Machin-like formulae, that were used to set several successive records for calculating digits of π. Machin-like formulae remained the best-known method for calculating π
well into the age of computers, and were used to set records for 250
years, culminating in a 620-digit approximation in 1946 by Daniel
Ferguson – the best approximation achieved without the aid of a
calculating device.
In 1844, a record was set by Zacharias Dase, who employed a Machin-like formula to calculate 200 decimals of π in his head at the behest of German mathematician Carl Friedrich Gauss.
In 1853, British mathematician William Shanks calculated π
to 607 digits, but made a mistake in the 528th digit, rendering all
subsequent digits incorrect. Though he calculated an additional 100
digits in 1873, bring the total up to 707, his previous mistake rendered
all the new digits incorrect as well.
Rate of convergence
Some infinite series for π converge faster than others. Given the choice of two infinite series for π,
mathematicians will generally use the one that converges more rapidly
because faster convergence reduces the amount of computation needed to
calculate π to any given accuracy. A simple infinite series for π is the Gregory–Leibniz series:

As individual terms of this infinite series are added to the sum, the total gradually gets closer to π, and – with a sufficient number of terms – can get as close to π as desired. It converges quite slowly, though – after 500,000 terms, it produces only five correct decimal digits of π.
An infinite series for π (published by Nilakantha in the 15th century) that converges more rapidly than the Gregory–Leibniz series is: Note that (n − 1)n(n + 1) = n3 − n.

The following table compares the convergence rates of these two series:
| Infinite series for π |
After 1st term |
After 2nd term |
After 3rd term |
After 4th term |
After 5th term |
Converges to:
|

|
4.0000 |
2.6666 ... |
3.4666 ... |
2.8952 ... |
3.3396 ... |
π = 3.1415 ...
|

|
3.0000 |
3.1666 ... |
3.1333 ... |
3.1452 ... |
3.1396 ...
|
After five terms, the sum of the Gregory–Leibniz series is within 0.2 of the correct value of π, whereas the sum of Nilakantha's series is within 0.002 of the correct value of π. Nilakantha's series converges faster and is more useful for computing digits of π. Series that converge even faster include Machin's series and Chudnovsky's series, the latter producing 14 correct decimal digits per term.
Irrationality and transcendence
Not all mathematical advances relating to π were aimed at increasing the accuracy of approximations. When Euler solved the Basel problem in 1735, finding the exact value of the sum of the reciprocal squares, he established a connection between π and the prime numbers that later contributed to the development and study of the Riemann zeta function:

Swiss scientist Johann Heinrich Lambert in 1768 proved that π is irrational, meaning it is not equal to the quotient of any two whole numbers. Lambert's proof exploited a continued-fraction representation of the tangent function. French mathematician Adrien-Marie Legendre proved in 1794 that π2 is also irrational. In 1882, German mathematician Ferdinand von Lindemann proved that π is transcendental, confirming a conjecture made by both Legendre and Euler. Hardy and Wright states that "the proofs were afterwards modified and simplified by Hilbert, Hurwitz, and other writers".
Adoption of the symbol π
The
earliest known use of the Greek letter π to represent the ratio of a
circle's circumference to its diameter was by Welsh mathematician
William Jones in 1706
Leonhard Euler popularized the use of the Greek letter π in works he published in 1736 and 1748.
In the earliest usages, the Greek letter π was used to denote the semiperimeter (semiperipheria in Latin) of a circle. and was combined in ratios with δ (for diameter or semidiameter) or ρ (for radius) to form circle constants. (Before then, mathematicians sometimes used letters such as c or p instead.) The first recorded use is Oughtred's " ", to express the ratio of periphery and diameter in the 1647 and later editions of Clavis Mathematicae. Barrow likewise used "
 " to represent the constant 3.14..., while Gregory instead used "
 " to represent 6.28... .
The earliest known use of the Greek letter π alone to represent the ratio of a circle's circumference to its diameter was by Welsh mathematician William Jones in his 1706 work Synopsis Palmariorum Matheseos; or, a New Introduction to the Mathematics. The Greek letter first appears there in the phrase "1/2 Periphery (π)" in the discussion of a circle with radius one. However, he writes that his equations for π are from the "ready pen of the truly ingenious Mr. John Machin", leading to speculation that Machin may have employed the Greek letter before Jones.
Jones' notation was not immediately adopted by other mathematicians,
with the fraction notation still being used as late as 1767.
Euler started using the single-letter form beginning with his 1727 Essay Explaining the Properties of Air, though he used π = 6.28..., the ratio of periphery to radius, in this and some later writing. Euler first used π = 3.14... in his 1736 work Mechanica, and continued in his widely-read 1748 work Introductio in analysin infinitorum (he wrote: "for the sake of brevity we will write this number as π; thus π is equal to half the circumference of a circle of radius 1").
Because Euler corresponded heavily with other mathematicians in Europe,
the use of the Greek letter spread rapidly, and the practice was
universally adopted thereafter in the Western world, though the definition still varied between 3.14... and 6.28... as late as 1761.
Modern quest for more digits
Computer era and iterative algorithms
The Gauss–Legendre iterative algorithm:
Initialize

Iterate


Then an estimate for π is given by

The development of computers in the mid-20th century again revolutionized the hunt for digits of π. Mathematicians John Wrench and Levi Smith reached 1,120 digits in 1949 using a desk calculator. Using an inverse tangent (arctan) infinite series, a team led by George Reitwiesner and John von Neumann that same year achieved 2,037 digits with a calculation that took 70 hours of computer time on the ENIAC computer.
The record, always relying on an arctan series, was broken repeatedly
(7,480 digits in 1957; 10,000 digits in 1958; 100,000 digits in 1961)
until 1 million digits were reached in 1973.
Two additional developments around 1980 once again accelerated the ability to compute π. First, the discovery of new iterative algorithms for computing π, which were much faster than the infinite series; and second, the invention of fast multiplication algorithms that could multiply large numbers very rapidly. Such algorithms are particularly important in modern π computations because most of the computer's time is devoted to multiplication. They include the Karatsuba algorithm, Toom–Cook multiplication, and Fourier transform-based methods.
The iterative algorithms were independently published in 1975–1976 by physicist Eugene Salamin and scientist Richard Brent.
These avoid reliance on infinite series. An iterative algorithm repeats
a specific calculation, each iteration using the outputs from prior
steps as its inputs, and produces a result in each step that converges
to the desired value. The approach was actually invented over 160 years
earlier by Carl Friedrich Gauss, in what is now termed the arithmetic–geometric mean method (AGM method) or Gauss–Legendre algorithm. As modified by Salamin and Brent, it is also referred to as the Brent–Salamin algorithm.
The iterative algorithms were widely used after 1980 because they
are faster than infinite series algorithms: whereas infinite series
typically increase the number of correct digits additively in successive
terms, iterative algorithms generally multiply the number of
correct digits at each step. For example, the Brent-Salamin algorithm
doubles the number of digits in each iteration. In 1984, brothers John and Peter Borwein
produced an iterative algorithm that quadruples the number of digits in
each step; and in 1987, one that increases the number of digits five
times in each step. Iterative methods were used by Japanese mathematician Yasumasa Kanada to set several records for computing π between 1995 and 2002. This rapid convergence comes at a price: the iterative algorithms require significantly more memory than infinite series.
Motives for computing π
As mathematicians discovered new algorithms, and computers became available, the number of known decimal digits of
π increased dramatically. The vertical scale is
logarithmic.
For most numerical calculations involving π,
a handful of digits provide sufficient precision. According to Jörg
Arndt and Christoph Haenel, thirty-nine digits are sufficient to perform
most cosmological calculations, because that is the accuracy necessary to calculate the circumference of the observable universe with a precision of one atom. Accounting for additional digits needed to compensate for computational round-off errors,
Arndt concludes that a few hundred digits would suffice for any
scientific application. Despite this, people have worked strenuously to
compute π to thousands and millions of digits. This effort may be partly ascribed to the human compulsion to break records, and such achievements with π often make headlines around the world. They also have practical benefits, such as testing supercomputers, testing numerical analysis algorithms (including high-precision multiplication algorithms); and within pure mathematics itself, providing data for evaluating the randomness of the digits of π.
Rapidly convergent series
Srinivasa Ramanujan, working in isolation in India, produced many innovative series for computing
π.
Modern π
calculators do not use iterative algorithms exclusively. New infinite
series were discovered in the 1980s and 1990s that are as fast as
iterative algorithms, yet are simpler and less memory intensive. The fast iterative algorithms were anticipated in 1914, when Indian mathematician Srinivasa Ramanujan published dozens of innovative new formulae for π, remarkable for their elegance, mathematical depth and rapid convergence. One of his formulae, based on modular equations, is

This series converges much more rapidly than most arctan series, including Machin's formula. Bill Gosper was the first to use it for advances in the calculation of π, setting a record of 17 million digits in 1985. Ramanujan's formulae anticipated the modern algorithms developed by the Borwein brothers (Jonathan and Peter) and the Chudnovsky brothers. The Chudnovsky formula developed in 1987 is

It produces about 14 digits of π per term, and has been used for several record-setting π calculations, including the first to surpass 1 billion (109) digits in 1989 by the Chudnovsky brothers, 10 trillion (1013) digits in 2011 by Alexander Yee and Shigeru Kondo, over 22 trillion digits in 2016 by Peter Trueb, 50 trillion digits by Timothy Mullican in 2020 and 100 trillion digits by Emma Haruka Iwao in 2022. For similar formulas, see also the Ramanujan–Sato series.
In 2006, mathematician Simon Plouffe used the PSLQ integer relation algorithm to generate several new formulas for π, conforming to the following template:

where q is eπ (Gelfond's constant), k is an odd number, and a, b, c are certain rational numbers that Plouffe computed.
Monte Carlo methods
Random dots are placed on a square and a circle inscribed inside.
Monte Carlo methods, which evaluate the results of multiple random trials, can be used to create approximations of π. Buffon's needle is one such technique: If a needle of length ℓ is dropped n times on a surface on which parallel lines are drawn t units apart, and if x of those times it comes to rest crossing a line (x > 0), then one may approximate π based on the counts:

Another Monte Carlo method for computing π
is to draw a circle inscribed in a square, and randomly place dots in
the square. The ratio of dots inside the circle to the total number of
dots will approximately equal π/4.
Five random walks with 200 steps. The sample mean of |W200| is μ = 56/5, and so 2(200)μ−2 ≈ 3.19 is within 0.05 of π.
Another way to calculate π using probability is to start with a random walk, generated by a sequence of (fair) coin tosses: independent random variables Xk such that Xk ∈ {−1,1} with equal probabilities. The associated random walk is

so that, for each n, Wn is drawn from a shifted and scaled binomial distribution. As n varies, Wn defines a (discrete) stochastic process. Then π can be calculated by
![{\displaystyle \pi =\lim _{n\to \infty }{\frac {2n}{E[|W_{n}|]^{2}}}.}](https://wikimedia.org/api/rest_v1/media/math/render/svg/a691be63815c6b7d9fe15070ae98039d9c1d0384)
This Monte Carlo method is independent of any relation to circles, and is a consequence of the central limit theorem, discussed below.
These Monte Carlo methods for approximating π
are very slow compared to other methods, and do not provide any
information on the exact number of digits that are obtained. Thus they
are never used to approximate π when speed or accuracy is desired.
Spigot algorithms
Two algorithms were discovered in 1995 that opened up new avenues of research into π. They are called spigot algorithms because, like water dripping from a spigot, they produce single digits of π that are not reused after they are calculated.
This is in contrast to infinite series or iterative algorithms, which
retain and use all intermediate digits until the final result is
produced.
Mathematicians Stan Wagon and Stanley Rabinowitz produced a simple spigot algorithm in 1995. Its speed is comparable to arctan algorithms, but not as fast as iterative algorithms.
Another spigot algorithm, the BBP digit extraction algorithm, was discovered in 1995 by Simon Plouffe:

This formula, unlike others before it, can produce any individual hexadecimal digit of π without calculating all the preceding digits. Individual binary digits may be extracted from individual hexadecimal digits, and octal
digits can be extracted from one or two hexadecimal digits. Variations
of the algorithm have been discovered, but no digit extraction algorithm
has yet been found that rapidly produces decimal digits. An important application of digit extraction algorithms is to validate new claims of record π
computations: After a new record is claimed, the decimal result is
converted to hexadecimal, and then a digit extraction algorithm is used
to calculate several random hexadecimal digits near the end; if they
match, this provides a measure of confidence that the entire computation
is correct.
Between 1998 and 2000, the distributed computing project PiHex used Bellard's formula (a modification of the BBP algorithm) to compute the quadrillionth (1015th) bit of π, which turned out to be 0. In September 2010, a Yahoo! employee used the company's Hadoop application on one thousand computers over a 23-day period to compute 256 bits of π at the two-quadrillionth (2×10¹⁵th) bit, which also happens to be zero.
Role and characterizations in mathematics
Because π is closely related to the circle, it is found in many formulae
from the fields of geometry and trigonometry, particularly those
concerning circles, spheres, or ellipses. Other branches of science,
such as statistics, physics, Fourier analysis, and number theory, also include π in some of their important formulae.
Geometry and trigonometry
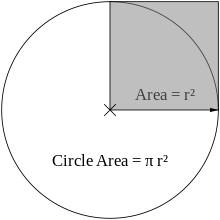
The area of the circle equals
π times the shaded area. The area of the
unit circle is
π.
π appears in formulae for areas and volumes of geometrical shapes based on circles, such as ellipses, spheres, cones, and tori. Below are some of the more common formulae that involve π.
- The circumference of a circle with radius r is 2πr.
- The area of a circle with radius r is πr2.
- The area of an ellipse with semi-major axis a and semi-minor axis b is πab.
- The volume of a sphere with radius r is 4/3πr3.
- The surface area of a sphere with radius r is 4πr2.
Some of the formulae above are special cases of the volume of the n-dimensional ball and the surface area of its boundary, the (n−1)-dimensional sphere, given below.
Apart from circles, there are other curves of constant width. By Barbier's theorem, every curve of constant width has perimeter π times its width. The Reuleaux triangle (formed by the intersection of three circles, each centered where the other two circles cross) has the smallest possible area for its width and the circle the largest. There also exist non-circular smooth curves of constant width.
Definite integrals that describe circumference, area, or volume of shapes generated by circles typically have values that involve π. For example, an integral that specifies half the area of a circle of radius one is given by:

In that integral the function √1 − x2 represents the top half of a circle (the square root is a consequence of the Pythagorean theorem), and the integral ∫1
−1 computes the area between that half of a circle and the x axis.
Units of angle
The trigonometric functions rely on angles, and mathematicians generally use radians as units of measurement. π plays an important role in angles measured in radians, which are defined so that a complete circle spans an angle of 2π radians. The angle measure of 180° is equal to π radians, and 1° = π/180 radians.
Common trigonometric functions have periods that are multiples of π; for example, sine and cosine have period 2π, so for any angle θ and any integer k,

Eigenvalues
Many of the appearances of π in the formulas of mathematics and the sciences have to do with its close relationship with geometry. However, π also appears in many natural situations having apparently nothing to do with geometry.
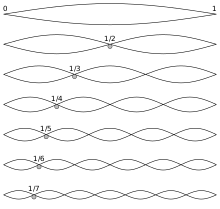
In many applications, it plays a distinguished role as an eigenvalue. For example, an idealized vibrating string can be modelled as the graph of a function f on the unit interval [0, 1], with fixed ends f(0) = f(1) = 0. The modes of vibration of the string are solutions of the differential equation  , or
, or  . Thus λ is an eigenvalue of the second derivative operator
  , and is constrained by Sturm–Liouville theory to take on only certain specific values. It must be positive, since the operator is negative definite, so it is convenient to write λ = ν2, where ν > 0 is called the wavenumber. Then f(x) = sin(π x) satisfies the boundary conditions and the differential equation with ν = π.
The value π is, in fact, the least such value of the wavenumber, and is associated with the fundamental mode of vibration of the string. One way to show this is by estimating the energy, which satisfies Wirtinger's inequality: for a function ![{\displaystyle f:[0,1]\to \mathbb {C} }](https://wikimedia.org/api/rest_v1/media/math/render/svg/f0468f15485d405d64092878cda0fc0cbdab2f62) with f(0) = f(1) = 0 and f, f ' both square integrable, we have:
with f(0) = f(1) = 0 and f, f ' both square integrable, we have:

with equality precisely when f is a multiple of sin(π x). Here π appears as an optimal constant in Wirtinger's inequality, and it follows that it is the smallest wavenumber, using the variational characterization of the eigenvalue. As a consequence, π is the smallest singular value of the derivative operator on the space of functions on [0, 1] vanishing at both endpoints (the Sobolev space ![{\displaystyle H_{0}^{1}[0,1]}](https://wikimedia.org/api/rest_v1/media/math/render/svg/7113d194de39d54621e9da47782ad5263b9f1790) ).
).
Inequalities
The number π serves appears in similar eigenvalue problems in higher-dimensional analysis. As mentioned above, it can be characterized via its role as the best constant in the isoperimetric inequality: the area A enclosed by a plane Jordan curve of perimeter P satisfies the inequality

and equality is clearly achieved for the circle, since in that case A = πr2 and P = 2πr.
Ultimately as a consequence of the isoperimetric inequality, π appears in the optimal constant for the critical Sobolev inequality in n dimensions, which thus characterizes the role of π in many physical phenomena as well, for example those of classical potential theory. In two dimensions, the critical Sobolev inequality is

for f a smooth function with compact support in R2,  is the gradient of f, and
  and
and  refer respectively to the L2 and L1-norm. The Sobolev inequality is equivalent to the isoperimetric inequality (in any dimension), with the same best constants.
Wirtinger's inequality also generalizes to higher-dimensional Poincaré inequalities that provide best constants for the Dirichlet energy of an n-dimensional membrane. Specifically, π is the greatest constant such that

for all convex subsets G of Rn of diameter 1, and square-integrable functions u on G of mean zero. Just as Wirtinger's inequality is the variational form of the Dirichlet eigenvalue problem in one dimension, the Poincaré inequality is the variational form of the Neumann eigenvalue problem, in any dimension.
Fourier transform and Heisenberg uncertainty principle
The constant π also appears as a critical spectral parameter in the Fourier transform. This is the integral transform, that takes a complex-valued integrable function f on the real line to the function defined as:

Although there are several different conventions for the Fourier transform and its inverse, any such convention must involve π somewhere. The above is the most canonical definition, however, giving the unique unitary operator on L2 that is also an algebra homomorphism of L1 to L∞.
The Heisenberg uncertainty principle also contains the number π.
The uncertainty principle gives a sharp lower bound on the extent to
which it is possible to localize a function both in space and in
frequency: with our conventions for the Fourier transform,

The physical consequence, about the uncertainty in simultaneous position and momentum observations of a quantum mechanical system, is discussed below. The appearance of π in the formulae of Fourier analysis is ultimately a consequence of the Stone–von Neumann theorem, asserting the uniqueness of the Schrödinger representation of the Heisenberg group.
Gaussian integrals
A graph of the
Gaussian function ƒ(x) = e−x2. The coloured region between the function and the
x-axis has area
√π.
The fields of probability and statistics frequently use the normal distribution
as a simple model for complex phenomena; for example, scientists
generally assume that the observational error in most experiments
follows a normal distribution. The Gaussian function, which is the probability density function of the normal distribution with mean μ and standard deviation σ, naturally contains π:

The factor of  makes the area under the graph of f equal to one, as is required for a probability distribution. This follows from a change of variables in the Gaussian integral:

which says that the area under the basic bell curve in the figure is equal to the square root of π.
The central limit theorem explains the central role of normal distributions, and thus of π, in probability and statistics. This theorem is ultimately connected with the spectral characterization of π
as the eigenvalue associated with the Heisenberg uncertainty principle,
and the fact that equality holds in the uncertainty principle only for
the Gaussian function. Equivalently, π is the unique constant making the Gaussian normal distribution e-πx2 equal to its own Fourier transform. Indeed, according to Howe (1980), the "whole business" of establishing the fundamental theorems of Fourier analysis reduces to the Gaussian integral.
Projective geometry
Let V be the set of all twice differentiable real functions  that satisfy the ordinary differential equation
  . Then V is a two-dimensional real vector space, with two parameters corresponding to a pair of initial conditions for the differential equation. For any
  , let
, let  be the evaluation functional, which associates to each
  the value
  of the function f at the real point t. Then, for each t, the kernel of
  is a one-dimensional linear subspace of V. Hence
  defines a function from
  from the real line to the real projective line. This function is periodic, and the quantity π can be characterized as the period of this map.
Topology
The constant π appears in the Gauss–Bonnet formula which relates the differential geometry of surfaces to their topology. Specifically, if a compact surface Σ has Gauss curvature K, then

where χ(Σ) is the Euler characteristic, which is an integer. An example is the surface area of a sphere S of curvature 1 (so that its radius of curvature, which coincides with its radius, is also 1.) The Euler characteristic of a sphere can be computed from its homology groups and is found to be equal to two. Thus we have

reproducing the formula for the surface area of a sphere of radius 1.
The constant appears in many other integral formulae in topology, in particular, those involving characteristic classes via the Chern–Weil homomorphism.
Vector calculus
Vector calculus is a branch of calculus that is concerned with the properties of vector fields, and has many physical applications such as to electricity and magnetism. The Newtonian potential for a point source Q situated at the origin of a three-dimensional Cartesian coordinate system is

which represents the potential energy of a unit mass (or charge) placed a distance |x| from the source, and k is a dimensional constant. The field, denoted here by E, which may be the (Newtonian) gravitational field or the (Coulomb) electric field, is the negative gradient of the potential:

Special cases include Coulomb's law and Newton's law of universal gravitation. Gauss' law states that the outward flux of the field through any smooth, simple, closed, orientable surface S containing the origin is equal to 4πkQ:


It is standard to absorb this factor of 4π into the constant k, but this argument shows why it must appear somewhere. Furthermore, 4π is the surface area of the unit sphere, but we have not assumed that S is the sphere. However, as a consequence of the divergence theorem, because the region away from the origin is vacuum (source-free) it is only the homology class of the surface S in R3\{0}
that matters in computing the integral, so it can be replaced by any
convenient surface in the same homology class, in particular, a sphere,
where spherical coordinates can be used to calculate the integral.
A consequence of the Gauss law is that the negative Laplacian of the potential V is equal to 4πkQ times the Dirac delta function:

More general distributions of matter (or charge) are obtained from this by convolution, giving the Poisson equation

where ρ is the distribution function.
The constant π also plays an analogous role in four-dimensional potentials associated with Einstein's equations, a fundamental formula which forms the basis of the general theory of relativity and describes the fundamental interaction of gravitation as a result of spacetime being curved by matter and energy:

where Rμν is the Ricci curvature tensor, R is the scalar curvature, gμν is the metric tensor, Λ is the cosmological constant, G is Newton's gravitational constant, c is the speed of light in vacuum, and Tμν is the stress–energy tensor.
The left-hand side of Einstein's equation is a non-linear analogue of
the Laplacian of the metric tensor, and reduces to that in the weak
field limit, with the  term playing the role of a Lagrange multiplier, and the right-hand side is the analogue of the distribution function, times 8π.
Cauchy's integral formula
Complex
analytic functions can be visualized as a collection of streamlines and
equipotentials, systems of curves intersecting at right angles. Here
illustrated is the complex logarithm of the Gamma function.
One of the key tools in complex analysis is contour integration of a function over a positively oriented (rectifiable) Jordan curve γ. A form of Cauchy's integral formula states that if a point z0 is interior to γ, then

Although the curve γ is not a circle, and hence does not have any obvious connection to the constant π, a standard proof of this result uses Morera's theorem, which implies that the integral is invariant under homotopy
of the curve, so that it can be deformed to a circle and then
integrated explicitly in polar coordinates. More generally, it is true
that if a rectifiable closed curve γ does not contain z0, then the above integral is 2πi times the winding number of the curve.
The general form of Cauchy's integral formula establishes the relationship between the values of a complex analytic function f(z) on the Jordan curve γ and the value of f(z) at any interior point z0 of γ:

provided f(z) is analytic in the region enclosed by γ and extends continuously to γ. Cauchy's integral formula is a special case of the residue theorem, that if g(z) is a meromorphic function the region enclosed by γ and is continuous in a neighbourhood of γ, then

where the sum is of the residues at the poles of g(z).
The gamma function and Stirling's approximation
Plot of the gamma function on the real axis
The factorial function  is the product of all of the positive integers through n. The gamma function extends the concept of factorial (normally defined only for non-negative integers) to all complex numbers, except the negative real integers, with the identity
  . When the gamma function is evaluated at half-integers, the result contains π. For example,
  and
and  .
.
The gamma function is defined by its Weierstrass product development:

where γ is the Euler–Mascheroni constant. Evaluated at z = 1/2 and squared, the equation Γ(1/2)2 = π reduces to the Wallis product formula. The gamma function is also connected to the Riemann zeta function and identities for the functional determinant, in which the constant π plays an important role.
The gamma function is used to calculate the volume Vn(r) of the n-dimensional ball of radius r in Euclidean n-dimensional space, and the surface area Sn−1(r) of its boundary, the (n−1)-dimensional sphere:


Further, it follows from the functional equation that

The gamma function can be used to create a simple approximation to the factorial function n! for large n:  which is known as Stirling's approximation. Equivalently,

As a geometrical application of Stirling's approximation, let Δn denote the standard simplex in n-dimensional Euclidean space, and (n + 1)Δn denote the simplex having all of its sides scaled up by a factor of n + 1. Then

Ehrhart's volume conjecture is that this is the (optimal) upper bound on the volume of a convex body containing only one lattice point.
Number theory and Riemann zeta function
Each prime has an associated
Prüfer group, which are arithmetic localizations of the circle. The
L-functions of analytic number theory are also localized in each prime
p.
The Riemann zeta function ζ(s) is used in many areas of mathematics. When evaluated at s = 2 it can be written as

Finding a simple solution for this infinite series was a famous problem in mathematics called the Basel problem. Leonhard Euler solved it in 1735 when he showed it was equal to π2/6. Euler's result leads to the number theory result that the probability of two random numbers being relatively prime (that is, having no shared factors) is equal to 6/π2. This probability is based on the observation that the probability that any number is divisible by a prime p is 1/p (for example, every 7th integer is divisible by 7.) Hence the probability that two numbers are both divisible by this prime is 1/p2, and the probability that at least one of them is not is 1 − 1/p2.
For distinct primes, these divisibility events are mutually
independent; so the probability that two numbers are relatively prime is
given by a product over all primes:
![{\displaystyle {\begin{aligned}\prod _{p}^{\infty }\left(1-{\frac {1}{p^{2}}}\right)&=\left(\prod _{p}^{\infty }{\frac {1}{1-p^{-2}}}\right)^{-1}\\[4pt]&={\frac {1}{1+{\frac {1}{2^{2}}}+{\frac {1}{3^{2}}}+\cdots }}\\[4pt]&={\frac {1}{\zeta (2)}}={\frac {6}{\pi ^{2}}}\approx 61\%.\end{aligned}}}](https://wikimedia.org/api/rest_v1/media/math/render/svg/33ad11b6609d91487577949c7a42872afdc33a36)
This probability can be used in conjunction with a random number generator to approximate π using a Monte Carlo approach.
The solution to the Basel problem implies that the geometrically derived quantity π is connected in a deep way to the distribution of prime numbers. This is a special case of Weil's conjecture on Tamagawa numbers, which asserts the equality of similar such infinite products of arithmetic quantities, localized at each prime p, and a geometrical quantity: the reciprocal of the volume of a certain locally symmetric space. In the case of the Basel problem, it is the hyperbolic 3-manifold SL2(R)/SL2(Z).
The zeta function also satisfies Riemann's functional equation, which involves π as well as the gamma function:

Furthermore, the derivative of the zeta function satisfies

A consequence is that π can be obtained from the functional determinant of the harmonic oscillator. This functional determinant can be computed via a product expansion, and is equivalent to the Wallis product formula. The calculation can be recast in quantum mechanics, specifically the variational approach to the spectrum of the hydrogen atom.
Fourier series
The constant π also appears naturally in Fourier series of periodic functions. Periodic functions are functions on the group T =R/Z of fractional parts of real numbers. The Fourier decomposition shows that a complex-valued function f on T can be written as an infinite linear superposition of unitary characters of T. That is, continuous group homomorphisms from T to the circle group U(1) of unit modulus complex numbers. It is a theorem that every character of T is one of the complex exponentials  .
.
There is a unique character on T, up to complex conjugation, that is a group isomorphism. Using the Haar measure on the circle group, the constant π is half the magnitude of the Radon–Nikodym derivative of this character. The other characters have derivatives whose magnitudes are positive integral multiples of 2π. As a result, the constant π is the unique number such that the group T, equipped with its Haar measure, is Pontrjagin dual to the lattice of integral multiples of 2π. This is a version of the one-dimensional Poisson summation formula.
Modular forms and theta functions
Theta functions transform under the
lattice of periods of an elliptic curve.
The constant π is connected in a deep way with the theory of modular forms and theta functions. For example, the Chudnovsky algorithm involves in an essential way the j-invariant of an elliptic curve.
Modular forms are holomorphic functions in the upper half plane characterized by their transformation properties under the modular group  (or its various subgroups), a lattice in the group
  . An example is the Jacobi theta function

which is a kind of modular form called a Jacobi form. This is sometimes written in terms of the nome  .
.
The constant π is the unique constant making the Jacobi theta function an automorphic form, which means that it transforms in a specific way. Certain identities hold for all automorphic forms. An example is

which implies that θ transforms as a representation under the discrete Heisenberg group. General modular forms and other theta functions also involve π, once again because of the Stone–von Neumann theorem.
Cauchy distribution and potential theory
The Cauchy distribution

is a probability density function. The total probability is equal to one, owing to the integral:

The Shannon entropy of the Cauchy distribution is equal to ln(4π), which also involves π.
The Cauchy distribution plays an important role in potential theory because it is the simplest Furstenberg measure, the classical Poisson kernel associated with a Brownian motion in a half-plane. Conjugate harmonic functions and so also the Hilbert transform are associated with the asymptotics of the Poisson kernel. The Hilbert transform H is the integral transform given by the Cauchy principal value of the singular integral

The constant π is the unique (positive) normalizing factor such that H defines a linear complex structure on the Hilbert space of square-integrable real-valued functions on the real line.
The Hilbert transform, like the Fourier transform, can be
characterized purely in terms of its transformation properties on the
Hilbert space L2(R): up
to a normalization factor, it is the unique bounded linear operator that
commutes with positive dilations and anti-commutes with all reflections
of the real line. The constant π is the unique normalizing factor that makes this transformation unitary.
In the Mandelbrot set
An occurrence of π in the fractal called the Mandelbrot set was discovered by David Boll in 1991. He examined the behaviour of the Mandelbrot set near the "neck" at (−0.75, 0). When the number of iterations until divergence for the point (−0.75, ε) is multiplied by ε, the result approaches π as ε approaches zero. The point (0.25 + ε, 0)
at the cusp of the large "valley" on the right side of the Mandelbrot
set behaves similarly: the number of iterations until divergence
multiplied by the square root of ε tends to π.
Outside mathematics
Describing physical phenomena
Although not a physical constant, π appears routinely in equations describing fundamental principles of the universe, often because of π's relationship to the circle and to spherical coordinate systems. A simple formula from the field of classical mechanics gives the approximate period T of a simple pendulum of length L, swinging with a small amplitude (g is the earth's gravitational acceleration):

One of the key formulae of quantum mechanics is Heisenberg's uncertainty principle, which shows that the uncertainty in the measurement of a particle's position (Δx) and momentum (Δp) cannot both be arbitrarily small at the same time (where h is Planck's constant):

The fact that π is approximately equal to 3 plays a role in the relatively long lifetime of orthopositronium. The inverse lifetime to lowest order in the fine-structure constant α is

where m is the mass of the electron.
π is present in some structural engineering formulae, such as the buckling formula derived by Euler, which gives the maximum axial load F that a long, slender column of length L, modulus of elasticity E, and area moment of inertia I can carry without buckling:

The field of fluid dynamics contains π in Stokes' law, which approximates the frictional force F exerted on small, spherical objects of radius R, moving with velocity v in a fluid with dynamic viscosity η:

In electromagnetics, the vacuum permeability constant μ0 appears in Maxwell's equations, which describe the properties of electric and magnetic fields and electromagnetic radiation. Before 20 May 2019, it was defined as exactly

A relation for the speed of light in vacuum, c can be derived from Maxwell's equations in the medium of classical vacuum using a relationship between μ0 and the electric constant (vacuum permittivity), ε0 in SI units:

Under ideal conditions (uniform gentle slope on a homogeneously erodible substrate), the sinuosity of a meandering river approaches π.
The sinuosity is the ratio between the actual length and the
straight-line distance from source to mouth. Faster currents along the
outside edges of a river's bends cause more erosion than along the
inside edges, thus pushing the bends even farther out, and increasing
the overall loopiness of the river. However, that loopiness eventually
causes the river to double back on itself in places and "short-circuit",
creating an ox-bow lake in the process. The balance between these two opposing factors leads to an average ratio of π between the actual length and the direct distance between source and mouth.
Memorizing digits
Piphilology is the practice of memorizing large numbers of digits of π, and world-records are kept by the Guinness World Records. The record for memorizing digits of π,
certified by Guinness World Records, is 70,000 digits, recited in India
by Rajveer Meena in 9 hours and 27 minutes on 21 March 2015. In 2006, Akira Haraguchi,
a retired Japanese engineer, claimed to have recited 100,000 decimal
places, but the claim was not verified by Guinness World Records.
One common technique is to memorize a story or poem in which the word lengths represent the digits of π:
The first word has three letters, the second word has one, the third
has four, the fourth has one, the fifth has five, and so on. Such
memorization aids are called mnemonics. An early example of a mnemonic for pi, originally devised by English scientist James Jeans, is "How I want a drink, alcoholic of course, after the heavy lectures involving quantum mechanics." When a poem is used, it is sometimes referred to as a piem. Poems for memorizing π have been composed in several languages in addition to English. Record-setting π memorizers typically do not rely on poems, but instead use methods such as remembering number patterns and the method of loci.
A few authors have used the digits of π to establish a new form of constrained writing, where the word lengths are required to represent the digits of π. The Cadaeic Cadenza contains the first 3835 digits of π in this manner, and the full-length book Not a Wake contains 10,000 words, each representing one digit of π.
In popular culture
A pi pie.
Pies are circular, and "pie" and
π are
homophones, making pie a frequent subject of pi
puns.
Perhaps because of the simplicity of its definition and its ubiquitous presence in formulae, π has been represented in popular culture more than other mathematical constructs.
In the 2008 Open University and BBC documentary co-production, The Story of Maths, aired in October 2008 on BBC Four, British mathematician Marcus du Sautoy shows a visualization of the – historically first exact – formula for calculating π when visiting India and exploring its contributions to trigonometry.
In the Palais de la Découverte (a science museum in Paris) there is a circular room known as the pi room. On its wall are inscribed 707 digits of π.
The digits are large wooden characters attached to the dome-like
ceiling. The digits were based on an 1873 calculation by English
mathematician William Shanks, which included an error beginning at the 528th digit. The error was detected in 1946 and corrected in 1949.
In Carl Sagan's 1985 novel Contact it is suggested that the creator of the universe buried a message deep within the digits of π. The digits of π have also been incorporated into the lyrics of the song "Pi" from the 2005 album Aerial by Kate Bush.
In the 1967 Star Trek episode "Wolf in the Fold", an out-of-control computer is contained by being instructed to "Compute to the last digit the value of π", even though "π is a transcendental figure without resolution".
In the United States, Pi Day falls on 14 March (written 3/14 in the US style), and is popular among students. π and its digital representation are often used by self-described "math geeks" for inside jokes among mathematically and technologically minded groups. Several college cheers at the Massachusetts Institute of Technology include "3.14159". Pi Day in 2015 was particularly significant because the date and time 3/14/15 9:26:53 reflected many more digits of pi.
In parts of the world where dates are commonly noted in day/month/year
format, 22 July represents "Pi Approximation Day," as 22/7 = 3.142857.
During the 2011 auction for Nortel's portfolio of valuable technology patents, Google made a series of unusually specific bids based on mathematical and scientific constants, including π.
In 1958 Albert Eagle proposed replacing π by τ (tau), where τ = π/2, to simplify formulas. However, no other authors are known to use τ in this way. Some people use a different value, τ = 2π = 6.28318..., arguing that τ, as the number of radians in one turn, or as the ratio of a circle's circumference to its radius rather than its diameter, is more natural than π and simplifies many formulas. Celebrations of this number, because it approximately equals 6.28, by making 28 June "Tau Day" and eating "twice the pie", have been reported in the media. However, this use of τ has not made its way into mainstream mathematics. Tau was added to the Python programming language (as math.tau) in version 3.6.
In 1897, an amateur mathematician attempted to persuade the Indiana legislature to pass the Indiana Pi Bill, which described a method to square the circle and contained text that implied various incorrect values for π,
including 3.2. The bill is notorious as an attempt to establish a value
of mathematical constant by legislative fiat. The bill was passed by
the Indiana House of Representatives, but rejected by the Senate,
meaning it did not become a law.
In computer culture
In contemporary internet culture, individuals and organizations frequently pay homage to the number π. For instance, the computer scientist Donald Knuth let the version numbers of his program TeX approach π. The versions are 3, 3.1, 3.14, and so forth.












![{\displaystyle \pi =\lim _{n\to \infty }{\frac {2n}{E[|W_{n}|]^{2}}}.}](https://wikimedia.org/api/rest_v1/media/math/render/svg/a691be63815c6b7d9fe15070ae98039d9c1d0384)





![{\displaystyle f:[0,1]\to \mathbb {C} }](https://wikimedia.org/api/rest_v1/media/math/render/svg/f0468f15485d405d64092878cda0fc0cbdab2f62)

![{\displaystyle H_{0}^{1}[0,1]}](https://wikimedia.org/api/rest_v1/media/math/render/svg/7113d194de39d54621e9da47782ad5263b9f1790)




![{\displaystyle {\begin{aligned}\prod _{p}^{\infty }\left(1-{\frac {1}{p^{2}}}\right)&=\left(\prod _{p}^{\infty }{\frac {1}{1-p^{-2}}}\right)^{-1}\\[4pt]&={\frac {1}{1+{\frac {1}{2^{2}}}+{\frac {1}{3^{2}}}+\cdots }}\\[4pt]&={\frac {1}{\zeta (2)}}={\frac {6}{\pi ^{2}}}\approx 61\%.\end{aligned}}}](https://wikimedia.org/api/rest_v1/media/math/render/svg/33ad11b6609d91487577949c7a42872afdc33a36)


