Search This Blog

Tuesday, October 4, 2022

Sediment

From Wikipedia, the free encyclopedia
 
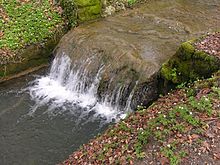
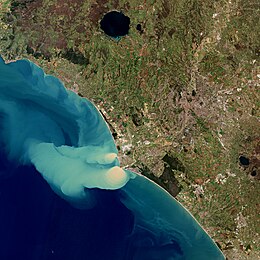
River discharging sediment into the ocean

Sediment is a naturally occurring material that is broken down by processes of weathering and erosion, and is subsequently transported by the action of wind, water, or ice or by the force of gravity acting on the particles. For example, sand and silt can be carried in suspension in river water and on reaching the sea bed deposited by sedimentation; if buried, they may eventually become sandstone and siltstone (sedimentary rocks) through lithification.

Sediments are most often transported by water (fluvial processes), but also wind (aeolian processes) and glaciers. Beach sands and river channel deposits are examples of fluvial transport and deposition, though sediment also often settles out of slow-moving or standing water in lakes and oceans. Desert sand dunes and loess are examples of aeolian transport and deposition. Glacial moraine deposits and till are ice-transported sediments.

Classification

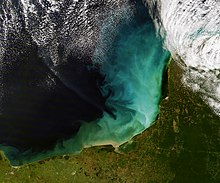
Sediment in the Gulf of Mexico
 
Sediment off the Yucatán Peninsula

Sediment can be classified based on its grain size, grain shape, and composition.

Grain size

Sediment size is measured on a log base 2 scale, called the "Phi" scale, which classifies particles by size from "colloid" to "boulder".

φ scale Size range
(metric)
Size range
(inches)
Aggregate class
(Wentworth)
Other names
< −8 > 256 mm > 10.1 in Boulder
−6 to −8 64–256 mm 2.5–10.1 in Cobble
−5 to −6 32–64 mm 1.26–2.5 in Very coarse gravel Pebble
−4 to −5 16–32 mm 0.63–1.26 in Coarse gravel Pebble
−3 to −4 8–16 mm 0.31–0.63 in Medium gravel Pebble
−2 to −3 4–8 mm 0.157–0.31 in Fine gravel Pebble
−1 to −2 2–4 mm 0.079–0.157 in Very fine gravel Granule
0 to −1 1–2 mm 0.039–0.079 in Very coarse sand
1 to 0 0.5–1 mm 0.020–0.039 in Coarse sand
2 to 1 0.25–0.5 mm 0.010–0.020 in Medium sand
3 to 2 125–250 μm 0.0049–0.010 in Fine sand
4 to 3 62.5–125 μm 0.0025–0.0049 in Very fine sand
8 to 4 3.9–62.5 μm 0.00015–0.0025 in Silt Mud
> 8 < 3.9 μm < 0.00015 in Clay Mud
> 10 < 1 μm < 0.000039 in Colloid Mud

Shape

Schematic representation of difference in grain shape. Two parameters are shown: sphericity (vertical) and rounding (horizontal).

The shape of particles can be defined in terms of three parameters. The form is the overall shape of the particle, with common descriptions being spherical, platy, or rodlike. The roundness is a measure of how sharp grain corners are. This varies from well-rounded grains with smooth corners and edges to poorly rounded grains with sharp corners and edges. Finally, surface texture describes small-scale features such as scratches, pits, or ridges on the surface of the grain.

Form

Form (also called sphericity) is determined by measuring the size of the particle on its major axes. William C. Krumbein proposed formulas for converting these numbers to a single measure of form, such as

where , , and are the long, intermediate, and short axis lengths of the particle. The form varies from 1 for a perfectly spherical particle to very small values for a platelike or rodlike particle.

An alternate measure was proposed by Sneed and Folk:

which, again, varies from 0 to 1 with increasing sphericity.

Roundness

Comparison chart for evaluating roundness of sediment grains

Roundness describes how sharp the edges and corners of particle are. Complex mathematical formulas have been devised for its precise measurement, but these are difficult to apply, and most geologists estimate roundness from comparison charts. Common descriptive terms range from very angular to angular to subangular to subrounded to rounded to very rounded, with increasing degree of roundness.

Surface texture

Surface texture describes the small-scale features of a grain, such as pits, fractures, ridges, and scratches. These are most commonly evaluated on quartz grains, because these retain their surface markings for long periods of time. Surface texture varies from polished to frosted, and can reveal the history of transport of the grain; for example, frosted grains are particularly characteristic of aeolian sediments, transported by wind. Evaluation of these features often requires the use of a scanning electron microscope.

Composition

Composition of sediment can be measured in terms of:

This leads to an ambiguity in which clay can be used as both a size-range and a composition (see clay minerals).

Sediment transport

Sediment builds up on human-made breakwaters because they reduce the speed of water flow, so the stream cannot carry as much sediment load.
 
Glacial transport of boulders. These boulders will be deposited as the glacier retreats.
 

Sediment is transported based on the strength of the flow that carries it and its own size, volume, density, and shape. Stronger flows will increase the lift and drag on the particle, causing it to rise, while larger or denser particles will be more likely to fall through the flow.

Fluvial processes: rivers, streams, and overland flow

Particle motion

Rivers and streams carry sediment in their flows. This sediment can be in a variety of locations within the flow, depending on the balance between the upwards velocity on the particle (drag and lift forces), and the settling velocity of the particle. These relationships are shown in the following table for the Rouse number, which is a ratio of sediment settling velocity (fall velocity) to upwards velocity.

where

Hjulström curve: the velocities of currents required for erosion, transportation, and deposition (sedimentation) of sediment particles of different sizes
 
Mode of transport Rouse number
Bed load >2.5
Suspended load: 50% Suspended >1.2, <2.5
Suspended load: 100% Suspended >0.8, <1.2
Wash load <0.8

If the upwards velocity is approximately equal to the settling velocity, sediment will be transported downstream entirely as suspended load. If the upwards velocity is much less than the settling velocity, but still high enough for the sediment to move (see Initiation of motion), it will move along the bed as bed load by rolling, sliding, and saltating (jumping up into the flow, being transported a short distance then settling again). If the upwards velocity is higher than the settling velocity, the sediment will be transported high in the flow as wash load.

As there are generally a range of different particle sizes in the flow, it is common for material of different sizes to move through all areas of the flow for given stream conditions.

Fluvial bedforms

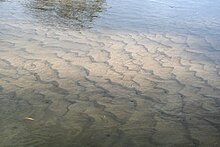
Modern asymmetric ripples developed in sand on the floor of the Hunter River, New South Wales, Australia. Flow direction is from right to left.
 
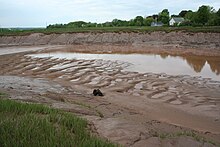
Sinuous-crested dunes exposed at low tide in the Cornwallis River near Wolfville, Nova Scotia
 
Ancient channel deposit in the Stellarton Formation (Pennsylvanian), Coalburn Pit, near Thorburn, Nova Scotia.

Sediment motion can create self-organized structures such as ripples, dunes, or antidunes on the river or stream bed. These bedforms are often preserved in sedimentary rocks and can be used to estimate the direction and magnitude of the flow that deposited the sediment.

Surface runoff

Overland flow can erode soil particles and transport them downslope. The erosion associated with overland flow may occur through different methods depending on meteorological and flow conditions.

  • If the initial impact of rain droplets dislodges soil, the phenomenon is called rainsplash erosion.
  • If overland flow is directly responsible for sediment entrainment but does not form gullies, it is called "sheet erosion".
  • If the flow and the substrate permit channelization, gullies may form; this is termed "gully erosion".

Key fluvial depositional environments

The major fluvial (river and stream) environments for deposition of sediments include:

Aeolian processes: wind

Wind results in the transportation of fine sediment and the formation of sand dune fields and soils from airborne dust.

Glacial processes

Glacial sediments from Montana

Glaciers carry a wide range of sediment sizes, and deposit it in moraines.

Mass balance

The overall balance between sediment in transport and sediment being deposited on the bed is given by the Exner equation. This expression states that the rate of increase in bed elevation due to deposition is proportional to the amount of sediment that falls out of the flow. This equation is important in that changes in the power of the flow change the ability of the flow to carry sediment, and this is reflected in the patterns of erosion and deposition observed throughout a stream. This can be localized, and simply due to small obstacles; examples are scour holes behind boulders, where flow accelerates, and deposition on the inside of meander bends. Erosion and deposition can also be regional; erosion can occur due to dam removal and base level fall. Deposition can occur due to dam emplacement that causes the river to pool and deposit its entire load, or due to base level rise.

Shores and shallow seas

Seas, oceans, and lakes accumulate sediment over time. The sediment can consist of terrigenous material, which originates on land, but may be deposited in either terrestrial, marine, or lacustrine (lake) environments, or of sediments (often biological) originating in the body of water. Terrigenous material is often supplied by nearby rivers and streams or reworked marine sediment (e.g. sand). In the mid-ocean, the exoskeletons of dead organisms are primarily responsible for sediment accumulation.

Deposited sediments are the source of sedimentary rocks, which can contain fossils of the inhabitants of the body of water that were, upon death, covered by accumulating sediment. Lake bed sediments that have not solidified into rock can be used to determine past climatic conditions.

Key marine depositional environments

Holocene eolianite and a carbonate beach on Long Island, Bahamas

The major areas for deposition of sediments in the marine environment include:

  • Littoral sands (e.g. beach sands, runoff river sands, coastal bars and spits, largely clastic with little faunal content)
  • The continental shelf (silty clays, increasing marine faunal content).
  • The shelf margin (low terrigenous supply, mostly calcareous faunal skeletons)
  • The shelf slope (much more fine-grained silts and clays)
  • Beds of estuaries with the resultant deposits called "bay mud".

One other depositional environment which is a mixture of fluvial and marine is the turbidite system, which is a major source of sediment to the deep sedimentary and abyssal basins as well as the deep oceanic trenches.

Any depression in a marine environment where sediments accumulate over time is known as a sediment trap.

The null point theory explains how sediment deposition undergoes a hydrodynamic sorting process within the marine environment leading to a seaward fining of sediment grain size.

Environmental issues

Erosion and agricultural sediment delivery to rivers

One cause of high sediment loads is slash and burn and shifting cultivation of tropical forests. When the ground surface is stripped of vegetation and then seared of all living organisms, the upper soils are vulnerable to both wind and water erosion. In a number of regions of the earth, entire sectors of a country have become erodible. For example, on the Madagascar high central plateau, which constitutes approximately ten percent of that country's land area, most of the land area is devegetated, and gullies have eroded into the underlying soil to form distinctive gulleys called lavakas. These are typically 40 meters (130 ft) wide, 80 meters (260 ft) long and 15 meters (49 ft) deep. Some areas have as many as 150 lavakas/square kilometer, and lavakas may account for 84% of all sediments carried off by rivers. This siltation results in discoloration of rivers to a dark red brown color and leads to fish kills.

Erosion is also an issue in areas of modern farming, where the removal of native vegetation for the cultivation and harvesting of a single type of crop has left the soil unsupported. Many of these regions are near rivers and drainages. Loss of soil due to erosion removes useful farmland, adds to sediment loads, and can help transport anthropogenic fertilizers into the river system, which leads to eutrophication.

The Sediment Delivery Ratio (SDR) is fraction of gross erosion (interill, rill, gully and stream erosion) that is expected to be delivered to the outlet of the river. The sediment transfer and deposition can be modelled with sediment distribution models such as WaTEM/SEDEM. In Europe, according to WaTEM/SEDEM model estimates the Sediment Delivery Ratio is about 15%.

Coastal development and sedimentation near coral reefs

Watershed development near coral reefs is a primary cause of sediment-related coral stress. The stripping of natural vegetation in the watershed for development exposes soil to increased wind and rainfall, and as a result, can cause exposed sediment to become more susceptible to erosion and delivery to the marine environment during rainfall events. Sediment can negatively affect corals in many ways, such as by physically smothering them, abrading their surfaces, causing corals to expend energy during sediment removal, and causing algal blooms that can ultimately lead to less space on the seafloor where juvenile corals (polyps) can settle.

When sediments are introduced into the coastal regions of the ocean, the proportion of land, marine and organic-derived sediment that characterizes the seafloor near sources of sediment output is altered. In addition, because the source of sediment (i.e. land, ocean, or organically) is often correlated with how coarse or fine sediment grain sizes that characterize an area are on average, grain size distribution of sediment will shift according to relative input of land (typically fine), marine (typically coarse), and organically-derived (variable with age) sediment. These alterations in marine sediment characterize the amount of sediment that is suspended in the water column at any given time and sediment-related coral stress. 

Biological considerations

In July 2020, marine biologists reported that aerobic microorganisms (mainly), in "quasi-suspended animation", were found in organically-poor sediments, up to 101.5 million years old, 250 feet below the seafloor in the South Pacific Gyre (SPG) ("the deadest spot in the ocean"), and could be the longest-living life forms ever found.
Dead reckoning

From Wikipedia, the free encyclopedia

The navigator plots their 9 a.m. position, indicated by the triangle, and, using their course and speed, estimates their own position at 9:30 and 10 a.m.

In navigation, dead reckoning is the process of calculating current position of some moving object by using a previously determined position, or fix, and then incorporating estimates of speed, heading direction, and course over elapsed time. The corresponding term in biology, used to describe the processes by which animals update their estimates of position or heading, is path integration.

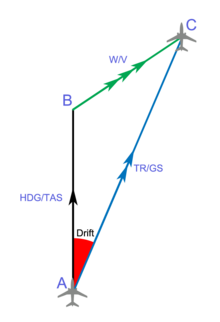
Drift is the angle between the heading of the airplane and the desired track. A is the last known position (fix, usually shown with a circle). B is the wind direction (usually shown with a plus sign). C is true position (usually shown with a triangle).

Dead reckoning is subject to cumulative errors. Advances in navigational aids that give accurate information on position, in particular satellite navigation using the Global Positioning System, have made simple dead reckoning by humans obsolete for most purposes. However, inertial navigation systems, which provide very accurate directional information, use dead reckoning and are very widely applied.

Etymology

The term "dead reckoning" was not originally used to abbreviate "deduced reckoning," nor is it a misspelling of the term "ded reckoning." The use of "ded" or "deduced reckoning" is not known to have appeared earlier than 1931, much later in history than "dead reckoning" appearing as early as 1613 in the Oxford English Dictionary. The original intention of "dead" in the term is not clear however. Whether it is used to convey "absolute" as in "dead ahead," reckoning using other objects that are "dead in the water," or using reckoning properly "you’re dead if you don’t reckon right," is not known.

By analogy with their navigational use, the words dead reckoning are also used to mean the process of estimating the value of any variable quantity by using an earlier value and adding whatever changes have occurred in the meantime. Often, this usage implies that the changes are not known accurately. The earlier value and the changes may be measured or calculated quantities.

Errors

While dead reckoning can give the best available information on the present position with little math or analysis, it is subject to significant errors of approximation. For precise positional information, both speed and direction must be accurately known at all times during travel. Most notably, dead reckoning does not account for directional drift during travel through a fluid medium. These errors tend to compound themselves over greater distances, making dead reckoning a difficult method of navigation for longer journeys.

For example, if displacement is measured by the number of rotations of a wheel, any discrepancy between the actual and assumed traveled distance per rotation, due perhaps to slippage or surface irregularities, will be a source of error. As each estimate of position is relative to the previous one, errors are cumulative, or compounding, over time.

The accuracy of dead reckoning can be increased significantly by using other, more reliable methods to get a new fix part way through the journey. For example, if one was navigating on land in poor visibility, then dead reckoning could be used to get close enough to the known position of a landmark to be able to see it, before walking to the landmark itself — giving a precisely known start point — and then setting off again.

Localization of mobile sensor nodes

Localizing a static sensor node is not a difficult task because attaching a GPS device suffices the need of localization. But a mobile sensor node, which continuously changes its geographical location with time is difficult to localize. Mostly mobile sensor nodes within some particular domain for data collection can be used, i.e, sensor node attached to an animal within a grazing field or attached to a soldier on a battlefield. Within these scenarios a GPS device for each sensor node cannot be afforded. Some of the reasons for this include cost, size and battery drainage of constrained sensor nodes. To overcome this problem a limited number of reference nodes (with GPS) within a field is employed. These nodes continuously broadcast their locations and other nodes in proximity receive these locations and calculate their position using some mathematical technique like trilateration. For localization, at least three known reference locations are necessary to localize. Several localization algorithms based on Sequential Monte Carlo (SMC) method have been proposed in literature. Sometimes a node at some places receives only two known locations and hence it becomes impossible to localize. To overcome this problem, dead reckoning technique is used. With this technique a sensor node uses its previous calculated location for localization at later time intervals. For example, at time instant 1 if node A calculates its position as loca_1 with the help of three known reference locations; then at time instant 2 it uses loca_1 along with two other reference locations received from other two reference nodes. This not only localizes a node in less time but also localizes in positions where it is difficult to get three reference locations.

Animal navigation

In studies of animal navigation, dead reckoning is more commonly (though not exclusively) known as path integration. Animals use it to estimate their current location based on their movements from their last known location. Animals such as ants, rodents, and geese have been shown to track their locations continuously relative to a starting point and to return to it, an important skill for foragers with a fixed home.

Vehicular navigation

Marine

Dead reckoning navigation tools in coastal navigation

In marine navigation a "dead" reckoning plot generally does not take into account the effect of currents or wind. Aboard ship a dead reckoning plot is considered important in evaluating position information and planning the movement of the vessel.

Dead reckoning begins with a known position, or fix, which is then advanced, mathematically or directly on the chart, by means of recorded heading, speed, and time. Speed can be determined by many methods. Before modern instrumentation, it was determined aboard ship using a chip log. More modern methods include pit log referencing engine speed (e.g. in rpm) against a table of total displacement (for ships) or referencing one's indicated airspeed fed by the pressure from a pitot tube. This measurement is converted to an equivalent airspeed based upon known atmospheric conditions and measured errors in the indicated airspeed system. A naval vessel uses a device called a pit sword (rodmeter), which uses two sensors on a metal rod to measure the electromagnetic variance caused by the ship moving through water. This change is then converted to ship's speed. Distance is determined by multiplying the speed and the time. This initial position can then be adjusted resulting in an estimated position by taking into account the current (known as set and drift in marine navigation). If there is no positional information available, a new dead reckoning plot may start from an estimated position. In this case subsequent dead reckoning positions will have taken into account estimated set and drift.

Dead reckoning positions are calculated at predetermined intervals, and are maintained between fixes. The duration of the interval varies. Factors including one's speed made good and the nature of heading and other course changes, and the navigator's judgment determine when dead reckoning positions are calculated.

Before the 18th-century development of the marine chronometer by John Harrison and the lunar distance method, dead reckoning was the primary method of determining longitude available to mariners such as Christopher Columbus and John Cabot on their trans-Atlantic voyages. Tools such as the traverse board were developed to enable even illiterate crew members to collect the data needed for dead reckoning. Polynesian navigation, however, uses different wayfinding techniques.

Air

British P10 Magnetic Compass with dead reckoning navigation tools

On 21 May 1927 Charles Lindbergh landed in Paris, France after a successful non-stop flight from the United States in the single-engined Spirit of St. Louis. As the aircraft was equipped with very basic instruments, Lindbergh used dead reckoning to navigate.

Dead reckoning in the air is similar to dead reckoning on the sea, but slightly more complicated. The density of the air the aircraft moves through affects its performance as well as winds, weight, and power settings.

The basic formula for DR is Distance = Speed x Time. An aircraft flying at 250 knots airspeed for 2 hours has flown 500 nautical miles through the air. The wind triangle is used to calculate the effects of wind on heading and airspeed to obtain a magnetic heading to steer and the speed over the ground (groundspeed). Printed tables, formulae, or an E6B flight computer are used to calculate the effects of air density on aircraft rate of climb, rate of fuel burn, and airspeed.

A course line is drawn on the aeronautical chart along with estimated positions at fixed intervals (say every ½ hour). Visual observations of ground features are used to obtain fixes. By comparing the fix and the estimated position corrections are made to the aircraft's heading and groundspeed.

Dead reckoning is on the curriculum for VFR (visual flight rules – or basic level) pilots worldwide. It is taught regardless of whether the aircraft has navigation aids such as GPS, ADF and VOR and is an ICAO Requirement. Many flying training schools will prevent a student from using electronic aids until they have mastered dead reckoning.

Inertial navigation systems (INSes), which are nearly universal on more advanced aircraft, use dead reckoning internally. The INS provides reliable navigation capability under virtually any conditions, without the need for external navigation references, although it is still prone to slight errors.

Automotive

Dead reckoning is today implemented in some high-end automotive navigation systems in order to overcome the limitations of GPS/GNSS technology alone. Satellite microwave signals are unavailable in parking garages and tunnels, and often severely degraded in urban canyons and near trees due to blocked lines of sight to the satellites or multipath propagation. In a dead-reckoning navigation system, the car is equipped with sensors that know the wheel circumference and record wheel rotations and steering direction. These sensors are often already present in cars for other purposes (anti-lock braking system, electronic stability control) and can be read by the navigation system from the controller-area network bus. The navigation system then uses a Kalman filter to integrate the always-available sensor data with the accurate but occasionally unavailable position information from the satellite data into a combined position fix.

Autonomous navigation in robotics

Dead reckoning is utilized in some robotic applications. It is usually used to reduce the need for sensing technology, such as ultrasonic sensors, GPS, or placement of some linear and rotary encoders, in an autonomous robot, thus greatly reducing cost and complexity at the expense of performance and repeatability. The proper utilization of dead reckoning in this sense would be to supply a known percentage of electrical power or hydraulic pressure to the robot's drive motors over a given amount of time from a general starting point. Dead reckoning is not totally accurate, which can lead to errors in distance estimates ranging from a few millimeters (in CNC machining) to kilometers (in UAVs), based upon the duration of the run, the speed of the robot, the length of the run, and several other factors.

Pedestrian dead reckoning (PDR)

With the increased sensor offering in smartphones, built-in accelerometers can be used as a pedometer and built-in magnetometer as a compass heading provider. Pedestrian dead reckoning (PDR) can be used to supplement other navigation methods in a similar way to automotive navigation, or to extend navigation into areas where other navigation systems are unavailable.

In a simple implementation, the user holds their phone in front of them and each step causes position to move forward a fixed distance in the direction measured by the compass. Accuracy is limited by the sensor precision, magnetic disturbances inside structures, and unknown variables such as carrying position and stride length. Another challenge is differentiating walking from running, and recognizing movements like bicycling, climbing stairs, or riding an elevator.

Before phone-based systems existed, many custom PDR systems existed. While a pedometer can only be used to measure linear distance traveled, PDR systems have an embedded magnetometer for heading measurement. Custom PDR systems can take many forms including special boots, belts, and watches, where the variability of carrying position has been minimized to better utilize magnetometer heading. True dead reckoning is fairly complicated, as it is not only important to minimize basic drift, but also to handle different carrying scenarios and movements, as well as hardware differences across phone models.

Directional dead reckoning

The south-pointing chariot was an ancient Chinese device consisting of a two-wheeled horse-drawn vehicle which carried a pointer that was intended always to aim to the south, no matter how the chariot turned. The chariot pre-dated the navigational use of the magnetic compass, and could not detect the direction that was south. Instead it used a kind of directional dead reckoning: at the start of a journey, the pointer was aimed southward by hand, using local knowledge or astronomical observations e.g. of the Pole Star. Then, as it traveled, a mechanism possibly containing differential gears used the different rotational speeds of the two wheels to turn the pointer relative to the body of the chariot by the angle of turns made (subject to available mechanical accuracy), keeping the pointer aiming in its original direction, to the south. Errors, as always with dead reckoning, would accumulate as distance traveled increased.

For networked games

Networked games and simulation tools routinely use dead reckoning to predict where an actor should be right now, using its last known kinematic state (position, velocity, acceleration, orientation, and angular velocity). This is primarily needed because it is impractical to send network updates at the rate that most games run, 60 Hz. The basic solution starts by projecting into the future using linear physics:

This formula is used to move the object until a new update is received over the network. At that point, the problem is that there are now two kinematic states: the currently estimated position and the just received, actual position. Resolving these two states in a believable way can be quite complex. One approach is to create a curve (e.g. cubic Bézier splines, centripetal Catmull–Rom splines, and Hermite curves) between the two states while still projecting into the future. Another technique is to use projective velocity blending, which is the blending of two projections (last known and current) where the current projection uses a blending between the last known and current velocity over a set time.

The first equation calculates a blended velocity given the client-side velocity at the time of the last server update and the last known server-side velocity . This essentially blends from the client-side velocity towards the server-side velocity for a smooth transition. Note that should go from zero (at the time of the server update) to one (at the time at which the next update should be arriving). A late server update is unproblematic as long as remains at one.

Next, two positions are calculated: firstly, the blended velocity and the last known server-side acceleration are used to calculate . This is a position which is projected from the client-side start position based on , the time which has passed since the last server update. Secondly, the same equation is used with the last known server-side parameters to calculate the position projected from the last known server-side position and velocity , resulting in .

Finally, the new position to display on the client is the result of interpolating from the projected position based on client information towards the projected position based on the last known server information . The resulting movement smoothly resolves the discrepancy between client-side and server-side information, even if this server-side information arrives infrequently or inconsistently. It is also free of oscillations which spline-based interpolation may suffer from.

Computer science

In computer science, dead-reckoning refers to navigating an array data structure using indexes. Since every array element has the same size, it is possible to directly access one array element by knowing any position in the array.

Given the following array:

A B C D E

knowing the memory address where the array starts, it is easy to compute the memory address of D:

Likewise, knowing D's memory address, it is easy to compute the memory address of B:

This property is particularly important for performance when used in conjunction with arrays of structures because data can be directly accessed, without going through a pointer dereference.

Copper in renewable energy

From Wikipedia, the free encyclopedia https://en.wikipedia.org/wiki/Cop...