Coextinction and cothreatened refer to the phenomena of the loss or decline of a host species resulting in the loss or endangerment of an other species that depends on it, potentially leading to cascading effects across trophic levels. The term originated by the authors Stork and Lyal (1993) and was originally used to explain the extinction of parasiticinsects following the loss of their specific hosts. The term is now used to describe the loss of any interacting species, including competition with their counterpart, and specialist herbivores with their food source. Coextinction is especially common when a keystone species goes extinct.
Causes
The most frequently cited example is that of the extinct passenger pigeon and its parasitic bird liceColumbicola extinctus and Campanulotes defectus. Recently, C. extinctus was rediscovered on the band-tailed pigeon, and C. defectus was found to be a likely case of misidentification of the existing Campanulotes flavus.
However, even though the passenger pigeon louse was rediscovered,
coextinctions of other parasites, even on the passenger pigeon, may have
occurred. Several louse species—such as Rallicola extinctus, a huia parasite—probably became extinct together with their hosts.
Recent studies have suggested that up to 50% of species may go extinct in the next 50 years.
This is in part due to coextinction; for example the loss of tropical
butterfly species from Singapore is attributed to the loss of their
specific larval host plants.
To see how possible future cases of coextinction would play out,
researchers have made models to show probabilistic relationships between
affiliate and host extinctions across co-evolved inter-specific
systems. The subjects are pollinating Ficus wasps and Ficus, primate parasites, (Pneumocystis Fungi, Nematode, and Lice)
and their hosts, parasitic mites and lice and their avian hosts,
butterflies and their larval host plants, and ant butterflies and their
host ants. For all but the most host-specific affiliate groups (e.g.,
primate Pneumocystis fungi and primates), affiliate extinction levels
may be modest at low levels of host extinction but can be expected to
rise quickly as host extinctions increase to levels predicted in the
near future. This curvilinear relationship between host and affiliate
extinction levels may also explain, in part, why so few coextinction
events have been documented to date.
Investigations have been carried out into coextinction risk among the rich Psyllid fauna Hemiptera – Psylloidea inhabiting acacias (Fabaceae-Mimosoideae: Acacia) in central eastern New South Wales, Australia. The results, suggest that A. ausfeldii hosts one specialist psyllid species, Acizzia, and that A. gordonii
hosts one specialist psyllid, Acizzia. Both psyllid species may be
threatened at the same level of their host species with coextinction.
Interaction patterns can be used to anticipate the consequences
of phylogenetic effects. By using a system of methodical observations,
scientists can use the phylogenetic relationships of species to predict
the number of interactions they exhibit in more than one-third of the
networks, and the identity of the species with which they interact in
about half of the networks. Consequentially, simulated extinction events
tend to trigger coextinction cascades of related species. This results
in a non-random pruning of the evolutionary tree.
"Species coextinction is a manifestation of the interconnectedness of organisms in complex ecosystems. The loss of species through coextinction represents the loss of irreplaceable evolutionary and coevolutionary
history. In view of the global extinction crisis, it is imperative that
coextinction be the focus of future research to understand the
intricate processes of species extinctions. While coextinction may not
be the most important cause of species extinctions, it is certainly an
insidious one." (Koh et al. 2004)
Koh et al. also define coendangered as taxa "likely to go extinct if their currently endangered hosts [...] become extinct."
One example is the extinction of many species of the genus Hibiscadelphus, as a consequence of the disappearance of several of the Hawaiian honeycreepers, its pollinators. There are also several instances of predators and scavengers
dying out or becoming rarer following the disappearance of species
which represented their source of food: for example, the coextinction of
the Haast's eagle with the moa, or the near-extinction of the California condor after the extinctions of its primary food, the dead carcasses of North American Pleistocene megafauna; in the latter, the condor survived by possibly relying on beached marine mammals.
Coextinction may also occur on a local level: for example, the decline in the red ant Myrmica sabuleti in southern England, caused by habitat loss, resulted in the extirpation of the large blue butterfly (which is dependent on the ant as a host for its larvae) from Great Britain. In this case the ant avoided extirpation, and the butterfly has since been reintroduced to the island.
Another example of a species that could currently be experiencing coextinction is the rhinoceros stomach bot fly (Gyrostigma rhinocerontis) and its host species the endangered black rhinoceros and white rhinoceros (Diceros bicornis and Ceratotherium simum).
The fly's larvae mature in a rhinoceros's stomach lining, having
entered the body via the digestive tract, and so are dependent on
rhinoceros species to reproduce.
Consequences
Coextinction can mean loss of biodiversity
and diversification. Coextinctions can influence not only parasite and
mutualist diversification but also their hosts. Arguably, parasites
facilitate host diversification through sexual selection.
That loss of parasites can reduce host diversification rates.
Coextinction can also result in loss of evolutionary history. The
extinction of related hosts can lead to the extinction of related
parasites. The loss of history is likely to be greater than the loss
expected, were species to go extinct at random.
Furthermore, if coextinctions are clustered, it is more likely that
coextinction can produce non-random trait loss. Species that are at risk
of coextinction are expected to be larger because rare hosts tend to be
larger and larger hosts have larger parasites.
They can also be expected to have lengthy generation times or higher
tropic positions. Coextinction can extend beyond biodiversity and has
direct and indirect consequences from the communities of lost species.
One main consequence of coextinction that goes beyond biodiversity is
mutualism, by loss of food production with a decline in threatened
pollinators. Losses of parasites can have negative impacts on humans or
the species. In rare hosts, losses of specialist parasites can
predispose hosts to infection by emergent parasites.
Furthermore, relating to the consequences of removing specialist
parasites from rare hosts, is the problem of where the parasites will go
once their host is extinct. If the parasites are dependent on only
those species than there are parasite species that are at risk of
extinction through co-endangerment. On the other hand, if they are able
to find and switch onto alternative hosts, those hosts can turn out to
be humans. Either way, the loss of parasites by co extinction or the
acquiring of new parasites by alternative hosts, proves to be a major
issue. Coextinction can go beyond the decreased biodiversity, it can
range into various biomes and link various ecosystems.
A study conducted in New Caledonia has shown that extinction of a coral reef-associated fish species of average size would eventually result in the co-extinction of at least ten species of parasites.
Risks
The host
specificity and life cycle is a major factor in the risk of
coextinction. Species of mutualists, parasites, and many free-living
insects that have staged life cycles are more likely to be a victim of
coextinction. This is due to the fact that these organisms may depend on
multiple hosts throughout their lives in comparison to simple life
cycled organisms. Also, if organisms are evolutionary flexible, then these organisms may escape extinction.
The area with that has the greatest effect of coextinction is the
tropics. There is a continued disappearance in the habitat, human
intervention, and a great loss in vital ecosystem services.
This is threatening because the tropics contain 2/3 of the all known
species but they aren't in a situation where they can be fully taken
care of. Along with forest loss other risk factors include: coastal
development, overexploitation of wildlife, and habitat conversion, that also affect human well-being.
In an effort to find a stop to coextinction, researchers have
found that the first step would be to conserve the host species in which
other species are dependent on. These hosts serve as major components
for their habitat and need them to survive. In deciding what host to
protect, it is important to choose one that can benefit an array of
other dependent species.
A flame detector is a sensor designed to detect and respond to the presence of a flame or fire, allowing flame detection.
Responses to a detected flame depend on the installation, but can
include sounding an alarm, deactivating a fuel line (such as a propane or a natural gas
line), and activating a fire suppression system. When used in
applications such as industrial furnaces, their role is to provide
confirmation that the furnace is working properly; it can be used to
turn off the ignition system though in many cases they take no direct
action beyond notifying the operator or control system. A flame detector
can often respond faster and more accurately than a smoke or heat detector due to the mechanisms it uses to detect the flame.
Optical flame detectors
Flame detector type regions
Ultraviolet detector
Ultraviolet
(UV) detectors work by detecting the UV radiation emitted at the
instant of ignition. While capable of detecting fires and explosions
within 3–4 milliseconds, a time delay of 2–3 seconds is often included
to minimize false alarms which can be triggered by other UV sources such
as lightning, arc welding, radiation, and sunlight. UV detectors typically operate with wavelengths shorter than 300 nm to minimize the effects of natural background radiation. The solar blind UV wavelength band is also easily blinded by oily contaminants.
Near IR array
Near infrared
(IR) array flame detectors (0.7 to 1.1 μm), also known as visual flame
detectors, employ flame recognition technology to confirm fire by
analyzing near IR radiation using a charge-coupled device
(CCD). A near infrared (IR) sensor is especially able to monitor flame
phenomena, without too much hindrance from water and water vapour. Pyroelectric sensors operating at this wavelength can be relatively cheap. Multiple channel or pixel
array sensors monitoring flames in the near IR band are arguably the
most reliable technologies available for detection of fires. Light
emission from a fire forms an image of the flame at a particular
instant. Digital image processing can be utilized to recognize flames through analysis of the video created from the near IR images.
Infrared
Infrared
(IR) or wideband infrared (1.1 μm and higher) flame detectors monitor
the infrared spectral band for specific patterns given off by hot gases.
These are sensed using a specialized fire-fighting thermal imaging camera (TIC), a type of thermographic camera. False alarms can be caused by other hot surfaces and background thermal radiation
in the area. Water on the detector's lens will greatly reduce the
accuracy of the detector, as will exposure to direct sunlight. A special
frequency range is 4.3 to 4.4 μm. This is a resonance frequency of CO2. During burning of a hydrocarbon (for example, wood or fossil fuels such as oil and natural gas) much heat and CO2 is released. The hot CO2
emits much energy at its resonance frequency of 4.3 μm. This causes a
peak in the total radiation emission and can be well detected. Moreover,
the "cold" CO2 in the air is taking care that the sunlight
and other IR radiation is filtered. This makes the sensor in this
frequency "solar blind"; however, sensitivity is reduced by sunlight. By
observing the flicker frequency of a fire (1 to 20 Hz) the detector is
made less sensitive to false alarms caused by heat radiation, for
example caused by hot machinery.
A severe disadvantage is that almost all radiation can be absorbed by water or water vapour;
this is particularly valid for infrared flame detection in the 4.3 to
4.4 μm region. From approx. 3.5 μm and higher the absorption by water or
ice is practically 100%. This makes infrared sensors for use in outdoor
applications very unresponsive to fires. The biggest problem is our
ignorance; some infrared detectors have an (automatic) detector window
self test, but this self test only monitors the occurrence of water or
ice on the detector window.
A salt film is also harmful, because salt absorbs water. However,
water vapour, fog or light rain also makes the sensor almost blind,
without the user knowing. The cause is similar to what a fire fighter
does if he approaches a hot fire: he protects himself by means of a
water vapour screen against the enormous infrared heat radiation. The
presence of water vapor, fog, or light rain will then also "protect" the
monitor causing it to not see the fire. Visible light will, however be
transmitted through the water vapour screen, as can easily been seen by
the fact that a human can still see the flames through the water vapour
screen.
The usual response time of an IR detector is 3–5 seconds.
Infrared thermal cameras
MWIR
infrared (IR) cameras can be used to detect heat and with particular
algorithms can detect hot-spots within a scene as well as flames for
both detection and prevention of fire and risks of fire. These cameras
can be used in complete darkness and operate both inside and outside.
UV/IR
These
detectors are sensitive to both UV and IR wavelengths, and detect flame
by comparing the threshold signal of both ranges. This helps minimize
false alarms.
IR/IR flame detection
Dual
IR (IR/IR) flame detectors compare the threshold signal in two infrared
ranges. Often one sensor looks at the 4.4 micrometer carbon dioxide (CO2), while the other sensor looks at a reference frequency. Sensing the CO2
emission is appropriate for hydrocarbon fuels; for non-carbon based
fuels, e.g., hydrogen, the broadband water bands are sensed.
IR3 flame detection
Multi-infrared
detectors make use of algorithms to suppress the effects of background
radiation (blackbody radiation), again sensitivity is reduced by this
radiation.
Triple-IR flame detectors compare three specific wavelength bands
within the IR spectral region and their ratio to each other. In this
case one sensor looks at the 4.4 micrometer range while the other
sensors look at reference wavelengths both above and below 4.4. This
allows the detector to distinguish between non-flame IR sources and
actual flames which emit hot CO2 in the combustion process.
As a result, both detection range and immunity to false alarms can be
significantly increased. IR3 detectors can detect a 0.1m2 (1 ft2)
gasoline pan fire at up to 65 m (215 ft) in less than 5 seconds. Triple
IRs, like other IR detector types, are susceptible to blinding by a
layer of water on the detector's window.
Most IR detectors are designed to ignore constant background IR
radiation, which is present in all environments. Instead they are
designed to detect suddenly changing or increasing sources of the
radiation. When exposed to changing patterns of non-flame IR radiation,
IR and UV/IR detectors become more prone to false alarms, while IR3
detectors become somewhat less sensitive but are more immune to false
alarms.
3IR+UV flame detection
Multi-Infrared
(Multi-IR/3IR) detectors use algorithms to determine the presence of
fire and tell them apart from background noise known to as black-body radiation,
which in generally reduce the range and accuracy of the detector.
Black-body radiation is constantly present in all environments , but is
given off especially strongly by objects at high temperature. this
makes high temperature environments, or areas where high temperature
material is handled especially challenging for IR only detectors. Thus,
one additional UV-C band sensor is sometimes included in flame detectors
to add another layer of confirmation, as black-body radiation does not
impact UV sensors unless the temperature is extremely high, such as the
plasma glow from an Arc welding machine.
Multi-wavelength detectors vary in sensor configuration. 1 IR+UV,
or UVIR being the most common and low cost. 2 IR + UV being a
compromise between cost and False alarm immunity and 3 IR + UV, which
combines past 3IR technology with the additional layer of identification
from the UV sensor.
Multi-Wavelength or Multi-spectral detectors such as 3IR+UV and
UVIR are an improvement over their IR-only detectors counterparts which
have been known to either false alarm or lose sensitivity and range in
the presence of strong background noise such as direct or reflected
light sources or even sun exposure. IR detectors have often relied on
Infrared bulk energy growth to as their primary determining factor for
fire detection, declaring an alarm when the sensors exceed a given range
and ratio. This approach however is prone to trigger from non-fire
noise. whether from blackbody radiation, high temperature environments,
or simply changes in the ambient lighting. alternatively in another
design approach, IR-only detectors may only alarm given perfect
conditions and clear signal matches, which results in missing the fire
when there is too much noise, such as looking into the sunset.
Modern Flame detectors may also make use of high speed sensors,
which allow the capture of the flickering movement of flame, and monitor
the pattern and ratios of the spectral output for patterns unique to
fire. Higher speed sensors allow for not only faster reaction times, but
also more data per second, increasing the level of confidence in fire
identification, or false alarm rejection.
Visible sensors
A
visible light sensor (for example a camera: 0.4 to 0.7 μm) is able to
present an image, which can be understood by a human being. Furthermore,
complex image processing analysis can be executed by computers, which
can recognize a flame or even smoke. Unfortunately, a camera can be
blinded, like a human, by heavy smoke and by fog. It is also possible to
mix visible light information (monitor) with UV or infrared
information, in order to better discriminate against false alarms or to
improve the detection range. The corona camera
is an example of this equipment. In this equipment the information of a
UV camera mixed with visible image information. It is used for tracing
defects in high voltage equipment and fire detection over high distances.
In some detectors, a sensor for visible radiation (light) is added to the design.
Video
Closed-circuit television or a web camera can be used for visual detection of (wavelengths between 0.4 and 0.7 μm). Smoke or fog can limit the effective range of these, since they operate solely in the visible spectrum.
Other types
Ionization current flame detection
The intense ionization within the body of a flame can be measured by means by the phenomena of flame rectification
whereby an AC current flows more easily in one direction when a voltage
is applied. This current can be used to verify flame presence and
quality.
Such detectors can be used in large industrial process gas heaters and
are connected to the flame control system. They usually act as both
flame quality monitors and for flame failure detection. They are also
common in a variety of household gas furnaces and boilers.
Problems with boilers failing to stay lit can often be due to
dirty flame sensors or to a poor burner surface with which to complete
the electrical circuit. A poor flame or one that is lifting off the
burner may also interrupt the continuity.
Flame igniter (top) and flame sensor
Thermocouple flame detection
Thermocouples
are used extensively for monitoring flame presence in combustion
heating systems and gas cookers. A common use in these installations is
to cut off the supply of fuel if the flame fails, in order to prevent
unburned fuel from accumulating. These sensors measure heat and
therefore are commonly used to determine the absence of a flame. This can be used to verify the presence of a pilot flame.
A fire emits radiation, which human eye
experiences as the visible yellow red flames and heat. In fact, during a
fire, relatively sparsely UV energy and visible light energy is
emitted, as compared to the emission of Infrared radiation. A
non-hydrocarbon fire, for example, one from hydrogen, does not show a CO2 peak on 4.3 μm because during the burning of hydrogen no CO2 is released. The 4.3 μm CO2
peak in the picture is exaggerated, and is in reality less than 2% of
the total energy of the fire. A multi-frequency-detector with sensors
for UV, visible light, near IR and/or wideband IR thus have much more
"sensor data" to calculate with and therefore are able to detect more
types of fires and to detect these types of fires better: hydrogen, methanol, ether or sulphur.
It looks like a static picture, but in reality the energy fluctuates,
or flickers. This flickering is caused by the fact that the aspirated
oxygen and the present combustible are burning and concurrently aspirate
new oxygen and new combustible material. These little explosions cause
the flickering of the flame.
Sunlight
Sunlight transmission
The sun
emits an enormous amount of energy, which would be harmful to human
beings if not for the vapours and gases in the atmosphere, like water (clouds), ozone, and others, through which the sunlight is filtered. In the figure it can clearly be seen that "cold" CO2
filters the solar radiation around 4.3 μm. An Infrared detector which
uses this frequency is therefore solar blind. Not all manufacturers of
flame detectors use sharp filters for the 4.3 μm radiation and thus
still pick up quite an amount of sunlight. These cheap flame detectors
are hardly usable for outdoor applications. Between 0.7 μm and approx.
3 μm there is relatively large absorption of sunlight. Hence, this
frequency range is used for flame detection by a few flame detector
manufacturers (in combination with other sensors like ultraviolet,
visible light, or near infrared). The big economical advantage is that
detector windows can be made of quartz instead of expensive sapphire. These electro-optical sensor
combinations also enable the detection of non-hydrocarbons like
hydrogen fires without the risk of false alarms caused by artificial
light or electrical welding.
Heat radiation
Heat radiation
Infrared flame detectors suffer from Infrared heat radiation which is
not emitted by the possible fire. One could say that the fire can be
masked by other heat sources. All objects which have a temperature
higher than the absolute minimum temperature (0 kelvins
or −273.15 °C) emit energy and at room temperature (300 K) this heat is
already a problem for the infrared flame detectors with the highest
sensitivity. Sometimes a moving hand is sufficient to trigger an IR
flame detector. At 700 K a hot object (black body) starts to emit
visible light (glow). Dual- or multi-infrared detectors suppress the
effects of heat radiation by means of sensors which detect just off the
CO2 peak; for example at 4.1 μm. Here it is necessary that
there is a large difference in output between the applied sensors (for
example sensor S1 and S2 in the picture). A disadvantage is that the
radiation energy of a possible fire must be much bigger than the present
background heat radiation. In other words, the flame detector becomes
less sensitive. Every multi infrared flame detector is negatively
influenced by this effect, regardless how expensive it is.
Cone of vision
Cone of Vision (Field of View)
The cone of vision of a flame detector is determined by the shape and
size of the window and the housing and the location of the sensor in
the housing. For infrared sensors also the lamination
of the sensor material plays a part; it limits the cone of vision of
the flame detector. A wide cone of vision does not automatically mean
that the flame detector is better. For some applications the flame
detector needs to be aligned precisely to take care that it does not
detect potential background radiation sources. The cone of vision of the
flame detector is three dimensional and is not necessarily perfectly
round. The horizontal angle of vision and the vertical angle of vision
often differ; this is mostly caused by the shape of the housing and by
mirroring parts (meant for the self test). Different combustibles can
even have a different angle of vision in the same flame detector. Very
important is the sensitivity at angles of 45°. Here at least 50% of the
maximum sensitivity at the central axis must be achieved. Some flame
detectors here achieve 70% or more. In fact these flame detectors have a
total horizontal angle of vision of more than 90°, but most of the
manufacturers do not mention this. A high sensitivity on the edges of
the angle of vision provides advantages for the projection of a flame
detector.
The detection range
Detection range
The range of a flame detector is highly determined by the mounting
location. In fact, when making a projection, one should imagine in what
the flame detector "sees". A rule of thumb is, that the mounting height
of the flame detector is twice as high as the highest object in the
field of view. Also the accessibility of the flame detector must be
taken into account, because of maintenance and/or repairs. A rigid
light-mast with a pivot point is for this reason recommendable. A "roof"
on top of the flame detector (30 x 30 cm, 1 x 1-foot) prevents quick
pollution in outdoor applications. Also the shadow effect must be
considered. The shadow effect can be minimized by mounting a second
flame detector in the opposite of the first detector. A second advantage
of this approach is, that the second flame detector is a redundant one,
in case the first one is not working or is blinded. In general, when
mounting several flame detectors, one should let them "look" to each
other not let them look to the walls. Following this procedure blind
spots (caused by the shadow effect) can be avoided and a better
redundancy can be achieved than if the flame detectors would "look" from
the central position into the area to be protected. The range of flame
detectors to the 30 x 30 cm, 1 x 1-foot industry standard
fire is stated within the manufacturers data sheets and manuals, this
range can be affected by the previously stated de-sensitizing effects of
sunlight, water, fog, steam and blackbody radiation.
The square law
Square Law
If the distance between the flame and the flame detector is large
compared to the dimension of the fire then the square law applies: If a
flame detector can detect a fire with an area A on a certain distance,
then a 4 times bigger flame area is necessary if the distance between
the flame detector and the fire is doubled. In short:
Double distance = four times bigger flame area (fire).
This law is equally valid for all optical flame detectors,
including video based ones. The maximum sensitivity can be estimated by
dividing the maximum flame area A by the square of the distance between
the fire and the flame detector: c = A/d2. With this constant c can, for the same flame detector and the same type of fire, the maximum distance or the minimum fire area be calculated:
A=cd 2 and d=√A/c
It must be emphasized, however, that the square root in reality
is not valid anymore at very high distances. At long distances other
parameters are playing a significant part; like the occurrence of water
vapour and of cold CO2 in the air. In the case of a very
small flame, on the other hand, the decreasing flickering of the flame
will play an increasing part.
A more exact relation - valid when the distance between the flame
and the flame detector is small - between the radiation density, E, at the detector and the distance, D, between the detector and a flame of effective radius, R, emitting energy density, M, is given by
E = 2πMR2/(R2+D2)
When R<<D then the relation reduces to the (inverse) square law
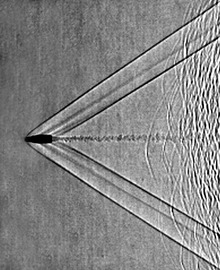
Schlieren photograph of an attached shock on a sharp-nosed supersonic bodyUSS Iowa firing at broadside
during training exercises in Puerto Rico, 1984. Circular marks are
visible where the expanding spherical atmospheric shockwaves from the
gun firing meet the water surface.
In physics, a shock wave (also spelled shockwave), or shock, is a type of propagating disturbance that moves faster than the local speed of sound
in the medium. Like an ordinary wave, a shock wave carries energy and
can propagate through a medium but is characterized by an abrupt, nearly
discontinuous, change in pressure, temperature, and density of the medium.
For the purpose of comparison, in supersonic flows, additional increased expansion may be achieved through an expansion fan, also known as a Prandtl–Meyer expansion fan.
The accompanying expansion wave may approach and eventually collide and
recombine with the shock wave, creating a process of destructive
interference. The sonic boom associated with the passage of a supersonic aircraft is a type of sound wave produced by constructive interference.
Unlike solitons (another kind of nonlinear wave), the energy and speed of a shock wave alone dissipates relatively quickly with distance.
When a shock wave passes through matter, energy is preserved but entropy
increases. This change in the matter's properties manifests itself as a
decrease in the energy which can be extracted as work, and as a drag force on supersonic objects; shock waves are strongly irreversible processes.
Terminology
Shock waves can be:
Normal
At 90° (perpendicular) to the shock medium's flow direction.
Occurs upstream of the front (bow) of a blunt object when the upstream flow velocity exceeds Mach 1.
Some other terms:
Shock front: The boundary over which the physical conditions undergo an abrupt change because of a shock wave.
Contact front: In a shock wave caused by a driver gas (for example
the "impact" of a high explosive on the surrounding air), the boundary
between the driver (explosive products) and the driven (air) gases. The
contact front trails the shock front.
In supersonic flows
Pressure-time
diagram at an external observation point for the case of a supersonic
object propagating past the observer. The leading edge of the object
causes a shock (left, in red) and the trailing edge of the object causes
an expansion (right, in blue).Conical shockwave with its hyperbola-shaped ground contact zone in yellow
The abruptness of change in the features of the medium, that characterize shock waves, can be viewed as a phase transition:
the pressure-time diagram of a supersonic object propagating shows how
the transition induced by a shock wave is analogous to a dynamic phase transition.
When an object (or disturbance) moves faster than the information
can propagate into the surrounding fluid, then the fluid near the
disturbance cannot react or "get out of the way" before the disturbance
arrives. In a shock wave the properties of the fluid (density, pressure, temperature, flow velocity, Mach number) change almost instantaneously. Measurements of the thickness of shock waves in air have resulted in values around 200 nm (about 10−5 in),
which is on the same order of magnitude as the mean free path of gas
molecules. In reference to the continuum, this implies the shock wave
can be treated as either a line or a plane if the flow field is
two-dimensional or three-dimensional, respectively.
Shock waves are formed when a pressure front moves at supersonic speeds and pushes on the surrounding air.
At the region where this occurs, sound waves travelling against the
flow reach a point where they cannot travel any further upstream and the
pressure progressively builds in that region; a high pressure shock
wave rapidly forms.
Shock waves are not conventional sound waves; a shock wave takes
the form of a very sharp change in the gas properties. Shock waves in
air are heard as a loud "crack" or "snap" noise. Over longer distances, a
shock wave can change from a nonlinear wave into a linear wave,
degenerating into a conventional sound wave as it heats the air and
loses energy. The sound wave is heard as the familiar "thud" or "thump"
of a sonic boom, commonly created by the supersonic flight of aircraft.
The shock wave is one of several different ways in which a gas in a supersonic flow can be compressed. Some other methods are isentropic compressions, including Prandtl–Meyer
compressions. The method of compression of a gas results in different
temperatures and densities for a given pressure ratio which can be
analytically calculated for a non-reacting gas. A shock wave compression
results in a loss of total pressure, meaning that it is a less
efficient method of compressing gases for some purposes, for instance in
the intake of a scramjet. The appearance of pressure-drag on supersonic aircraft is mostly due to the effect of shock compression on the flow.
Normal shocks
In elementary fluid mechanics utilizing ideal gases,
a shock wave is treated as a discontinuity where entropy increases
abruptly as the shock passes. Since no fluid flow is discontinuous, a control volume
is established around the shock wave, with the control surfaces that
bound this volume parallel to the shock wave (with one surface on the
pre-shock side of the fluid medium and one on the post-shock side). The
two surfaces are separated by a very small depth such that the shock
itself is entirely contained between them. At such control surfaces,
momentum, mass flux and energy are constant; within combustion, detonations
can be modelled as heat introduction across a shock wave. It is assumed
the system is adiabatic (no heat exits or enters the system) and no
work is being done. The Rankine–Hugoniot conditions arise from these considerations.
Taking into account the established assumptions, in a system
where the downstream properties are becoming subsonic: the upstream and
downstream flow properties of the fluid are considered isentropic. Since
the total amount of energy within the system is constant, the
stagnation enthalpy remains constant over both regions. Though, entropy
is increasing; this must be accounted for by a drop in stagnation
pressure of the downstream fluid.
When
analyzing shock waves in a flow field, which are still attached to the
body, the shock wave which is deviating at some arbitrary angle from the
flow direction is termed oblique shock. These shocks require a
component vector analysis of the flow; doing so allows for the treatment
of the flow in an orthogonal direction to the oblique shock as a normal
shock.
Bow shocks
When
an oblique shock is likely to form at an angle which cannot remain on
the surface, a nonlinear phenomenon arises where the shock wave will
form a continuous pattern around the body. These are termed bow shocks.
In these cases, the 1d flow model is not valid and further analysis is
needed to predict the pressure forces which are exerted on the surface.
Shock waves due to nonlinear steepening
Shock waves can form due to steepening of ordinary waves. The best-known example of this phenomenon is ocean waves that form breakers
on the shore. In shallow water, the speed of surface waves is dependent
on the depth of the water. An incoming ocean wave has a slightly higher
wave speed near the crest of each wave than near the troughs between
waves, because the wave height is not infinitesimal compared to the
depth of the water. The crests overtake the troughs until the leading
edge of the wave forms a vertical face and spills over to form a
turbulent shock (a breaker) that dissipates the wave's energy as sound
and heat.
Similar phenomena affect strong sound waves
in gas or plasma, due to the dependence of the sound speed on
temperature and pressure. Strong waves heat the medium near each
pressure front, due to adiabatic compression of the air itself, so that
high pressure fronts outrun the corresponding pressure troughs. There is
a theory that the sound pressure levels in brass instruments such as
the trombone become high enough for steepening to occur, forming an
essential part of the bright timbre of the instruments.
While shock formation by this process does not normally happen to
unenclosed sound waves in Earth's atmosphere, it is thought to be one
mechanism by which the solarchromosphere and corona are heated, via waves that propagate up from the solar interior.
Analogies
A
shock wave may be described as the furthest point upstream of a moving
object which "knows" about the approach of the object. In this
description, the shock wave position is defined as the boundary between
the zone having no information about the shock-driving event and the
zone aware of the shock-driving event, analogous with the light cone described in the theory of special relativity.
To produce a shock wave, an object in a given medium (such as air
or water) must travel faster than the local speed of sound. In the case
of an aircraft travelling at high subsonic speed, regions of air around
the aircraft may be travelling at exactly the speed of sound, so that
the sound waves leaving the aircraft pile up on one another, similar to a
traffic jam on a motorway. When a shock wave forms, the local air
pressure increases and then spreads out sideways. Because of this
amplification effect, a shock wave can be very intense, more like an
explosion when heard at a distance (not coincidentally, since explosions
create shock waves).
Analogous phenomena are known outside fluid mechanics. For example, charged particles accelerated beyond the speed of light in a refractive medium (such as water, where the speed of light is less than that in a vacuum) create visible shock effects, a phenomenon known as Cherenkov radiation.
Phenomenon types
Below are a number of examples of shock waves, broadly grouped with similar shock phenomena:
Shock wave propagating into a stationary medium, ahead of the fireball of an explosion. The shock is made visible by the shadow effect (Trinity explosion)
Moving shock
Usually consists of a shock wave propagating into a stationary medium
In this case, the gas ahead of the shock is stationary (in the
laboratory frame) and the gas behind the shock can be supersonic in the
laboratory frame. The shock propagates with a wavefront which is normal
(at right angles) to the direction of flow. The speed of the shock is a
function of the original pressure ratio between the two bodies of gas.
Moving shocks
are usually generated by the interaction of two bodies of gas at
different pressure, with a shock wave propagating into the lower
pressure gas and an expansion wave propagating into the higher pressure
gas.
A detonation wave is essentially a shock supported by a trailing exothermic reaction.
It involves a wave travelling through a highly combustible or
chemically unstable medium, such as an oxygen-methane mixture or a high explosive.
The chemical reaction of the medium occurs following the shock wave,
and the chemical energy of the reaction drives the wave forward.
A detonation wave follows slightly different rules from an ordinary
shock since it is driven by the chemical reaction occurring behind the
shock wavefront. In the simplest theory for detonations, an unsupported,
self-propagating detonation wave proceeds at the Chapman-Jouguet
flow velocity. A detonation will also cause a shock to propagate into
the surrounding air due to the overpressure induced by the explosion.
When a shock wave is created by high explosives such as TNT (which has a detonation velocity of 6,900 m/s), it will always travel at high, supersonic velocity from its point of origin.
Schlieren photograph of the detached shock on a bullet in supersonic flight, published by Ernst Mach and Peter Salcher in 1887.Shadowgram
of shock waves from a supersonic bullet fired from a rifle. The
shadowgraph optical technique reveals that the bullet is moving at about
a Mach number of 1.9. Left- and right-running bow waves and tail waves
stream back from the bullet and its turbulent wake is also visible.
Patterns at the far right are from unburned gunpowder particles ejected
by the rifle.
These shocks are curved and form a small distance in front of
the body. Directly in front of the body, they stand at 90 degrees to the
oncoming flow and then curve around the body. Detached shocks allow the
same type of analytic calculations as for the attached shock, for the
flow near the shock. They are a topic of continuing interest, because
the rules governing the shock's distance ahead of the blunt body are
complicated and are a function of the body's shape. Additionally, the
shock standoff distance varies drastically with the temperature for a
non-ideal gas, causing large differences in the heat transfer to the
thermal protection system of the vehicle. See the extended discussion on
this topic at Atmospheric reentry.
These follow the "strong-shock" solutions of the analytic equations,
meaning that for some oblique shocks very close to the deflection angle
limit, the downstream Mach number is subsonic. See also bow shock or oblique shock
Such a shock occurs when the maximum deflection angle is exceeded. A
detached shock is commonly seen on blunt bodies, but may also be seen
on sharp bodies at low Mach numbers.
Examples: Space return vehicles (Apollo, Space shuttle), bullets, the boundary (Bow shock) of a magnetosphere. The name "bow shock" comes from the example of a bow wave,
the detached shock formed at the bow (front) of a ship or boat moving
through water, whose slow surface wave speed is easily exceeded (see ocean surface wave).
Attached shock
These shocks appear as attached to the tip of sharp bodies moving at supersonic speeds.
Examples: Supersonic wedges and cones with small apex angles.
The attached shock wave is a classic structure in aerodynamics
because, for a perfect gas and inviscid flow field, an analytic solution
is available, such that the pressure ratio, temperature ratio, angle of
the wedge and the downstream Mach number can all be calculated knowing
the upstream Mach number and the shock angle. Smaller shock angles are
associated with higher upstream Mach numbers, and the special case where
the shock wave is at 90° to the oncoming flow (Normal shock), is
associated with a Mach number of one. These follow the "weak-shock"
solutions of the analytic equations.
In rapid granular flows
Shock
waves can also occur in rapid flows of dense granular materials down
inclined channels or slopes. Strong shocks in rapid dense granular flows
can be studied theoretically and analyzed to compare with experimental
data. Consider a configuration in which the rapidly moving material down
the chute impinges on an obstruction wall erected perpendicular at the
end of a long and steep channel. Impact leads to a sudden change in the
flow regime from a fast moving supercritical
thin layer to a stagnant thick heap. This flow configuration is
particularly interesting because it is analogous to some hydraulic and
aerodynamic situations associated with flow regime changes from
supercritical to subcritical flows.
Astrophysical environments feature many different types of shock waves. Some common examples are supernovae shock waves or blast waves travelling through the interstellar medium, the bow shock caused by the Earth's magnetic field colliding with the solar wind and shock waves caused by galaxies
colliding with each other. Another interesting type of shock in
astrophysics is the quasi-steady reverse shock or termination shock that
terminates the ultra relativistic wind from young pulsars.
When the 2013 meteor entered into the Earth's atmosphere with an
energy release equivalent to 100 or more kilotons of TNT, dozens of
times more powerful than the atomic bomb dropped on Hiroshima, the meteor's shock wave produced damages as in a supersonic jet's flyby (directly underneath the meteor's path) and as a detonation wave, with the circular shock wave centred at the meteor explosion, causing multiple instances of broken glass in the city of Chelyabinsk and neighbouring areas (pictured).
Technological applications
In
the examples below, the shock wave is controlled, produced by (ex.
airfoil) or in the interior of a technological device, like a turbine.
Recompression shock
Recompression shock on a transonic flow airfoil, at and above critical Mach number.
These shocks appear when the flow over a transonic body is decelerated to subsonic speeds.
Examples: Transonic wings, turbines
Where the flow over the suction side of a transonic wing is
accelerated to a supersonic speed, the resulting re-compression can be
by either Prandtl–Meyer compression or by the formation of a normal
shock. This shock is of particular interest to makers of transonic
devices because it can cause separation of the boundary layer at the
point where it touches the transonic profile. This can then lead to full
separation and stall on the profile, higher drag, or shock-buffet, a
condition where the separation and the shock interact in a resonance
condition, causing resonating loads on the underlying structure.
Pipe flow
This shock appears when supersonic flow in a pipe is decelerated.
In this case the gas ahead of the shock is supersonic (in the
laboratory frame), and the gas behind the shock system is either
supersonic (oblique shocks) or subsonic (a normal shock)
(Although for some oblique shocks very close to the deflection angle
limit, the downstream Mach number is subsonic.) The shock is the result
of the deceleration of the gas by a converging duct, or by the growth of
the boundary layer on the wall of a parallel duct.
Combustion engines
The wave disk engine (also named "Radial Internal Combustion Wave Rotor") is a kind of pistonless rotary engine that utilizes shock waves
to transfer energy between a high-energy fluid to a low-energy fluid,
thereby increasing both temperature and pressure of the low-energy
fluid.
Memristors
In memristors,
under externally-applied electric field, shock waves can be launched
across the transition-metal oxides, creating fast and non-volatile
resistivity changes.
Shock capturing and detection
NASA took their first Schlieren photograph of shock waves interacting between two aircraft in 2019.
Advanced
techniques are needed to capture shock waves and to detect shock waves
in both numerical computations and experimental observations.
Computational fluid dynamics
is commonly used to obtain the flow field with shock waves. Though
shock waves are sharp discontinuities, in numerical solutions of fluid
flow with discontinuities (shock wave, contact discontinuity or slip
line), the shock wave can be smoothed out by low-order numerical method
(due to numerical dissipation) or there are spurious oscillations near
shock surface by high-order numerical method (due to Gibbs phenomena).
There exist some other discontinuities in fluid flow than the
shock wave. The slip surface (3D) or slip line (2D) is a plane across
which the tangent velocity is discontinuous, while pressure and normal
velocity are continuous. Across the contact discontinuity, the pressure
and velocity are continuous and the density is discontinuous. A strong
expansion wave or shear layer may also contain high gradient regions
which appear to be a discontinuity. Some common features of these flow
structures and shock waves and the insufficient aspects of numerical and
experimental tools lead to two important problems in practices:
(1) some shock waves can not be detected or their positions are detected
wrong, (2) some flow structures which are not shock waves are wrongly
detected to be shock waves.
In fact, correct capturing and detection of shock waves are
important since shock waves have the following influences:
(1) causing loss of total pressure, which may be a concern related to
scramjet engine performance,
(2) providing lift for wave-rider configuration, as the oblique shock
wave at lower surface of the vehicle can produce high pressure to
generate lift,
(3) leading to wave drag of high-speed vehicle which is harmful to
vehicle performance,
(4) inducing severe pressure load and heat flux, e.g. the Type IV
shock–shock interference could yield a 17 times heating increase at
vehicle surface, (5) interacting with other structures, such as boundary
layers, to produce new flow structures such as flow separation,
transition, etc.
The
sound source is travelling at 1.4 times the speed of sound (Mach 1.4).
Since the source is moving faster than the sound waves it creates, it
leads the advancing wavefront.A
sonic boom produced by an aircraft moving at M=2.92, calculated from
the cone angle of 20 degrees. Observers hear nothing until the shock
wave, on the edges of the cone, crosses their location.Mach cone angleNASA data showing N-wave signature.Conical shockwave with its hyperbola-shaped ground contact zone in yellow
A sonic boom is a sound associated with shock waves created when an object travels through the air faster than the speed of sound. Sonic booms generate enormous amounts of sound energy, sounding similar to an explosion or a thunderclap to the human ear.
The crack of a supersonic bullet passing overhead or the crack of a bullwhip are examples of a sonic boom in miniature.
Sonic booms due to large supersonic aircraft can be particularly loud and startling, tend to awaken people, and may cause minor damage to some structures.
This led to prohibition of routine supersonic flight overland. Although
they cannot be completely prevented, research suggests that with
careful shaping of the vehicle, the nuisance due to the sonic booms may
be reduced to the point that overland supersonic flight may become a
feasible option.
A sonic boom does not occur only at the moment an object crosses the sound barrier
and neither is it heard in all directions emanating from the supersonic
object. Rather, the boom is a continuous effect that occurs while the
object is travelling at supersonic speeds and affects only observers
that are positioned at a point that intersects a region in the shape of a
geometrical cone
behind the object. As the object moves, this conical region also moves
behind it and when the cone passes over the observer, they will briefly
experience the "boom".
Causes
When an aircraft passes through the air, it creates a series of pressure waves in front of the aircraft and behind it, similar to the bow and stern waves created by a boat. These waves travel at the speed of sound
and, as the speed of the object increases, the waves are forced
together, or compressed, because they cannot get out of each other's way
quickly enough. Eventually they merge into a single shock wave, which
travels at the speed of sound, a critical speed known as Mach 1, and is approximately 1,192 km/h (741 mph) at sea level and 20 °C (68 °F).
In smooth flight, the
shock wave starts at the nose of the aircraft and ends at the tail.
Because the different radial directions around the aircraft's direction
of travel are equivalent (given the "smooth flight" condition), the
shock wave forms a Mach cone, similar to a vapour cone, with the aircraft at its tip. The half-angle between the direction of flight and the shock wave is given by:
,
where is the inverse of the plane's Mach number (). Thus the faster the plane travels, the finer and more pointed the cone is.
There is a rise in pressure at the nose, decreasing steadily to a
negative pressure at the tail, followed by a sudden return to normal
pressure after the object passes. This "overpressure
profile" is known as an N-wave because of its shape. The "boom" is
experienced when there is a sudden change in pressure; therefore, an
N-wave causes two booms – one when the initial pressure-rise reaches an
observer, and another when the pressure returns to normal. This leads to
a distinctive "double boom" from a supersonic aircraft. When the
aircraft is maneuvering, the pressure distribution changes into
different forms, with a characteristic U-wave shape.
Since the boom is being generated continually as long as the
aircraft is supersonic, it fills out a narrow path on the ground
following the aircraft's flight path, a bit like an unrolling red carpet, and hence known as the boom carpet.
Its width depends on the altitude of the aircraft. The distance from
the point on the ground where the boom is heard to the aircraft depends
on its altitude and the angle .
For today's supersonic aircraft in normal operating conditions, the peak overpressure varies from less than 50 to 500 Pa (1 to 10 psf (pound per square foot)) for an N-wave boom. Peak overpressures
for U-waves are amplified two to five times the N-wave, but this
amplified overpressure impacts only a very small area when compared to
the area exposed to the rest of the sonic boom. The strongest sonic boom
ever recorded was 7,000 Pa (144 psf) and it did not cause injury to the
researchers who were exposed to it. The boom was produced by an F-4 flying just above the speed of sound at an altitude of 100 feet (30 m).
In recent tests, the maximum boom measured during more realistic flight
conditions was 1,010 Pa (21 psf). There is a probability that some
damage—shattered glass, for example—will result from a sonic boom.
Buildings in good condition should suffer no damage by pressures of 530
Pa (11 psf) or less. And, typically, community exposure to sonic boom is
below 100 Pa (2 psf). Ground motion resulting from sonic boom is rare and is well below structural damage thresholds accepted by the U.S. Bureau of Mines and other agencies.
The power, or volume, of the shock wave depends on the quantity
of air that is being accelerated, and thus the size and shape of the
aircraft. As the aircraft increases speed the shock cone gets tighter
around the craft and becomes weaker to the point that at very high
speeds and altitudes no boom is heard. The "length" of the boom from
front to back depends on the length of the aircraft to a power of 3/2.
Longer aircraft therefore "spread out" their booms more than smaller
ones, which leads to a less powerful boom.
Several smaller shock waves can and usually do form at other
points on the aircraft, primarily at any convex points, or curves, the
leading wing edge, and especially the inlet to engines. These secondary
shockwaves are caused by the air being forced to turn around these
convex points, which generates a shock wave in supersonic flow.
The later shock waves are somewhat faster than the first one,
travel faster and add to the main shockwave at some distance away from
the aircraft to create a much more defined N-wave shape. This maximizes
both the magnitude and the "rise time" of the shock which makes the boom
seem louder. On most aircraft designs the characteristic distance is
about 40,000 feet (12,000 m), meaning that below this altitude the sonic
boom will be "softer". However, the drag at this altitude or below
makes supersonic travel particularly inefficient, which poses a serious
problem.
Supersonic aircraft
Supersonic
aircraft are any aircraft that can achieve flight faster than Mach 1,
which is supersonic. "Supersonic includes speeds up to five times Mach
than the speed of sound, or Mach 5." (Dunbar, 2015) The top mileage per
hour for a supersonic aircraft normally ranges anywhere from 700 to
1,500 miles per hour (1,100 to 2,400 km/h). Typically, most aircraft do
not exceed 1,500 mph (2,414 km/h). There are many variations of
supersonic aircraft. Some models of a supersonic aircraft make use of
better engineered aerodynamics that allow a few sacrifices in the
aerodynamics of the model for thruster power. Other models use the
efficiency and power of the thruster to allow a less aerodynamic model
to achieve greater speeds. Typical model found in United States military
use ranges from an average of $13 million to $35 million U.S. dollars.
Measurement and examples
The pressure
from sonic booms caused by aircraft is often a few pounds per square
foot. A vehicle flying at greater altitude will generate lower pressures
on the ground, because the shock wave reduces in intensity as it
spreads out away from the vehicle, but the sonic booms are less affected
by vehicle speed.
New research is being performed at NASA's Glenn Research Center
that could help alleviate the sonic boom produced by supersonic
aircraft. Testing was completed in 2010 of a Large-Scale Low-Boom
supersonic inlet model with micro-array flow control. A NASA aerospace
engineer is pictured here in a wind tunnel with the Large-Scale Low-Boom
supersonic inlet model.
In the late 1950s when supersonic transport
(SST) designs were being actively pursued, it was thought that although
the boom would be very large, the problems could be avoided by flying
higher. This assumption was proven false when the North American XB-70Valkyrie
first flew, and it was found that the boom was a problem even at 70,000
feet (21,000 m). It was during these tests that the N-wave was first
characterized.
Richard Seebass and his colleague Albert George at Cornell University studied the problem extensively and eventually defined a "figure of merit"
(FM) to characterize the sonic boom levels of different aircraft. FM is
a function of the aircraft weight and the aircraft length. The lower
this value, the less boom the aircraft generates, with figures of about 1
or lower being considered acceptable. Using this calculation, they
found FMs of about 1.4 for Concorde and 1.9 for the Boeing 2707.
This eventually doomed most SST projects as public resentment, mixed
with politics, eventually resulted in laws that made any such aircraft
less useful (flying supersonically only over water for instance). Small
aeroplane designs like business jets are favoured and tend to produce minimal to no audible booms.
Seebass and George also worked on the problem from a different
angle, trying to spread out the N-wave laterally and temporally
(longitudinally), by producing a strong and downwards-focused (SR-71 Blackbird, Boeing X-43) shock at a sharp, but wide angle nose cone, which will travel at slightly supersonic speed (bow shock), and using a swept back flying wing or an oblique flying wing
to smooth out this shock along the direction of flight (the tail of the
shock travels at sonic speed). To adapt this principle to existing
planes, which generate a shock at their nose cone and an even stronger one at their wing leading edge, the fuselage below the wing is shaped according to the area rule.
Ideally this would raise the characteristic altitude from 40,000 feet
(12,000 m) to 60,000 feet (from 12,000 m to 18,000 m), which is where
most SST aircraft were expected to fly.
NASA F-5E modified for DARPA sonic boom tests
This remained untested for decades, until DARPA started the Quiet Supersonic Platform project and funded the Shaped Sonic Boom Demonstration (SSBD) aircraft to test it. SSBD used an F-5 Freedom Fighter. The F-5E was modified with a highly refined shape which lengthened the nose to that of the F-5F model. The fairing
extended from the nose all the way back to the inlets on the underside
of the aircraft. The SSBD was tested over a two-year period culminating
in 21 flights and was an extensive study on sonic boom characteristics.
After measuring the 1,300 recordings, some taken inside the shock wave
by a chase plane,
the SSBD demonstrated a reduction in boom by about one-third. Although
one-third is not a huge reduction, it could have reduced Concorde's boom
to an acceptable level below FM = 1.
As a follow-on to SSBD, in 2006 a NASA-Gulfstream Aerospace team tested the Quiet Spike
on NASA-Dryden's F-15B aircraft 836. The Quiet Spike is a telescoping
boom fitted to the nose of an aircraft specifically designed to weaken
the strength of the shock waves forming on the nose of the aircraft at
supersonic speeds. Over 50 test flights were performed. Several flights
included probing of the shockwaves by a second F-15B, NASA's Intelligent Flight Control System testbed, aircraft 837.
There are theoretical designs that do not appear to create sonic booms at all, such as the Busemann biplane. However, creating a shockwave is inescapable if they generate aerodynamic lift.
In 2018, NASA awarded Lockheed Martin a $247.5 million contract to construct a design known as the Low Boom Flight Demonstrator, which aims to reduce the boom to the sound of a car door closing. As of November 2022, the first flight was expected in 2023.
Perception, noise and other concerns
A point source emitting spherical fronts while increasing its velocity linearly with time. For short times the Doppler effect is visible. When v = c, the sonic boom is visible. When v > c, the Mach cone is visible.
The sound of a sonic boom depends largely on the distance between the
observer and the aircraft shape producing the sonic boom. A sonic boom
is usually heard as a deep double "boom" as the aircraft is usually some
distance away. The sound is much like that of mortar bombs, commonly used in firework displays.
It is a common misconception that only one boom is generated during the
subsonic to supersonic transition; rather, the boom is continuous along
the boom carpet for the entire supersonic flight. As a former Concorde
pilot puts it, "You don't actually hear anything on board. All we see is
the pressure wave moving down the aeroplane – it gives an indication on
the instruments. And that's what we see around Mach 1. But we don't
hear the sonic boom or anything like that. That's rather like the wake
of a ship – it's behind us."
In 1964, NASA and the Federal Aviation Administration began the Oklahoma City sonic boom tests,
which caused eight sonic booms per day over a period of six months.
Valuable data was gathered from the experiment, but 15,000 complaints
were generated and ultimately entangled the government in a class-action lawsuit, which it lost on appeal in 1969.
Sonic booms were also a nuisance in North Cornwall and North
Devon in the UK as these areas were underneath the flight path of
Concorde. Windows would rattle and in some cases the "torching" (pointing underneath roof slates) would be dislodged with the vibration.
There has been recent work in this area, notably under DARPA's
Quiet Supersonic Platform studies. Research by acoustics experts under
this program began looking more closely at the composition of sonic
booms, including the frequency content. Several characteristics of the
traditional sonic boom "N" wave can influence how loud and irritating it
can be perceived by listeners on the ground. Even strong N-waves such
as those generated by Concorde or military aircraft can be far less
objectionable if the rise time of the over-pressure is sufficiently
long. A new metric has emerged, known as perceived loudness, measured in PLdB. This takes into account the frequency content, rise time, etc. A well-known example is the snapping of one's fingers in which the "perceived" sound is nothing more than an annoyance.
The energy range of sonic boom is concentrated in the 0.1–100 hertzfrequency range that is considerably below that of subsonic aircraft, gunfire and most industrial noise.
Duration of sonic boom is brief; less than a second, 100 milliseconds
(0.1 second) for most fighter-sized aircraft and 500 milliseconds for
the space shuttle or Concorde jetliner. The intensity and width of a
sonic boom path depends on the physical characteristics of the aircraft
and how it is operated. In general, the greater an aircraft's altitude,
the lower the over-pressure on the ground. Greater altitude also
increases the boom's lateral spread, exposing a wider area to the boom.
Over-pressures in the sonic boom impact area, however, will not be
uniform. Boom intensity is greatest directly under the flight path,
progressively weakening with greater horizontal distance away from the
aircraft flight track. Ground width of the boom exposure area is
approximately 1 statute mile (1.6 km) for each 1,000 feet (300 m) of
altitude (the width is about five times the altitude); that is, an
aircraft flying supersonic at 30,000 feet (9,100 m) will create a
lateral boom spread of about 30 miles (48 km). For steady supersonic
flight, the boom is described as a carpet boom since it moves with the
aircraft as it maintains supersonic speed and altitude. Some maneuvers,
diving, acceleration or turning, can cause focusing of the boom. Other
maneuvers, such as deceleration and climbing, can reduce the strength of
the shock. In some instances weather conditions can distort sonic
booms.
Depending on the aircraft's altitude, sonic booms reach the
ground 2 to 60 seconds after flyover. However, not all booms are heard
at ground level. The speed of sound at any altitude is a function of air
temperature. A decrease or increase in temperature results in a
corresponding decrease or increase in sound speed. Under standard
atmospheric conditions, air temperature decreases with increased
altitude. For example, when sea-level temperature is 59 degrees
Fahrenheit (15 °C), the temperature at 30,000 feet (9,100 m) drops to
minus 49 degrees Fahrenheit (−45 °C). This temperature gradient helps
bend the sound waves upward. Therefore, for a boom to reach the ground,
the aircraft speed relative to the ground must be greater than the speed
of sound at the ground. For example, the speed of sound at 30,000 feet
(9,100 m) is about 670 miles per hour (1,080 km/h), but an aircraft must
travel at least 750 miles per hour (1,210 km/h) (Mach 1.12) for a boom
to be heard on the ground.
The composition of the atmosphere is also a factor. Temperature variations, humidity, atmospheric pollution, and winds
can all have an effect on how a sonic boom is perceived on the ground.
Even the ground itself can influence the sound of a sonic boom. Hard
surfaces such as concrete, pavement, and large buildings can cause reflections which may amplify the sound of a sonic boom. Similarly, grassy fields and profuse foliage can help attenuate the strength of the over-pressure of a sonic boom.
Currently there are no industry-accepted standards for the
acceptability of a sonic boom. However, work is underway to create
metrics that will help in understanding how humans respond to the noise
generated by sonic booms.
Until such metrics can be established, either through further study or
supersonic overflight testing, it is doubtful that legislation will be
enacted to remove the current prohibition on supersonic overflight in
place in several countries, including the United States.
Bullwhip
An Australian bullwhip
The cracking sound a bullwhip
makes when properly wielded is, in fact, a small sonic boom. The end of
the whip, known as the "cracker", moves faster than the speed of sound,
thus creating a sonic boom.
A bullwhip tapers down from the handle section to the cracker.
The cracker has much less mass than the handle section. When the whip is
sharply swung, the momentum is transferred down the length of the
tapering whip, the declining mass being made up for with increasing
speed. Goriely
and McMillen showed that the physical explanation is complex, involving
the way that a loop travels down a tapered filament under tension.

-and-flame-sensor.jpg)


_DARPA_sonic_tests_04.07R.jpg)


