Search This Blog

Saturday, May 30, 2015

Meteorology


From Wikipedia, the free encyclopedia

Meteorology is the interdisciplinary scientific study of the atmosphere. Studies in the field stretch back millennia, though significant progress in meteorology did not occur until the 18th century. The 19th century saw modest progress in the field after observing networks formed across several countries. It wasn't until after the development of the computer in the latter half of the 20th century that significant breakthroughs in weather forecasting were achieved.

Meteorological phenomena are observable weather events which illuminate, and are explained by the science of meteorology. Those events are bound by the variables that exist in Earth's atmosphere; temperature, air pressure, water vapor, and the gradients and interactions of each variable, and how they change in time. Different spatial scales are studied to determine how systems on local, regional, and global levels impact weather and climatology.

Meteorology, climatology, atmospheric physics, and atmospheric chemistry are sub-disciplines of the atmospheric sciences. Meteorology and hydrology compose the interdisciplinary field of hydrometeorology. Interactions between Earth's atmosphere and the oceans are part of coupled ocean-atmosphere studies. Meteorology has application in many diverse fields such as the military, energy production, transport, agriculture and construction.

The word "meteorology" is from Greek μετέωρος metéōros "lofty; high (in the sky)" (from μετα- meta- "above" and ἀείρω aeiro "I lift up") and -λογία -logia "-(o)logy", i.e. "the study of things in the air".

History
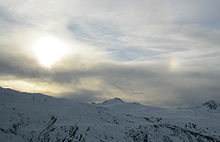

The beginnings of meteorology can be traced back to ancient India,[1] as the Upanishads contain serious discussion about the processes of cloud formation and rain and the seasonal cycles caused by the movement of earth around the sun. Varāhamihira's classical work Brihatsamhita, written about 500 AD,[1] provides clear evidence that a deep knowledge of atmospheric processes existed even in those times.

In 350 BC, Aristotle wrote Meteorology.[2] Aristotle is considered the founder of meteorology.[3] One of the most impressive achievements described in the Meteorology is the description of what is now known as the hydrologic cycle.[4] The Greek scientist Theophrastus compiled a book on weather forecasting, called the Book of Signs. The work of Theophrastus remained a dominant influence in the study of weather and in weather forecasting for nearly 2,000 years.[5] In 25 AD, Pomponius Mela, a geographer for the Roman Empire, formalized the climatic zone system.[6] According to Toufic Fahd, around the 9th century, Al-Dinawari wrote the Kitab al-Nabat (Book of Plants), in which he deals with the application of meteorology to agriculture during the Muslim Agricultural Revolution. He describes the meteorological character of the sky, the planets and constellations, the sun and moon, the lunar phases indicating seasons and rain, the anwa (heavenly bodies of rain), and atmospheric phenomena such as winds, thunder, lightning, snow, floods, valleys, rivers, lakes.[7][8][verification needed]

Research of visual atmospheric phenomena


Twilight at Baker Beach

Ptolemy wrote on the atmospheric refraction of light in the context of astronomical observations.[9] In 1021, Alhazen showed that atmospheric refraction is also responsible for twilight; he estimated that twilight begins when the sun is 19 degrees below the horizon, and also used a geometric determination based on this to estimate the maximum possible height of the earth's atmosphere as 52,000 passuum (about 49 miles, or 79 km).[10]
St. Albert the Great was the first to propose that each drop of falling rain had the form of a small sphere, and that this form meant that the rainbow was produced by light interacting with each raindrop.[11] Roger Bacon was the first to calculate the angular size of the rainbow. He stated that the rainbow summit can not appear higher than 42 degrees above the horizon.[12] In the late 13th century and early 14th century, Kamāl al-Dīn al-Fārisī and Theodoric of Freiberg were the first to give the correct explanations for the primary rainbow phenomenon. Theoderic went further and also explained the secondary rainbow.[13] In 1716, Edmund Halley suggested that aurorae are caused by "magnetic effluvia" moving along the Earth's magnetic field lines.

Instruments and classification scales

A hemispherical cup anemometer

In 1441, King Sejong's son, Prince Munjong, invented the first standardized rain gauge.[citation needed] These were sent throughout the Joseon Dynasty of Korea as an official tool to assess land taxes based upon a farmer's potential harvest. In 1450, Leone Battista Alberti developed a swinging-plate anemometer, and was known as the first anemometer.[14] In 1607, Galileo Galilei constructed a thermoscope. In 1611, Johannes Kepler wrote the first scientific treatise on snow crystals: "Strena Seu de Nive Sexangula (A New Year's Gift of Hexagonal Snow)".[15] In 1643, Evangelista Torricelli invented the mercury barometer.[14] In 1662, Sir Christopher Wren invented the mechanical, self-emptying, tipping bucket rain gauge. In 1714, Gabriel Fahrenheit created a reliable scale for measuring temperature with a mercury-type thermometer.[16] In 1742, Anders Celsius, a Swedish astronomer, proposed the "centigrade" temperature scale, the predecessor of the current Celsius scale.[17] In 1783, the first hair hygrometer was demonstrated by Horace-Bénédict de Saussure. In 1802–1803, Luke Howard wrote On the Modification of Clouds in which he assigns cloud types Latin names.[18] In 1806, Francis Beaufort introduced his system for classifying wind speeds.[19] Near the end of the 19th century the first cloud atlases were published, including the International Cloud Atlas, which has remained in print ever since. The April 1960 launch of the first successful weather satellite, TIROS-1, marked the beginning of the age where weather information became available globally.

Atmospheric composition research

In 1648, Blaise Pascal rediscovered that atmospheric pressure decreases with height, and deduced that there is a vacuum above the atmosphere.[20] In 1738, Daniel Bernoulli published Hydrodynamics, initiating the kinetic theory of gases and established the basic laws for the theory of gases.[21] In 1761, Joseph Black discovered that ice absorbs heat without changing its temperature when melting. In 1772, Black's student Daniel Rutherford discovered nitrogen, which he called phlogisticated air, and together they developed the phlogiston theory.[22] In 1777, Antoine Lavoisier discovered oxygen and developed an explanation for combustion.[23] In 1783, in Lavoisier's book Reflexions sur le phlogistique,[24] he deprecates the phlogiston theory and proposes a caloric theory.[25][26] In 1804, Sir John Leslie observed that a matte black surface radiates heat more effectively than a polished surface, suggesting the importance of black body radiation. In 1808, John Dalton defended caloric theory in A New System of Chemistry and described how it combines with matter, especially gases; he proposed that the heat capacity of gases varies inversely with atomic weight. In 1824, Sadi Carnot analyzed the efficiency of steam engines using caloric theory; he developed the notion of a reversible process and, in postulating that no such thing exists in nature, laid the foundation for the second law of thermodynamics.

Research into cyclones and air flow


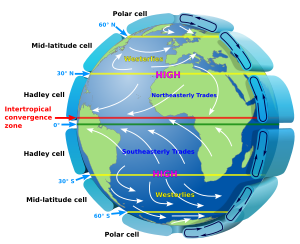
The westerlies and trade winds are part of the earth's atmospheric circulation

In 1494, Christopher Columbus experienced a tropical cyclone, which led to the first written European account of a hurricane.[27] In 1686, Edmund Halley presented a systematic study of the trade winds and monsoons and identified solar heating as the cause of atmospheric motions.[28] In 1735, an ideal explanation of global circulation through study of the trade winds was written by George Hadley.[29] In 1743, when Benjamin Franklin was prevented from seeing a lunar eclipse by a hurricane, he decided that cyclones move in a contrary manner to the winds at their periphery.[30] Understanding the kinematics of how exactly the rotation of the earth affects airflow was partial at first. Gaspard-Gustave Coriolis published a paper in 1835 on the energy yield of machines with rotating parts, such as waterwheels.[31] In 1856, William Ferrel proposed the existence of a circulation cell in the mid-latitudes, with air being deflected by the Coriolis force to create the prevailing westerly winds.[32] Late in the 19th century, the full extent of the large-scale interaction of pressure gradient force and deflecting force that in the end causes air masses to move along isobars was understood. By 1912, this deflecting force was named the Coriolis effect.[33] Just after World War I, a group of meteorologists in Norway led by Vilhelm Bjerknes developed the Norwegian cyclone model that explains the generation, intensification and ultimate decay (the life cycle) of mid-latitude cyclones, introducing the idea of fronts, that is, sharply defined boundaries between air masses.[34] The group included Carl-Gustaf Rossby (who was the first to explain the large scale atmospheric flow in terms of fluid dynamics), Tor Bergeron (who first determined the mechanism by which rain forms) and Jacob Bjerknes.

Observation networks and weather forecasting


Cloud classification by altitude of occurrence

In 1654, Ferdinando II de Medici established the first weather observing network, that consisted of meteorological stations in Florence, Cutigliano, Vallombrosa, Bologna, Parma, Milan, Innsbruck, Osnabrück, Paris and Warsaw.
Collected data were centrally sent to Florence at regular time intervals.[35] In 1832, an electromagnetic telegraph was created by Baron Schilling.[36] The arrival of the electrical telegraph in 1837 afforded, for the first time, a practical method for quickly gathering surface weather observations from a wide area.[37] This data could be used to produce maps of the state of the atmosphere for a region near the earth's surface and to study how these states evolved through time. To make frequent weather forecasts based on these data required a reliable network of observations, but it was not until 1849 that the Smithsonian Institution began to establish an observation network across the United States under the leadership of Joseph Henry.[38] Similar observation networks were established in Europe at this time. In 1854, the United Kingdom government appointed Robert FitzRoy to the new office of Meteorological Statist to the Board of Trade with the role of gathering weather observations at sea. FitzRoy's office became the United Kingdom Meteorological Office in 1854, the first national meteorological service in the world. The first daily weather forecasts made by FitzRoy's Office were published in The Times newspaper in 1860. The following year a system was introduced of hoisting storm warning cones at principal ports when a gale was expected.

Over the next 50 years many countries established national meteorological services. The India Meteorological Department (1875) was established following tropical cyclone and monsoon related famines in the previous decades.[39] The Finnish Meteorological Central Office (1881) was formed from part of Magnetic Observatory of Helsinki University.[40] Japan's Tokyo Meteorological Observatory, the forerunner of the Japan Meteorological Agency, began constructing surface weather maps in 1883.[41] The United States Weather Bureau (1890) was established under the United States Department of Agriculture. The Australian Bureau of Meteorology (1906) was established by a Meteorology Act to unify existing state meteorological services.[42][43]

Numerical weather prediction


A meteorologist at the console of the IBM 7090 in the Joint Numerical Weather Prediction Unit. c. 1965

In 1904, Norwegian scientist Vilhelm Bjerknes first argued in his paper Weather Forecasting as a Problem in Mechanics and Physics that it should be possible to forecast weather from calculations based upon natural laws.[44][45]

It was not until later in the 20th century that advances in the understanding of atmospheric physics led to the foundation of modern numerical weather prediction. In 1922, Lewis Fry Richardson published "Weather Prediction By Numerical Process",[46] after finding notes and derivations he worked on as an ambulance driver in World War I. He described therein how small terms in the prognostic fluid dynamics equations governing atmospheric flow could be neglected, and a finite differencing scheme in time and space could be devised, to allow numerical prediction solutions to be found. Richardson envisioned a large auditorium of thousands of people performing the calculations and passing them to others. However, the sheer number of calculations required was too large to be completed without the use of computers, and the size of the grid and time steps led to unrealistic results in deepening systems. It was later found, through numerical analysis, that this was due to numerical instability.

Starting in the 1950s, numerical forecasts with computers became feasible.[47] The first weather forecasts derived this way used barotropic (single-vertical-level) models, and could successfully predict the large-scale movement of midlatitude Rossby waves, that is, the pattern of atmospheric lows and highs.[48] In 1959, the UK Meteorological Office received its first computer, a Ferranti Mercury.[citation needed]

In the 1960s, the chaotic nature of the atmosphere was first observed and mathematically described by Edward Lorenz, founding the field of chaos theory.[49] These advances have led to the current use of ensemble forecasting in most major forecasting centers, to take into account uncertainty arising from the chaotic nature of the atmosphere.[50] Climate models have been developed that feature a resolution comparable to older weather prediction models. These climate models are used to investigate long-term climate shifts, such as what effects might be caused by human emission of greenhouse gases.

Meteorologists

Meteorologists are scientists who study meteorology.[51] The American Meteorological Society published and continually updates an authoritative electronic Meteorology Glossary.[52] Meteorologists work in government agencies, private consulting and research services, industrial enterprises, utilities, radio and television stations, and in education. In the United States, meteorologists held about 9,400 jobs in 2009.[53]
Meteorologists are best known by the public for weather forecasting. Some radio and television weather forecasters are professional meteorologists, while others are reporters (weather specialist, weatherman, etc.) with no formal meteorological training. The American Meteorological Society and National Weather Association issue "Seals of Approval" to weather broadcasters who meet certain requirements.

Equipment


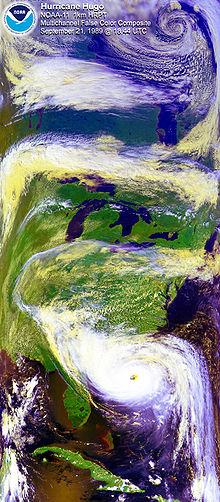
Satellite image of Hurricane Hugo with a polar low visible at the top of the image.

Each science has its own unique sets of laboratory equipment. In the atmosphere, there are many things or qualities of the atmosphere that can be measured. Rain, which can be observed, or seen anywhere and anytime was one of the first ones to be measured historically. Also, two other accurately measured qualities are wind and humidity. Neither of these can be seen but can be felt. The devices to measure these three sprang up in the mid-15th century and were respectively the rain gauge, the anemometer, and the hygrometer. Many attempts had been made prior to the 15th century to construct adequate equipment to measure the many atmospheric variables. Many were faulty in some way or were simply not reliable. Even Aristotle noted this in some of his work; as the difficulty to measure the air.

Sets of surface measurements are important data to meteorologists. They give a snapshot of a variety of weather conditions at one single location and are usually at a weather station, a ship or a weather buoy. The measurements taken at a weather station can include any number of atmospheric observables. Usually, temperature, pressure, wind measurements, and humidity are the variables that are measured by a thermometer, barometer, anemometer, and hygrometer, respectively.[54] Upper air data are of crucial importance for weather forecasting. The most widely used technique is launches of radiosondes. Supplementing the radiosondes a network of aircraft collection is organized by the World Meteorological Organization.

Remote sensing, as used in meteorology, is the concept of collecting data from remote weather events and subsequently producing weather information. The common types of remote sensing are Radar, Lidar, and satellites (or photogrammetry). Each collects data about the atmosphere from a remote location and, usually, stores the data where the instrument is located. Radar and Lidar are not passive because both use EM radiation to illuminate a specific portion of the atmosphere.[55] Weather satellites along with more general-purpose Earth-observing satellites circling the earth at various altitudes have become an indispensable tool for studying a wide range of phenomena from forest fires to El Niño.

Spatial scales

In the study of the atmosphere, meteorology can be divided into distinct areas of emphasis depending on the temporal scope and spatial scope of interest. At one extreme of this scale is climatology. In the timescales of hours to days, meteorology separates into micro-, meso-, and synoptic scale meteorology. Respectively, the geospatial size of each of these three scales relates directly with the appropriate timescale.

Other subclassifications are available based on the need by or by the unique, local or broad effects that are studied within that sub-class.

Microscale

Microscale meteorology is the study of atmospheric phenomena of about 1 km or less. Individual thunderstorms, clouds, and local turbulence caused by buildings and other obstacles (such as individual hills) fall within this category.[56]

Mesoscale

Mesoscale meteorology is the study of atmospheric phenomena that has horizontal scales ranging from microscale limits to synoptic scale limits and a vertical scale that starts at the Earth's surface and includes the atmospheric boundary layer, troposphere, tropopause, and the lower section of the stratosphere. Mesoscale timescales last from less than a day to the lifetime of the event, which in some cases can be weeks. The events typically of interest are thunderstorms, squall lines, fronts, precipitation bands in tropical and extratropical cyclones, and topographically generated weather systems such as mountain waves and sea and land breezes.[57]

Synoptic scale


NOAA: Synoptic scale weather analysis.

Synoptic scale meteorology is generally large area dynamics referred to in horizontal coordinates and with respect to time. The phenomena typically described by synoptic meteorology include events like extratropical cyclones, baroclinic troughs and ridges, frontal zones, and to some extent jet streams. All of these are typically given on weather maps for a specific time. The minimum horizontal scale of synoptic phenomena is limited to the spacing between surface observation stations.[58]

Global scale


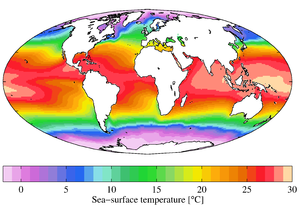
Annual mean sea surface temperatures.

Global scale meteorology is study of weather patterns related to the transport of heat from the tropics to the poles. Also, very large scale oscillations are of importance. These oscillations have time periods typically on the order of months, such as the Madden-Julian Oscillation, or years, such as the El Niño-Southern Oscillation and the Pacific decadal oscillation. Global scale pushes the thresholds of the perception of meteorology into climatology. The traditional definition of climate is pushed into larger timescales with the further understanding of how the global oscillations cause both climate and weather disturbances in the synoptic and mesoscale timescales.

Numerical Weather Prediction is a main focus in understanding air–sea interaction, tropical meteorology, atmospheric predictability, and tropospheric/stratospheric processes.[59] The Naval Research Laboratory in Monterey California developed a global atmospheric model called Navy Operational Global Atmospheric Prediction System (NOGAPS). NOGAPS is run operationally at Fleet Numerical Meteorology and Oceanography Center for the United States Military. Many other global atmospheric models are run by national meteorological agencies.

Some meteorological principles

Boundary layer meteorology

Boundary layer meteorology is the study of processes in the air layer directly above earth's surface, known as the atmospheric boundary layer (ABL). The effects of the surface – heating, cooling, and friction – cause turbulent mixing within the air layer. Significant fluxes of heat, matter, or momentum on time scales of less than a day are advected by turbulent motions.[60] Boundary layer meteorology includes the study of all types of surface–atmosphere boundary, including ocean, lake, urban land and non-urban land for the study of meteorology.

Dynamic meteorology

Dynamic meteorology generally focuses on the fluid dynamics of the atmosphere. The idea of air parcel is used to define the smallest element of the atmosphere, while ignoring the discrete molecular and chemical nature of the atmosphere. An air parcel is defined as a point in the fluid continuum of the atmosphere. The fundamental laws of fluid dynamics, thermodynamics, and motion are used to study the atmosphere. The physical quantities that characterize the state of the atmosphere are temperature, density, pressure, etc. These variables have unique values in the continuum.[61]

Applications

Weather forecasting


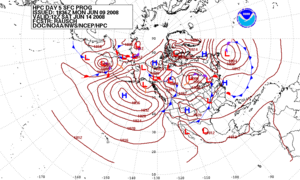
Forecast of surface pressures five days into the future for the north Pacific, North America, and north Atlantic Ocean

Weather forecasting is the application of science and technology to predict the state of the atmosphere for a future time and a given location. Human beings have attempted to predict the weather informally for millennia, and formally since at least the 19th century.[62][63] Weather forecasts are made by collecting quantitative data about the current state of the atmosphere and using scientific understanding of atmospheric processes to project how the atmosphere will evolve.[64]

Once an all-human endeavor based mainly upon changes in barometric pressure, current weather conditions, and sky condition,[65][66] forecast models are now used to determine future conditions. Human input is still required to pick the best possible forecast model to base the forecast upon, which involves pattern recognition skills, teleconnections, knowledge of model performance, and knowledge of model biases. The chaotic nature of the atmosphere, the massive computational power required to solve the equations that describe the atmosphere, error involved in measuring the initial conditions, and an incomplete understanding of atmospheric processes mean that forecasts become less accurate as the difference in current time and the time for which the forecast is being made (the range of the forecast) increases. The use of ensembles and model consensus help narrow the error and pick the most likely outcome.[67][68][69]

There are a variety of end uses to weather forecasts. Weather warnings are important forecasts because they are used to protect life and property.[70] Forecasts based on temperature and precipitation are important to agriculture,[71][72][73][74] and therefore to commodity traders within stock markets. Temperature forecasts are used by utility companies to estimate demand over coming days.[75][76][77] On an everyday basis, people use weather forecasts to determine what to wear on a given day. Since outdoor activities are severely curtailed by heavy rain, snow and the wind chill, forecasts can be used to plan activities around these events, and to plan ahead and survive them.

Aviation meteorology

Aviation meteorology deals with the impact of weather on air traffic management. It is important for air crews to understand the implications of weather on their flight plan as well as their aircraft, as noted by the Aeronautical Information Manual:[78]
The effects of ice on aircraft are cumulative—thrust is reduced, drag increases, lift lessens, and weight increases. The results are an increase in stall speed and a deterioration of aircraft performance. In extreme cases, 2 to 3 inches of ice can form on the leading edge of the airfoil in less than 5 minutes. It takes but 1/2 inch of ice to reduce the lifting power of some aircraft by 50 percent and increases the frictional drag by an equal percentage.[79]

Agricultural meteorology

Meteorologists, soil scientists, agricultural hydrologists, and agronomists are persons concerned with studying the effects of weather and climate on plant distribution, crop yield, water-use efficiency, phenology of plant and animal development, and the energy balance of managed and natural ecosystems. Conversely, they are interested in the role of vegetation on climate and weather.[80]

Hydrometeorology

Hydrometeorology is the branch of meteorology that deals with the hydrologic cycle, the water budget, and the rainfall statistics of storms.[81] A hydrometeorologist prepares and issues forecasts of accumulating (quantitative) precipitation, heavy rain, heavy snow, and highlights areas with the potential for flash flooding. Typically the range of knowledge that is required overlaps with climatology, mesoscale and synoptic meteorology, and other geosciences.[82]

The multidisciplinary nature of the branch can result in technical challenges, since tools and solutions from each of the individual disciplines involved may behave slightly differently, be optimized for different hard- and software platforms and use different data formats. There are some initiatives - such as the DRIHM project[83] - that are trying to address this issue.[84]

Nuclear meteorology

Nuclear meteorology investigates the distribution of radioactive aerosols and gases in the atmosphere.[85]

Maritime meteorology

Maritime meteorology deals with air and wave forecasts for ships operating at sea. Organizations such as the Ocean Prediction Center, Honolulu National Weather Service forecast office, United Kingdom Met Office, and JMA prepare high seas forecasts for the world's oceans.

Military meteorology

Military meteorology is the research and application of meteorology for military purposes. In the United States, the United States Navy's Commander, Naval Meteorology and Oceanography Command oversees meteorological efforts for the Navy and Marine Corps while the United States Air Force's Air Force Weather Agency is responsible for the Air Force and Army.

Fluid dynamics


From Wikipedia, the free encyclopedia


Typical aerodynamic teardrop shape, assuming a viscous medium passing from left to right, the diagram shows the pressure distribution as the thickness of the black line and shows the velocity in the boundary layer as the violet triangles. The green vortex generators prompt the transition to turbulent flow and prevent back-flow also called flow separation from the high pressure region in the back. The surface in front is as smooth as possible or even employs shark-like skin, as any turbulence here will reduce the energy of the airflow. The truncation on the right, known as a Kammback, also prevents backflow from the high pressure region in the back across the spoilers to the convergent part.

In physics, fluid dynamics is a subdiscipline of fluid mechanics that deals with fluid flow—the natural science of fluids (liquids and gases) in motion. It has several subdisciplines itself, including aerodynamics (the study of air and other gases in motion) and hydrodynamics (the study of liquids in motion). Fluid dynamics has a wide range of applications, including calculating forces and moments on aircraft, determining the mass flow rate of petroleum through pipelines, predicting weather patterns, understanding nebulae in interstellar space and modelling fission weapon detonation. Some of its principles are even used in traffic engineering, where traffic is treated as a continuous fluid, and crowd dynamics.

Fluid dynamics offers a systematic structure—which underlies these practical disciplines—that embraces empirical and semi-empirical laws derived from flow measurement and used to solve practical problems. The solution to a fluid dynamics problem typically involves calculating various properties of the fluid, such as flow velocity, pressure, density, and temperature, as functions of space and time.

Before the twentieth century, hydrodynamics was synonymous with fluid dynamics. This is still reflected in names of some fluid dynamics topics, like magnetohydrodynamics and hydrodynamic stability, both of which can also be applied to gases.[1]

Equations of fluid dynamics

The foundational axioms of fluid dynamics are the conservation laws, specifically, conservation of mass, conservation of linear momentum (also known as Newton's Second Law of Motion), and conservation of energy (also known as First Law of Thermodynamics). These are based on classical mechanics and are modified in quantum mechanics and general relativity. They are expressed using the Reynolds Transport Theorem.

In addition to the above, fluids are assumed to obey the continuum assumption. Fluids are composed of molecules that collide with one another and solid objects. However, the continuum assumption considers fluids to be continuous, rather than discrete. Consequently, properties such as density, pressure, temperature, and flow velocity are taken to be well-defined at infinitesimally small points, and are assumed to vary continuously from one point to another. The fact that the fluid is made up of discrete molecules is ignored.

For fluids which are sufficiently dense to be a continuum, do not contain ionized species, and have flow velocities small in relation to the speed of light, the momentum equations for Newtonian fluids are the Navier–Stokes equations, which is a non-linear set of differential equations that describes the flow of a fluid whose stress depends linearly on flow velocity gradients and pressure. The unsimplified equations do not have a general closed-form solution, so they are primarily of use in Computational Fluid Dynamics. The equations can be simplified in a number of ways, all of which make them easier to solve. Some of them allow appropriate fluid dynamics problems to be solved in closed form.[citation needed]

In addition to the mass, momentum, and energy conservation equations, a thermodynamical equation of state giving the pressure as a function of other thermodynamic variables for the fluid is required to completely specify the problem. An example of this would be the perfect gas equation of state:
p= \frac{\rho R_u T}{M}
where p is pressure, ρ is density, Ru is the gas constant, M is molar mass and T is temperature.

Conservation laws

Three conservation laws are used to solve fluid dynamics problems, and may be written in integral or differential form. Mathematical formulations of these conservation laws may be interpreted by considering the concept of a control volume. A control volume is a specified volume in space through which air can flow in and out. Integral formulations of the conservation laws consider the change in mass, momentum, or energy within the control volume. Differential formulations of the conservation laws apply Stokes' theorem to yield an expression which may be interpreted as the integral form of the law applied to an infinitesimal volume at a point within the flow.
  • Mass continuity (conservation of mass): The rate of change of fluid mass inside a control volume must be equal to the net rate of fluid flow into the volume. Physically, this statement requires that mass is neither created nor destroyed in the control volume,[2] and can be translated into the integral form of the continuity equation:
{\partial \over \partial t} \iiint_V \rho \, dV = - \, {} \oiint{\scriptstyle S}{}\,\rho\mathbf{u}\cdot d\mathbf{S}
Above, \rho is the fluid density, u is the flow velocity vector, and t is time. The left-hand side of the above expression contains a triple integral over the control volume, whereas the right-hand side contains a surface integral over the surface of the control volume. The differential form of the continuity equation is, by the divergence theorem:
\ {\partial \rho \over \partial t} + \nabla \cdot (\rho \mathbf{u}) = 0
  • Conservation of momentum: This equation applies Newton's second law of motion to the control volume, requiring that any change in momentum of the air within a control volume be due to the net flow of air into the volume and the action of external forces on the air within the volume. In the integral formulation of this equation, body forces here are represented by fbody, the body force per unit mass. Surface forces, such as viscous forces, are represented by \mathbf{F}_\text{surf}, the net force due to stresses on the control volume surface.
 \frac{\partial}{\partial t} \iiint_{\scriptstyle V} \rho\mathbf{u} \, dV = -\, {} \oiint_{\scriptstyle S}  (\rho\mathbf{u}\cdot d\mathbf{S}) \mathbf{u} -{} \oiint{\scriptstyle S} {}\, p \, d\mathbf{S} \displaystyle{}+ \iiint_{\scriptstyle V} \rho \mathbf{f}_\text{body} \, dV + \mathbf{F}_\text{surf}
The differential form of the momentum conservation equation is as follows. Here, both surface and body forces are accounted for in one total force, F. For example, F may be expanded into an expression for the frictional and gravitational forces acting on an internal flow.
\ {D \mathbf{u} \over D t} = \mathbf{F} - {\nabla p \over \rho}
In aerodynamics, air is assumed to be a Newtonian fluid, which posits a linear relationship between the shear stress (due to internal friction forces) and the rate of strain of the fluid. The equation above is a vector equation: in a three-dimensional flow, it can be expressed as three scalar equations. The conservation of momentum equations for the compressible, viscous flow case are called the Navier–Stokes equations.[citation needed]
\ \rho {Dh \over Dt} = {D p \over D t} + \nabla \cdot \left( k \nabla T\right) + \Phi
Above, h is enthalpy, k is the thermal conductivity of the fluid, T is temperature, and \Phi is the viscous dissipation function. The viscous dissipation function governs the rate at which mechanical energy of the flow is converted to heat. The second law of thermodynamics requires that the dissipation term is always positive: viscosity cannot create energy within the control volume.[3] The expression on the left side is a material derivative.

Compressible vs incompressible flow

All fluids are compressible to some extent, that is, changes in pressure or temperature will result in changes in density. However, in many situations the changes in pressure and temperature are sufficiently small that the changes in density are negligible. In this case the flow can be modelled as an incompressible flow. Otherwise the more general compressible flow equations must be used.

Mathematically, incompressibility is expressed by saying that the density ρ of a fluid parcel does not change as it moves in the flow field, i.e.,
\frac{\mathrm{D} \rho}{\mathrm{D}t} = 0 \, ,
where D/Dt is the substantial derivative, which is the sum of local and convective derivatives. This additional constraint simplifies the governing equations, especially in the case when the fluid has a uniform density.

For flow of gases, to determine whether to use compressible or incompressible fluid dynamics, the Mach number of the flow is to be evaluated. As a rough guide, compressible effects can be ignored at Mach numbers below approximately 0.3. For liquids, whether the incompressible assumption is valid depends on the fluid properties (specifically the critical pressure and temperature of the fluid) and the flow conditions (how close to the critical pressure the actual flow pressure becomes). Acoustic problems always require allowing compressibility, since sound waves are compression waves involving changes in pressure and density of the medium through which they propagate.

Inviscid vs Newtonian and non-Newtonian fluids


Potential flow around a wing

Viscous problems are those in which fluid friction has significant effects on the fluid motion.

The Reynolds number, which is a ratio between inertial and viscous forces, can be used to evaluate whether viscous or inviscid equations are appropriate to the problem.

Stokes flow is flow at very low Reynolds numbers, Re << 1, such that inertial forces can be neglected compared to viscous forces.

On the contrary, high Reynolds numbers indicate that the inertial forces are more significant than the viscous (friction) forces. Therefore, we may assume the flow to be an inviscid flow, an approximation in which we neglect viscosity completely, compared to inertial terms.

This idea can work fairly well when the Reynolds number is high. However, certain problems such as those involving solid boundaries, may require that the viscosity be included. Viscosity often cannot be neglected near solid boundaries because the no-slip condition can generate a thin region of large strain rate (known as Boundary layer) which enhances the effect of even a small amount of viscosity, and thus generating vorticity. Therefore, to calculate net forces on bodies (such as wings) we should use viscous flow equations. As illustrated by d'Alembert's paradox, a body in an inviscid fluid will experience no drag force. The standard equations of inviscid flow are the Euler equations. Another often used model, especially in computational fluid dynamics, is to use the Euler equations away from the body and the boundary layer equations, which incorporates viscosity, in a region close to the body.

The Euler equations can be integrated along a streamline to get Bernoulli's equation. When the flow is everywhere irrotational and inviscid, Bernoulli's equation can be used throughout the flow field. Such flows are called potential flows.

Sir Isaac Newton showed how stress and the rate of strain are very close to linearly related for many familiar fluids, such as water and air. These Newtonian fluids are modelled by a viscosity that is independent of strain rate, depending primarily on the specific fluid.

However, some of the other materials, such as emulsions and slurries and some visco-elastic materials (e.g. blood, some polymers), have more complicated non-Newtonian stress-strain behaviours. These materials include sticky liquids such as latex, honey, and lubricants which are studied in the sub-discipline of rheology.

Steady vs unsteady flow


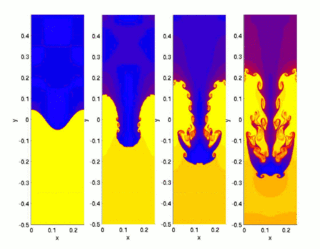
Hydrodynamics simulation of the Rayleigh–Taylor instability [4]

When all the time derivatives of a flow field vanish, the flow is considered to be a steady flow. Steady-state flow refers to the condition where the fluid properties at a point in the system do not change over time. Otherwise, flow is called unsteady (also called transient[5]). Whether a particular flow is steady or unsteady, can depend on the chosen frame of reference. For instance, laminar flow over a sphere is steady in the frame of reference that is stationary with respect to the sphere. In a frame of reference that is stationary with respect to a background flow, the flow is unsteady.

Turbulent flows are unsteady by definition. A turbulent flow can, however, be statistically stationary. According to Pope:[6]
The random field U(x,t) is statistically stationary if all statistics are invariant under a shift in time.
This roughly means that all statistical properties are constant in time. Often, the mean field is the object of interest, and this is constant too in a statistically stationary flow.

Steady flows are often more tractable than otherwise similar unsteady flows. The governing equations of a steady problem have one dimension fewer (time) than the governing equations of the same problem without taking advantage of the steadiness of the flow field.

Laminar vs turbulent flow

Turbulence is flow characterized by recirculation, eddies, and apparent randomness. Flow in which turbulence is not exhibited is called laminar. It should be noted, however, that the presence of eddies or recirculation alone does not necessarily indicate turbulent flow—these phenomena may be present in laminar flow as well. Mathematically, turbulent flow is often represented via a Reynolds decomposition, in which the flow is broken down into the sum of an average component and a perturbation component.

It is believed that turbulent flows can be described well through the use of the Navier–Stokes equations. Direct numerical simulation (DNS), based on the Navier–Stokes equations, makes it possible to simulate turbulent flows at moderate Reynolds numbers. Restrictions depend on the power of the computer used and the efficiency of the solution algorithm. The results of DNS have been found to agree well with experimental data for some flows.[7]

Most flows of interest have Reynolds numbers much too high for DNS to be a viable option,[8] given the state of computational power for the next few decades. Any flight vehicle large enough to carry a human (L > 3 m), moving faster than 72 km/h (20 m/s) is well beyond the limit of DNS simulation (Re = 4 million). Transport aircraft wings (such as on an Airbus A300 or Boeing 747) have Reynolds numbers of 40 million (based on the wing chord). In order to solve these real-life flow problems, turbulence models will be a necessity for the foreseeable future. Reynolds-averaged Navier–Stokes equations (RANS) combined with turbulence modelling provides a model of the effects of the turbulent flow. Such a modelling mainly provides the additional momentum transfer by the Reynolds stresses, although the turbulence also enhances the heat and mass transfer. Another promising methodology is large eddy simulation (LES), especially in the guise of detached eddy simulation (DES)—which is a combination of RANS turbulence modelling and large eddy simulation.

Subsonic vs transonic, supersonic and hypersonic flows

While many terrestrial flows (e.g. flow of water through a pipe) occur at low mach numbers, many flows of practical interest (e.g. in aerodynamics) occur at high fractions of the Mach Number M=1 or in excess of it (supersonic flows). New phenomena occur at these Mach number regimes (e.g. shock waves for supersonic flow, transonic instability in a regime of flows with M nearly equal to 1, non-equilibrium chemical behaviour due to ionization in hypersonic flows) and it is necessary to treat each of these flow regimes separately.

Magnetohydrodynamics

Magnetohydrodynamics is the multi-disciplinary study of the flow of electrically conducting fluids in electromagnetic fields. Examples of such fluids include plasmas, liquid metals, and salt water. The fluid flow equations are solved simultaneously with Maxwell's equations of electromagnetism.

Other approximations

There are a large number of other possible approximations to fluid dynamic problems. Some of the more commonly used are listed below.

Terminology in fluid dynamics

The concept of pressure is central to the study of both fluid statics and fluid dynamics. A pressure can be identified for every point in a body of fluid, regardless of whether the fluid is in motion or not. Pressure can be measured using an aneroid, Bourdon tube, mercury column, or various other methods.

Some of the terminology that is necessary in the study of fluid dynamics is not found in other similar areas of study. In particular, some of the terminology used in fluid dynamics is not used in fluid statics.

Terminology in incompressible fluid dynamics

The concepts of total pressure and dynamic pressure arise from Bernoulli's equation and are significant in the study of all fluid flows. (These two pressures are not pressures in the usual sense—they cannot be measured using an aneroid, Bourdon tube or mercury column.) To avoid potential ambiguity when referring to pressure in fluid dynamics, many authors use the term static pressure to distinguish it from total pressure and dynamic pressure. Static pressure is identical to pressure and can be identified for every point in a fluid flow field.

In Aerodynamics, L.J. Clancy writes:[9] To distinguish it from the total and dynamic pressures, the actual pressure of the fluid, which is associated not with its motion but with its state, is often referred to as the static pressure, but where the term pressure alone is used it refers to this static pressure.

A point in a fluid flow where the flow has come to rest (i.e. speed is equal to zero adjacent to some solid body immersed in the fluid flow) is of special significance. It is of such importance that it is given a special name—a stagnation point. The static pressure at the stagnation point is of special significance and is given its own name—stagnation pressure. In incompressible flows, the stagnation pressure at a stagnation point is equal to the total pressure throughout the flow field.

Terminology in compressible fluid dynamics

In a compressible fluid, such as air, the temperature and density are essential when determining the state of the fluid. In addition to the concept of total pressure (also known as stagnation pressure), the concepts of total (or stagnation) temperature and total (or stagnation) density are also essential in any study of compressible fluid flows. To avoid potential ambiguity when referring to temperature and density, many authors use the terms static temperature and static density. Static temperature is identical to temperature; and static density is identical to density; and both can be identified for every point in a fluid flow field.

The temperature and density at a stagnation point are called stagnation temperature and stagnation density.

A similar approach is also taken with the thermodynamic properties of compressible fluids. Many authors use the terms total (or stagnation) enthalpy and total (or stagnation) entropy. The terms static enthalpy and static entropy appear to be less common, but where they are used they mean nothing more than enthalpy and entropy respectively, and the prefix "static" is being used to avoid ambiguity with their 'total' or 'stagnation' counterparts. Because the 'total' flow conditions are defined by isentropically bringing the fluid to rest, the total (or stagnation) entropy is by definition always equal to the "static" entropy.

Updated NASA Data: Global Warming Not Causing Any Polar Ice [Area] Retreat


Original link:   http://www.forbes.com/sites/jamestaylor/2015/05/19/updated-nasa-data-polar-ice-not-receding-after-all/ 

Updated data from NASA satellite instruments reveal the Earth’s polar ice caps have not receded at all [in area] since the satellite instruments began measuring the ice caps in 1979. Since the end of 2012, moreover, total polar ice extent has largely remained above the post-1979 average. The updated data contradict one of the most frequently asserted global warming claims – that global warming is causing the polar ice caps to recede.

The timing of the 1979 NASA satellite instrument launch could not have been better for global warming alarmists.

The late 1970s marked the end of a 30-year cooling trend. As a result, the polar ice caps were quite likely more extensive than they had been since at least the 1920s. Nevertheless, this abnormally extensive 1979 polar ice extent would appear to be the “normal” baseline when comparing post-1979 polar ice extent.

Updated NASA satellite data show the polar ice caps remained at approximately their 1979 extent until the middle of the last decade. Beginning in 2005, however, polar ice modestly receded for several years. By 2012, polar sea ice had receded by approximately 10 percent from 1979 measurements. (Total polar ice area – factoring in both sea and land ice – had receded by much less than 10 percent, but alarmists focused on the sea ice loss as “proof” of a global warming crisis.)
NASA satellite measurements show the polar ice caps have not retreated at all.

A 10-percent decline in polar sea ice is not very remarkable, especially considering the 1979 baseline was abnormally high anyway. Regardless, global warming activists and a compliant news media frequently and vociferously claimed the modest polar ice cap retreat was a sign of impending catastrophe. Al Gore even predicted the Arctic ice cap could completely disappear by 2014.

In late 2012, however, polar ice dramatically rebounded and quickly surpassed the post-1979 average. Ever since, the polar ice caps have been at a greater average extent than the post-1979 mean.

Now, in May 2015, the updated NASA data show polar sea ice is approximately 5 percent above the post-1979 average.

During the modest decline in 2005 through 2012, the media presented a daily barrage of melting ice cap stories.
Since the ice caps rebounded – and then some – how have the media reported the issue?

The frequency of polar ice cap stories may have abated, but the tone and content has not changed at all. Here are some of the titles of news items I pulled yesterday from the front two pages of a Google News search for “polar ice caps”:

Climate change is melting more than just the polar ice caps

2020: Antarctic ice shelf could collapse

An Arctic ice cap’s shockingly rapid slide into the sea

New satellite maps show polar ice caps melting at ‘unprecedented rate’

The only Google News items even hinting that the polar ice caps may not have melted so much (indeed not at all) came from overtly conservative websites. The “mainstream” media is alternating between maintaining radio silence on the extended run of above-average polar ice and falsely asserting the polar ice caps are receding at an alarming rate.

To be sure, receding polar ice caps are an expected result of the modest global warming we can expect in the years ahead. In and of themselves, receding polar ice caps have little if any negative impact on human health and welfare, and likely a positive benefit by opening up previously ice-entombed land to human, animal, and plant life.

Nevertheless, polar ice cap extent will likely be a measuring stick for how much the planet is or is not warming.

The Earth has warmed modestly since the Little Ice Age ended a little over 100 years ago, and the Earth will likely continue to warm modestly as a result of natural and human factors. As a result, at some point in time, NASA satellite instruments should begin to report a modest retreat of polar ice caps. The modest retreat – like that which happened briefly from 2005 through 2012 – would not be proof or evidence of a global warming crisis. Such a retreat would merely illustrate that global temperatures are continuing their gradual recovery from the Little Ice Age. Such a recovery – despite alarmist claims to the contrary – would not be uniformly or even on balance detrimental to human health and welfare. Instead, an avalanche of scientific evidence indicates recently warming temperatures have significantly improved human health and welfare, just as warming temperatures have always done.

Friday, May 29, 2015

Olbers' paradox


From Wikipedia, the free encyclopedia


Olbers' paradox in action

In astrophysics and physical cosmology, Olbers' paradox, named after the German astronomer Heinrich Wilhelm Olbers (1758–1840) and also called the "dark night sky paradox", is the argument that the darkness of the night sky conflicts with the assumption of an infinite and eternal static universe. The darkness of the night sky is one of the pieces of evidence for a non-static universe such as the Big Bang model. If the universe is static, homogeneous at a large scale, and populated by an infinite number of stars, any sight line from Earth must end at the (very bright) surface of a star, so the night sky should be completely bright. This contradicts the observed darkness of the night.

History

Edward Robert Harrison's Darkness at Night: A Riddle of the Universe (1987) gives an account of the dark night sky paradox, seen as a problem in the history of science. According to Harrison, the first to conceive of anything like the paradox was Thomas Digges, who was also the first to expound the Copernican system in English and also postulated an infinite universe with infinitely many stars.[1] Kepler also posed the problem in 1610, and the paradox took its mature form in the 18th century work of Halley and Cheseaux.[2] The paradox is commonly attributed to the German amateur astronomer Heinrich Wilhelm Olbers, who described it in 1823, but Harrison shows convincingly that Olbers was far from the first to pose the problem, nor was his thinking about it particularly valuable. Harrison argues that the first to set out a satisfactory resolution of the paradox was Lord Kelvin, in a little known 1901 paper,[3] and that Edgar Allan Poe's essay Eureka (1848) curiously anticipated some qualitative aspects of Kelvin's argument:
Were the succession of stars endless, then the background of the sky would present us a uniform luminosity, like that displayed by the Galaxy – since there could be absolutely no point, in all that background, at which would not exist a star. The only mode, therefore, in which, under such a state of affairs, we could comprehend the voids which our telescopes find in innumerable directions, would be by supposing the distance of the invisible background so immense that no ray from it has yet been able to reach us at all.[4]

The paradox


What if every line of sight ended in a star? (Infinite universe assumption#2)

The paradox is that a static, infinitely old universe with an infinite number of stars distributed in an infinitely large space would be bright rather than dark.

To show this, we divide the universe into a series of concentric shells, 1 light year thick. Thus, a certain number of stars will be in the shell 1,000,000,000 to 1,000,000,001 light years away. If the universe is homogeneous at a large scale, then there would be four times as many stars in a second shell between 2,000,000,000 to 2,000,000,001 light years away. However, the second shell is twice as far away, so each star in it would appear four times dimmer than the first shell. Thus the total light received from the second shell is the same as the total light received from the first shell.

Thus each shell of a given thickness will produce the same net amount of light regardless of how far away it is. That is, the light of each shell adds to the total amount. Thus the more shells, the more light. And with infinitely many shells there would be a bright night sky.

Dark clouds could obstruct the light. But in that case the clouds would heat up, until they were as hot as stars, and then radiate the same amount of light.

Kepler saw this as an argument for a finite observable universe, or at least for a finite number of stars. In general relativity theory, it is still possible for the paradox to hold in a finite universe:[5] though the sky would not be infinitely bright, every point in the sky would still be like the surface of a star.

In a universe of three dimensions with stars distributed evenly, the number of stars would be proportional to volume. If the surface of concentric sphere shells were considered, the number of stars on each shell would be proportional to the square of the radius of the shell. In the picture above, the shells are reduced to rings in two dimensions with all of the stars on them.

The mainstream explanation

Poet Edgar Allan Poe suggested that the finite size of the observable universe resolves the apparent paradox.[6] More specifically, because the universe is finitely old and the speed of light is finite, only finitely many stars can be observed within a given volume of space visible from Earth (although the whole universe can be infinite in space).[7] The density of stars within this finite volume is sufficiently low that any line of sight from Earth is unlikely to reach a star.
However, the Big Bang theory introduces a new paradox: it states that the sky was much brighter in the past, especially at the end of the recombination era, when it first became transparent. All points of the local sky at that era were comparable in brightness to the surface of the Sun, due to the high temperature of the universe in that era; and most light rays will terminate not in a star but in the relic of the Big Bang.

This paradox is explained by the fact that the Big Bang theory also involves the expansion of space which can cause the energy of emitted light to be reduced via redshift. More specifically, the extreme levels of radiation from the Big Bang have been redshifted to microwave wavelengths (1100 times longer than its original wavelength) as a result of the cosmic expansion, and thus form the cosmic microwave background radiation. This explains the relatively low light densities present in most of our sky despite the assumed bright nature of the Big Bang. The redshift also affects light from distant stars and quasars, but the diminution is minor, since the most distant galaxies and quasars have redshifts of only around 5 to 8.6.

Alternative explanations

Steady state

The redshift hypothesised in the Big Bang model would by itself explain the darkness of the night sky, even if the universe were infinitely old. The steady state cosmological model assumed that the universe is infinitely old and uniform in time as well as space. There is no Big Bang in this model, but there are stars and quasars at arbitrarily great distances. The expansion of the universe will cause the light from these distant stars and quasars to be redshifted (by the Doppler effect), so that the total light flux from the sky remains finite. However, observations of the reduction in [radio] light-flux with distance in the 1950s and 1960s showed that it did not drop as rapidly as the Steady State model predicted. Moreover, the Steady State model predicts that stars should (collectively) be visible at all redshifts (provided that their light is not drowned out by nearer stars, of course). Thus, it does not predict a distinct background at fixed temperature as the Big Bang does. And the steady-state model cannot be modified to predict the temperature distribution of the microwave background accurately.[8]

Finite age of stars

Stars have a finite age and a finite power, thereby implying that each star has a finite impact on a sky's light field density. Edgar Allan Poe suggested that this idea could provide a resolution to Olbers' paradox; a related theory was also proposed by Jean-Philippe de Chéseaux. However, stars are continually being born as well as dying. As long as the density of stars throughout the universe remains constant, regardless of whether the universe itself has a finite or infinite age, there would be infinitely many other stars in the same angular direction, with an infinite total impact. So the finite age of the stars does not explain the paradox.[9]

Brightness

Suppose that the universe were not expanding, and always had the same stellar density; then the temperature of the universe would continually increase as the stars put out more radiation. Eventually, it would reach 3000 K (corresponding to a typical photon energy of 0.3 eV and so a frequency of 7.5×10¹³ Hz), and the photons would begin to be absorbed by the hydrogen plasma filling most of the universe, rendering outer space opaque. This maximal radiation density corresponds to about 1.2×10¹⁷ eV/m3 = 2.1×10¹⁹ kg/m3, which is much greater than the observed value of 4.7×1031 kg/m3.[2] So the sky is about fifty billion times darker than it would be if the universe were neither expanding nor too young to have reached equilibrium yet.

Fractal star distribution

A different resolution, which does not rely on the Big Bang theory, was first proposed by Carl Charlier in 1908 and later rediscovered by Benoît Mandelbrot in 1974. They both postulated that if the stars in the universe were distributed in a hierarchical fractal cosmology (e.g., similar to Cantor dust)—the average density of any region diminishes as the region considered increases—it would not be necessary to rely on the Big Bang theory to explain Olbers' paradox. This model would not rule out a Big Bang but would allow for a dark sky even if the Big Bang had not occurred.

Mathematically, the light received from stars as a function of star distance in a hypothetical fractal cosmos is:
\text{light}=\int_{r_0}^\infty L(r) N(r)\,dr
where:
r0 = the distance of the nearest star. r0 > 0;
r = the variable measuring distance from the Earth;
L(r) = average luminosity per star at distance r;
N(r) = number of stars at distance r.

The function of luminosity from a given distance L(r)N(r) determines whether the light received is finite or infinite. For any luminosity from a given distance L(r)N(r) proportional to ra, \text{light} is infinite for a ≥ −1 but finite for a < −1. So if L(r) is proportional to r−2, then for \text{light} to be finite, N(r) must be proportional to rb, where b < 1. For b = 1, the numbers of stars at a given radius is proportional to that radius. When integrated over the radius, this implies that for b = 1, the total number of stars is proportional to r2. This would correspond to a fractal dimension of 2. Thus the fractal dimension of the universe would need to be less than 2 for this explanation to work.

This explanation is not widely accepted among cosmologists since the evidence suggests that the fractal dimension of the universe is at least 2.[10][11][12] Moreover, the majority of cosmologists accept the cosmological principle, which assumes that matter at the scale of billions of light years is distributed isotropically. Contrarily, fractal cosmology requires anisotropic matter distribution at the largest scales.

Companies rush to build ‘biofactories’ for medicines, flavorings and fuels

For scientist Jack Newman, creating a new life-form has become as simple as this: He types out a DNA sequence on his laptop. Clicks “send.” And a few yards away in the laboratory, robotic arms mix together some compounds to produce the desired cells.

Newman’s biotech company is creating new organisms, most forms of genetically modified yeast, at the dizzying rate of more than 1,500 a day. Some convert sugar into medicines. Others create moisturizers that can be used in cosmetics. And still others make biofuel, a renewable energy source usually made from corn.

“You can now build a cell the same way you might build an app for your iPhone,” said Newman, chief science officer of Amyris.

Some believe this kind of work marks the beginning of a third industrial revolution — one based on using living systems as “bio-factories” for creating substances that are either too tricky or too expensive to grow in nature or to make with petrochemicals.

The rush to biological means of production promises to revolutionize the chemical industry and transform the economy, but it also raises questions about environmental safety and biosecurity and revives ethical debates about “playing God.” Hundreds of products are in the pipeline.

Laboratory-grown artemisinin, a key anti-malarial drug, went on sale in April with the potential to help stabilize supply issues. A vanilla flavoring that promises to be significantly cheaper than the costly extract made from beans grown in rain forests is scheduled to hit the markets in 2014.

On Wednesday, Amyris announced another milestone — a memorandum of understanding with Brazil’s largest low-cost airline, GOL Linhas Aereas, to begin using a jet fuel produced by yeast starting in 2014.

Proponents characterize bio-factories as examples of “green technology” that are sustainable and immune to fickle weather and disease. Backers say they will reshape how we use land globally, reducing the cultivation of cash crops in places where that practice hurts the environment, break our dependence on pesticides and result in the closure of countless industrial factories that pollute the air and water.

But some environmental groups are skeptical.

They compare the spread of bio-factories to the large-scale burning of coal at the turn of the 20th century — a development with implications for carbon dioxide emissions and global warming that weren’t understood until decades later.

Much of the early hype surrounding this technology was about biofuels — the dream of engineering colonies of yeast that could produce enough fuel to power whole cities. It turned out that the technical hurdles were easier to overcome than the economic ones. Companies haven’t been able to find a way to produce enough of it to make the price affordable, and so far the biofuels have been used only in smaller projects, such as local buses and Amyris’s experiment with GOL’s planes.

But dozens of other products are close to market, including synthetic versions of fragrances extracted from grass, coconut oil and saffron powder, as well as a gas used to make car tires. Other applications are being studied in the laboratory: biosensors that light up when a parasite is detected in water; goats with spider genes that produce super-strength silk in their milk; and synthetic bacteria that decompose trash and break down oil spills and other contaminated waste at a rapid pace.

Revenue from industrial chemicals made through synthetic biology is already as high as $1.5 billion, and it will increase at an annual rate of 15 to 25 percent for the next few years, according to an estimate by Mark Bünger, an analyst for Lux Research, a Boston-based advisory firm that focuses on emerging technologies.
 
Reengineering yeast

Since it was founded a decade ago, Amyris has become a legend in the field that sits at the intersection of biology and engineering, creating more than 3 million organisms. Unlike traditional genetic engineering, which typically involves swapping a few genes, the scientists are building entire genomes from scratch.

Keeping bar-code-stamped vials in giant refrigerators at minus-80 degrees, the company’s repository in Emeryville, Calif., is one of the world’s largest collections of living organisms that do not exist in nature.

Ten years ago, when Newman was a postdoctoral student at the University of California at Berkeley, the idea of being able to program cells on a computer was fanciful.

Newman was working in a chemical engineering lab run by biotech pioneer Jay Keasling and helping conduct research on how to rewrite the metabolic pathways of microorganisms to produce useful substances.

Their first target was yeast.

The product of millions of years of evolution, the single-celled organism was capable of a miraculous feat: When fed sugar, it produced energy and excreted alcohol and carbon dioxide. Humans have harnessed this power for centuries to make wine, beer, cheese and other products. Could they tinker with some genes in the yeast to create a biological machine capable of producing medicine?

Excited about the idea of trying to apply the technology to a commercial product, Keasling, Newman and two other young post-docs — Keith Kinkead Reiling and Neil Renninger — started Amyris in 2003 and set their sights on artemisinin, an ancient herbal remedy found to be more than 90 percent effective at curing those infected with malaria.

It is harvested from the leaves of the sweet wormwood plant, but the supply of the plant had sometimes fluctuated in the past, causing shortages.

The new company lined up high-profile investors: the Bill & Melinda Gates Foundation, which gave $42.6 million to a nonprofit organization to help finance the research, and Silicon Valley luminaries John Doerr and Vinod Khosla, who as part of a group invested $20 million.

As of this month, Amyris said its partner, pharmaceutical giant Sanofi, has manufactured 35 tons of artemisinin — roughly equivalent to 70 million courses of treatment. The World Health Organization gave its stamp of approval to the drug in May, and the pills are being used widely.
 
Concerns about risks

The early scientific breakthroughs by the Amyris founders paved the way for dozens of other companies to do similar work. The next major product to be released is likely to be a vanilla flavoring by Evolva, a Swiss company that has laboratories in the San Francisco Bay area.

Cultivated in the remote forests of Madagascar, Mexico and the West Indies, natural vanilla is one of the world’s most revered spices. But companies that depend on the ingredient to flavor their products have long struggled with its scarcity and the volatility of its price.

Its chemically synthesized cousins, which are made from petrochemicals and paper pulp waste and are three to five times cheaper, have 99 percent of the vanilla market but have failed to match the natural version’s complexity.

Now scientists in a lab in Denmark believe they’ve created a type of vanilla flavoring produced by yeast that they say will be more satisfying to the palate and cheaper at the same time.

In Evolva’s case, much of the controversy has focused on whether the flavoring can be considered “natural.” Evolva boasts that it is, because only the substance used to produce the flavoring was genetically modified — not what people actually consume.

“From my point of view it’s fundamentally as natural as beer or bread,” said Evolva chief executive Neil Goldsmith, who is a co-founder of the company. “Neither brewer’s or baker’s yeast is identical to yeast in the wild. I’m comfortable that if beer is natural, then this is natural.”

That justification has caused an uproar among some consumer protection and environmental groups. They say that representing Evolva’s laboratory-grown flavoring as something similar to vanilla extract from an orchid plant is deceptive, and they have mounted a global campaign urging food companies to boycott the “vanilla grown in a petri dish.”

“Any ice-cream company that calls this all-natural vanilla would be committing fraud,” argues Jaydee Hanson, a senior policy analyst at the Center for Food Safety, a nonprofit public interest group based in Washington.

Jim Thomas, a researcher for the ETC Group, said there is a larger issue that applies to all organisms produced by synthetic biology techniques: What if they are accidentally released and evolve to have harmful characteristics?

“There is no regulatory structure or even protocols for assessing the safety of synthetic organisms in the environment,” Thomas said.

Then there’s the potential economic impact. What about the hundreds of thousands of small farmers who produce these crops now?

Artemisinin is farmed by an estimated 100,000 people in Kenya, Tanzania, Vietnam and China and the vanilla plant by 200,000 in Madagascar, Mexico and beyond.

Evolva officials say they believe there will still be a strong market for artisan ingredients like vanilla from real beans and that history has shown that these products typically attract an even higher premium when new products hit the market.

Other biotech executives say they are sympathetic, but that it is the price of progress. Amyris’s Newman says he is confused by environmental groups’ criticism and points to the final chapter of Rachel Carson’s “Silent Spring” — the seminal book that is credited with launching the environmental movement. In it, Carson mentions ways that science can solve the environmental hazards we have endured through years of use of fossil fuels and petrochemicals.

“The question you have to ask yourself is, ‘Is the status quo enough?’ ” Newman said. “We live in a world where things can be improved upon.”

Green development

From Wikipedia, the free encyclopedia https://en.wikipedia.org/w...