Search This Blog

Sunday, May 13, 2018

Molecular evolution

From Wikipedia, the free encyclopedia

Molecular evolution is the process of change in the sequence composition of cellular molecules such as DNA, RNA, and proteins across generations. The field of molecular evolution uses principles of evolutionary biology and population genetics to explain patterns in these changes. Major topics in molecular evolution concern the rates and impacts of single nucleotide changes, neutral evolution vs. natural selection, origins of new genes, the genetic nature of complex traits, the genetic basis of speciation, evolution of development, and ways that evolutionary forces influence genomic and phenotypic changes.

History

The history of molecular evolution starts in the early 20th century with comparative biochemistry, and the use of "fingerprinting" methods such as immune assays, gel electrophoresis and paper chromatography in the 1950s to explore homologous proteins.[1][2] The field of molecular evolution came into its own in the 1960s and 1970s, following the rise of molecular biology. The advent of protein sequencing allowed molecular biologists to create phylogenies based on sequence comparison, and to use the differences between homologous sequences as a molecular clock to estimate the time since the last universal common ancestor.[1] In the late 1960s, the neutral theory of molecular evolution provided a theoretical basis for the molecular clock,[3] though both the clock and the neutral theory were controversial, since most evolutionary biologists held strongly to panselectionism, with natural selection as the only important cause of evolutionary change. After the 1970s, nucleic acid sequencing allowed molecular evolution to reach beyond proteins to highly conserved ribosomal RNA sequences, the foundation of a reconceptualization of the early history of life.[1]

Forces in molecular evolution

The content and structure of a genome is the product of the molecular and population genetic forces which act upon that genome. Novel genetic variants will arise through mutation and will spread and be maintained in populations due to genetic drift or natural selection.

Mutation

This hedgehog has no pigmentation due to a mutation.

Mutations are permanent, transmissible changes to the genetic material (DNA or RNA) of a cell or virus. Mutations result from errors in DNA replication during cell division and by exposure to radiation, chemicals, and other environmental stressors, or viruses and transposable elements. Most mutations that occur are single nucleotide polymorphisms which modify single bases of the DNA sequence, resulting in point mutations. Other types of mutations modify larger segments of DNA and can cause duplications, insertions, deletions, inversions, and translocations.

Most organisms display a strong bias in the types of mutations that occur with strong influence in GC-content. Transitions (A ↔ G or C ↔ T) are more common than transversions (purine (adenine or guanine)) ↔ pyrimidine (cytosine or thymine, or in RNA, uracil))[4] and are less likely to alter amino acid sequences of proteins.

Mutations are stochastic and typically occur randomly across genes. Mutation rates for single nucleotide sites for most organisms are very low, roughly 10−9 to 10−8 per site per generation, though some viruses have higher mutation rates on the order of 10−6 per site per generation. Among these mutations, some will be neutral or beneficial and will remain in the genome unless lost via genetic drift, and others will be detrimental and will be eliminated from the genome by natural selection.

Because mutations are extremely rare, they accumulate very slowly across generations. While the number of mutations which appears in any single generation may vary, over very long time periods they will appear to accumulate at a regular pace. Using the mutation rate per generation and the number of nucleotide differences between two sequences, divergence times can be estimated effectively via the molecular clock.

Recombination
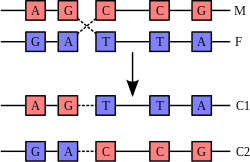
Recombination involves the breakage and rejoining of two chromosomes (M and F) to produce two re-arranged chromosomes (C1 and C2).

Recombination is a process that results in genetic exchange between chromosomes or chromosomal regions. Recombination counteracts physical linkage between adjacent genes, thereby reducing genetic hitchhiking. The resulting independent inheritance of genes results in more efficient selection, meaning that regions with higher recombination will harbor fewer detrimental mutations, more selectively favored variants, and fewer errors in replication and repair. Recombination can also generate particular types of mutations if chromosomes are misaligned.

Gene conversion

Gene conversion is a type of recombination that is the product of DNA repair where nucleotide damage is corrected using an homologous genomic region as a template. Damaged bases are first excised, the damaged strand is then aligned with an undamaged homolog, and DNA synthesis repairs the excised region using the undamaged strand as a guide. Gene conversion is often responsible for homogenizing sequences of duplicate genes over long time periods, reducing nucleotide divergence.

Genetic drift

Genetic drift is the change of allele frequencies from one generation to the next due to stochastic effects of random sampling in finite populations. Some existing variants have no effect on fitness and may increase or decrease in frequency simply due to chance. "Nearly neutral" variants whose selection coefficient is close to a threshold value of 1 / the effective population size will also be affected by chance as well as by selection and mutation. Many genomic features have been ascribed to accumulation of nearly neutral detrimental mutations as a result of small effective population sizes.[5] With a smaller effective population size, a larger variety of mutations will behave as if they are neutral due to inefficiency of selection.

Selection

Selection occurs when organisms with greater fitness, i.e. greater ability to survive or reproduce, are favored in subsequent generations, thereby increasing the instance of underlying genetic variants in a population. Selection can be the product of natural selection, artificial selection, or sexual selection.  Natural selection is any selective process that occurs due to the fitness of an organism to its environment. In contrast sexual selection is a product of mate choice and can favor the spread of genetic variants which act counter to natural selection but increase desirability to the opposite sex or increase mating success. Artificial selection, also known as selective breeding, is imposed by an outside entity, typically humans, in order to increase the frequency of desired traits.

The principles of population genetics apply similarly to all types of selection, though in fact each may produce distinct effects due to clustering of genes with different functions in different parts of the genome, or due to different properties of genes in particular functional classes. For instance, sexual selection could be more likely to affect molecular evolution of the sex chromosomes due to clustering of sex specific genes on the X, Y, Z or W.

Selection can operate at the gene level at the expense of organismal fitness, resulting in a selective advantage for selfish genetic elements in spite of a host cost. Examples of such selfish elements include transposable elements, meiotic drivers, killer X chromosomes, selfish mitochondria, and self-propagating introns. (See Intragenomic conflict.)

Genome architecture

Genome size

Genome size is influenced by the amount of repetitive DNA as well as number of genes in an organism. The C-value paradox refers to the lack of correlation between organism 'complexity' and genome size. Explanations for the so-called paradox are two-fold. First, repetitive genetic elements can comprise large portions of the genome for many organisms, thereby inflating DNA content of the haploid genome. Secondly, the number of genes is not necessarily indicative of the number of developmental stages or tissue types in an organism. An organism with few developmental stages or tissue types may have large numbers of genes that influence non-developmental phenotypes, inflating gene content relative to developmental gene families.

Neutral explanations for genome size suggest that when population sizes are small, many mutations become nearly neutral. Hence, in small populations repetitive content and other 'junk' DNA can accumulate without placing the organism at a competitive disadvantage. There is little evidence to suggest that genome size is under strong widespread selection in multicellular eukaryotes. Genome size, independent of gene content, correlates poorly with most physiological traits and many eukaryotes, including mammals, harbor very large amounts of repetitive DNA.

However, birds likely have experienced strong selection for reduced genome size, in response to changing energetic needs for flight. Birds, unlike humans, produce nucleated red blood cells, and larger nuclei lead to lower levels of oxygen transport. Bird metabolism is far higher than that of mammals, due largely to flight, and oxygen needs are high. Hence, most birds have small, compact genomes with few repetitive elements. Indirect evidence suggests that non-avian theropod dinosaur ancestors of modern birds [6] also had reduced genome sizes, consistent with endothermy and high energetic needs for running speed. Many bacteria have also experienced selection for small genome size, as time of replication and energy consumption are so tightly correlated with fitness.

Repetitive elements

Transposable elements are self-replicating, selfish genetic elements which are capable of proliferating within host genomes. Many transposable elements are related to viruses, and share several proteins in common.

Chromosome number and organization

The number of chromosomes in an organism's genome also does not necessarily correlate with the amount of DNA in its genome. The ant Myrmecia pilosula has only a single pair of chromosomes[7] whereas the Adders-tongue fern Ophioglossum reticulatum has up to 1260 chromosomes.[8] Cilliate genomes house each gene in individual chromosomes, resulting in a genome which is not physically linked. Reduced linkage through creation of additional chromosomes should effectively increase the efficiency of selection.

Changes in chromosome number can play a key role in speciation, as differing chromosome numbers can serve as a barrier to reproduction in hybrids. Human chromosome 2 was created from a fusion of two chimpanzee chromosomes and still contains central telomeres as well as a vestigial second centromere. Polyploidy, especially allopolyploidy, which occurs often in plants, can also result in reproductive incompatibilities with parental species. Agrodiatus blue butterflies have diverse chromosome numbers ranging from n=10 to n=134 and additionally have one of the highest rates of speciation identified to date.[9]

Gene content and distribution

Different organisms house different numbers of genes within their genomes as well as different patterns in the distribution of genes throughout the genome. Some organisms, such as most bacteria, Drosophila, and Arabidopsis have particularly compact genomes with little repetitive content or non-coding DNA. Other organisms, like mammals or maize, have large amounts of repetitive DNA, long introns, and substantial spacing between different genes. The content and distribution of genes within the genome can influence the rate at which certain types of mutations occur and can influence the subsequent evolution of different species. Genes with longer introns are more likely to recombine due to increased physical distance over the coding sequence. As such, long introns may facilitate ectopic recombination, and result in higher rates of new gene formation.

Organelles

In addition to the nuclear genome, endosymbiont organelles contain their own genetic material typically as circular plasmids. Mitochondrial and chloroplast DNA varies across taxa, but membrane-bound proteins, especially electron transport chain constituents are most often encoded in the organelle. Chloroplasts and mitochondria are maternally inherited in most species, as the organelles must pass through the egg. In a rare departure, some species of mussels are known to inherit mitochondria from father to son.

Origins of new genes

New genes arise from several different genetic mechanisms including gene duplication, de novo origination, retrotransposition, chimeric gene formation, recruitment of non-coding sequence, and gene truncation.

Gene duplication initially leads to redundancy. However, duplicated gene sequences can mutate to develop new functions or specialize so that the new gene performs a subset of the original ancestral functions. In addition to duplicating whole genes, sometimes only a domain or part of a protein is duplicated so that the resulting gene is an elongated version of the parental gene.

Retrotransposition creates new genes by copying mRNA to DNA and inserting it into the genome. Retrogenes often insert into new genomic locations, and often develop new expression patterns and functions.

Chimeric genes form when duplication, deletion, or incomplete retrotransposition combine portions of two different coding sequences to produce a novel gene sequence. Chimeras often cause regulatory changes and can shuffle protein domains to produce novel adaptive functions.

De novo origin. Novel genes can also arise from previously non-coding DNA.[10] For instance, Levine and colleagues reported the origin of five new genes in the D. melanogaster genome from noncoding DNA.[11][12] Similar de novo origin of genes has been also shown in other organisms such as yeast,[13] rice[14] and humans.[15] De novo genes may evolve from transcripts that are already expressed at low levels.[16] Mutation of a stop codon to a regular codon or a frameshift may cause an extended protein that includes a previously non-coding sequence.

De novo evolution of genes can also be simulated in the laboratory. Donnelly et al. have shown that semi-random gene sequences can be selected for specific functions. More specifically, they selected sequences from a library that could complement a gene deletion in E. coli. The deleted gene encodes ferric enterobactin esterase (Fes), which releases iron from an iron chelator, enterobactin. While Fes is a 400 amino acid protein, the newly selected gene was only 100 amino acids in length and unrelated in sequence to Fes.[17]

In vitro molecular evolution experiments

Principles of molecular evolution have also been discovered, and others elucidated and tested using experimentation involving amplification, variation and selection of rapidly proliferating and genetically varying molecular species outside cells. Since the pioneering work of Sol Spiegelmann in 1967 [ref], involving RNA that replicates itself with the aid of an enzyme extracted from the Qß virus [ref], several groups (such as Kramers [ref] and Biebricher/Luce/Eigen [ref]) studied mini and micro variants of this RNA in the 1970s and 1980s that replicate on the timescale of seconds to a minute, allowing hundreds of generations with large population sizes (e.g. 10^14 sequences) to be followed in a single day of experimentation. The chemical kinetic elucidation of the detailed mechanism of replication [ref, ref] meant that this type of system was the first molecular evolution system that could be fully characterised on the basis of physical chemical kinetics, later allowing the first models of the genotype to phenotype map based on sequence dependent RNA folding and refolding to be produced [ref, ref]. Subject to maintaining the function of the multicomponent Qß enzyme, chemical conditions could be varied significantly, in order to study the influence of changing environments and selection pressures [ref]. Experiments with in vitro RNA quasi species included the characterisation of the error threshold for information in molecular evolution [ref], the discovery of de novo evolution [ref] leading to diverse replicating RNA species and the discovery of spatial travelling waves as ideal molecular evolution reactors [ref, ref]. Later experiments employed novel combinations of enzymes to elucidate novel aspects of interacting molecular evolution involving population dependent fitness, including work with artificially designed molecular predator prey and cooperative systems of multiple RNA and DNA [ref, ref]. Special evolution reactors were designed for these studies, starting with serial transfer machines, flow reactors such as cell-stat machines, capillary reactors, and microreactors including line flow reactors and gel slice reactors. These studies were accompanied by theoretical developments and simulations involving RNA folding and replication kinetics that elucidated the importance of the correlation structure between distance in sequence space and fitness changes [ref], including the role of neutral networks and structural ensembles in evolutionary optimisation.

Molecular phylogenetics

Molecular systematics is the product of the traditional fields of systematics and molecular genetics. It uses DNA, RNA, or protein sequences to resolve questions in systematics, i.e. about their correct scientific classification or taxonomy from the point of view of evolutionary biology.
Molecular systematics has been made possible by the availability of techniques for DNA sequencing, which allow the determination of the exact sequence of nucleotides or bases in either DNA or RNA. At present it is still a long and expensive process to sequence the entire genome of an organism, and this has been done for only a few species. However, it is quite feasible to determine the sequence of a defined area of a particular chromosome. Typical molecular systematic analyses require the sequencing of around 1000 base pairs.

The driving forces of evolution

Depending on the relative importance assigned to the various forces of evolution, three perspectives provide evolutionary explanations for molecular evolution.[18][19]
Selectionist hypotheses argue that selection is the driving force of molecular evolution. While acknowledging that many mutations are neutral, selectionists attribute changes in the frequencies of neutral alleles to linkage disequilibrium with other loci that are under selection, rather than to random genetic drift.[20] Biases in codon usage are usually explained with reference to the ability of even weak selection to shape molecular evolution.[21]

Neutralist hypotheses emphasize the importance of mutation, purifying selection, and random genetic drift.[22] The introduction of the neutral theory by Kimura,[23] quickly followed by King and Jukes' own findings,[24] led to a fierce debate about the relevance of neodarwinism at the molecular level. The Neutral theory of molecular evolution proposes that most mutations in DNA are at locations not important to function or fitness. These neutral changes drift towards fixation within a population. Positive changes will be very rare, and so will not greatly contribute to DNA polymorphisms.[25] Deleterious mutations do not contribute much to DNA diversity because they negatively affect fitness and so are removed from the gene pool before long.[26] This theory provides a framework for the molecular clock.[25] The fate of neutral mutations are governed by genetic drift, and contribute to both nucleotide polymorphism and fixed differences between species.[27][28]

In the strictest sense, the neutral theory is not accurate.[29] Subtle changes in DNA very often have effects, but sometimes these effects are too small for natural selection to act on.[29] Even synonymous mutations are not necessarily neutral [29] because there is not a uniform amount of each codon. The nearly neutral theory expanded the neutralist perspective, suggesting that several mutations are nearly neutral, which means both random drift and natural selection is relevant to their dynamics.[29] The main difference between the neutral theory and nearly neutral theory is that the latter focuses on weak selection, not strictly neutral.[26]

Mutationists hypotheses emphasize random drift and biases in mutation patterns.[30] Sueoka was the first to propose a modern mutationist view. He proposed that the variation in GC content was not the result of positive selection, but a consequence of the GC mutational pressure.[31]

Protein evolution

This chart compares the sequence identity of different lipase
proteins throughout the human body. It demonstrates how
proteins evolve, keeping some regions conserved while others
change dramatically.

Evolution of proteins is studied by comparing the sequences and structures of proteins from many organisms representing distinct evolutionary clades. If the sequences/structures of two proteins are similar indicating that the proteins diverged from a common origin, these proteins are called as homologous proteins. More specifically, homologous proteins that exist in two distinct species are called as orthologs. Whereas, homologous proteins encoded by the genome of a single species are called paralogs.

The phylogenetic relationships of proteins are examined by multiple sequence comparisons. Phylogenetic trees of proteins can be established by the comparison of sequence identities among protoeins. Such phylogenetic trees have established that the sequence similarities among proteins reflect closely the evolutionary relationships among organisms.[32][33]

Protein evolution describes the changes over time in protein shape, function, and composition. Through quantitative analysis and experimentation, scientists have strived to understand the rate and causes of protein evolution. Using the amino acid sequences of hemoglobin and cytochrome c from multiple species, scientists were able to derive estimations of protein evolution rates. What they found was that the rates were not the same among proteins.[26] Each protein has its own rate, and that rate is constant across phylogenies (i.e., hemoglobin does not evolve at the same rate as cytochrome c, but hemoglobins from humans, mice, etc. do have comparable rates of evolution.). Not all regions within a protein mutate at the same rate; functionally important areas mutate more slowly and amino acid substitutions involving similar amino acids occurs more often than dissimilar substitutions.[26] Overall, the level of polymorphisms in proteins seems to be fairly constant. Several species (including humans, fruit flies, and mice) have similar levels of protein polymorphism.[25]

Relation to nucleic acid evolution

Protein evolution is inescapably tied to changes and selection of DNA polymorphisms and mutations because protein sequences change in response to alterations in the DNA sequence. Amino acid sequences and nucleic acid sequences do not mutate at the same rate. Due to the degenerate nature of DNA, bases can change without affecting the amino acid sequence. For example, there are six codons that code for leucine. Thus, despite the difference in mutation rates, it is essential to incorporate nucleic acid evolution into the discussion of protein evolution. At the end of the 1960s, two groups of scientists—Kimura (1968) and King and Jukes (1969)—independently proposed that a majority of the evolutionary changes observed in proteins were neutral.[25][26] Since then, the neutral theory has been expanded upon and debated.[26]

Discordance with morphological evolution

There are sometimes discordances between molecular and morphological evolution, which are reflected in molecular and morphological systematic studies, especially of bacteria, archaea and eukaryotic microbes. These discordances can be categorized as two types: (i) one morphology, multiple lineages (e.g. morphological convergence, cryptic species) and (ii) one lineage, multiple morphologies (e.g. phenotypic plasticity, multiple life-cycle stages). Neutral evolution possibly could explain the incongruences in some cases.[34]

Journals and societies

The Society for Molecular Biology and Evolution publishes the journals "Molecular Biology and Evolution" and "Genome Biology and Evolution" and holds an annual international meeting. Other journals dedicated to molecular evolution include Journal of Molecular Evolution and Molecular Phylogenetics and Evolution. Research in molecular evolution is also published in journals of genetics, molecular biology, genomics, systematics, and evolutionary biology.

Scanning electron microscope

From Wikipedia, the free encyclopedia
Photo of pollen grains taken on an SEM shows the characteristic depth of field of SEM micrographs
 
M. von Ardenne's first SEM
 
Operating principle of a Scanning Electron Microscope (SEM)
 
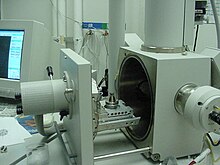
SEM opened sample chamber
 
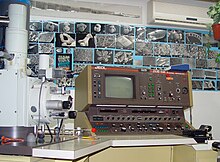
Analog type SEM
 
A scanning electron microscope (SEM) is a type of electron microscope that produces images of a sample by scanning the surface with a focused beam of electrons. The electrons interact with atoms in the sample, producing various signals that contain information about the sample's surface topography and composition. The electron beam is scanned in a raster scan pattern, and the beam's position is combined with the detected signal to produce an image. SEM can achieve resolution better than 1 nanometer. Specimens can be observed in high vacuum in conventional SEM, or in low vacuum or wet conditions in variable pressure or environmental SEM, and at a wide range of cryogenic or elevated temperatures with specialized instruments.[1]

The most common SEM mode is detection of secondary electrons emitted by atoms excited by the electron beam. The number of secondary electrons that can be detected depends, among other things, on specimen topography. By scanning the sample and collecting the secondary electrons that are emitted using a special detector, an image displaying the topography of the surface is created.

History

An account of the early history of SEM has been presented by McMullan.[2][3] Although Max Knoll produced a photo with a 50 mm object-field-width showing channeling contrast by the use of an electron beam scanner,[4] it was Manfred von Ardenne who in 1937 invented[5] a true microscope with high magnification by scanning a very small raster with a demagnified and finely focused electron beam. Ardenne applied the scanning principle not only to achieve magnification but also to purposefully eliminate the chromatic aberration otherwise inherent in the electron microscope. He further discussed the various detection modes, possibilities and theory of SEM,[6] together with the construction of the first high magnification SEM.[7] Further work was reported by Zworykin's group,[8] followed by the Cambridge groups in the 1950s and early 1960s[9][10][11][12] headed by Charles Oatley, all of which finally led to the marketing of the first commercial instrument by Cambridge Scientific Instrument Company as the "Stereoscan" in 1965, which was delivered to DuPont.

Principles and capacities

The signals used by a scanning electron microscope to produce an image result from interactions of the electron beam with atoms at various depths within the sample. Various types of signals are produced including secondary electrons (SE), reflected or back-scattered electrons (BSE), characteristic X-rays and light (cathodoluminescence) (CL), absorbed current (specimen current) and transmitted electrons. Secondary electron detectors are standard equipment in all SEMs, but it is rare that a single machine would have detectors for all other possible signals.

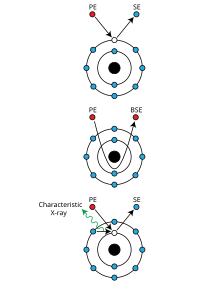
In secondary electron imaging, or SEI, the secondary electrons are emitted from very close to the specimen surface. Consequently, SEM can produce very high-resolution images of a sample surface, revealing details less than 1 nm in size. Back-scattered electrons (BSE) are beam electrons that are reflected from the sample by elastic scattering. They emerge from deeper locations within the specimen and consequently the resolution of BSE images is less than SE images. However, BSE are often used in analytical SEM along with the spectra made from the characteristic X-rays, because the intensity of the BSE signal is strongly related to the atomic number (Z) of the specimen. BSE images can provide information about the distribution of different elements in the sample. For the same reason, BSE imaging can image colloidal gold immuno-labels of 5 or 10 nm diameter, which would otherwise be difficult or impossible to detect in secondary electron images in biological specimens.[13] Characteristic X-rays are emitted when the electron beam removes an inner shell electron from the sample, causing a higher-energy electron to fill the shell and release energy. These characteristic X-rays are used to identify the composition and measure the abundance of elements in the sample.

Due to the very narrow electron beam, SEM micrographs have a large depth of field yielding a characteristic three-dimensional appearance useful for understanding the surface structure of a sample.[14] This is exemplified by the micrograph of pollen shown above. A wide range of magnifications is possible, from about 10 times (about equivalent to that of a powerful hand-lens) to more than 500,000 times, about 250 times the magnification limit of the best light microscopes.

Sample preparation

A spider sputter-coated in gold, having been prepared for viewing with an SEM
 
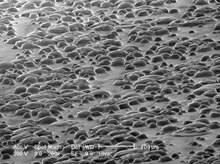
Low-voltage micrograph (300 V) of distribution of adhesive droplets on a Post-it note. No conductive coating was applied: such a coating would alter this fragile specimen.

Samples for SEM have to be prepared to withstand the vacuum conditions and high energy beam of electrons, and have to be of a size that will fit on the specimen stage. Samples are generally mounted rigidly to a specimen holder or stub using a conductive adhesive. SEM is used extensively for defect analysis of semiconductor wafers, and manufacturers make instruments that can examine any part of a 300 mm semiconductor wafer. Many instruments have chambers that can tilt an object of that size to 45° and provide continuous 360° rotation.[citation needed]

Nonconductive specimens collect charge when scanned by the electron beam, and especially in secondary electron imaging mode, this causes scanning faults and other image artifacts. For conventional imaging in the SEM, specimens must be electrically conductive, at least at the surface, and electrically grounded to prevent the accumulation of electrostatic charge. Metal objects require little special preparation for SEM except for cleaning and conductively mounting to a specimen stub. Non-conducting materials are usually coated with an ultrathin coating of electrically conducting material, deposited on the sample either by low-vacuum sputter coating or by high-vacuum evaporation. Conductive materials in current use for specimen coating include gold, gold/palladium alloy, platinum, iridium, tungsten, chromium, osmium,[13] and graphite. Coating with heavy metals may increase signal/noise ratio for samples of low atomic number (Z). The improvement arises because secondary electron emission for high-Z materials is enhanced.

An alternative to coating for some biological samples is to increase the bulk conductivity of the material by impregnation with osmium using variants of the OTO staining method (O-osmium tetroxide, T-thiocarbohydrazide, O-osmium).[15][16]

Nonconducting specimens may be imaged without coating using an environmental SEM (ESEM) or low-voltage mode of SEM operation.[17] In ESEM instruments the specimen is placed in a relatively high-pressure chamber and the electron optical column is differentially pumped to keep vacuum adequately low at the electron gun. The high-pressure region around the sample in the ESEM neutralizes charge and provides an amplification of the secondary electron signal.[citation needed] Low-voltage SEM is typically conducted in an FEG-SEM because field emission guns (FEG) are capable of producing high primary electron brightness and small spot size even at low accelerating potentials. To prevent charging of non-conductive specimens, operating conditions must be adjusted such that the incoming beam current is equal to sum of outcoming secondary and backscattered electrons currents a condition that is more often met at accelerating voltages of 0.3–4 kV.[citation needed]

Synthetic replicas can be made to avoid the use of original samples when they are not suitable or available for SEM examination due to methodological obstacles or legal issues. This technique is achieved in two steps: (1) a mold of the original surface is made using a silicone-based dental elastomer, and (2) a replica of the original surface is obtained by pouring a synthetic resin into the mold.[18]

Embedding in a resin with further polishing to a mirror-like finish can be used for both biological and materials specimens when imaging in backscattered electrons or when doing quantitative X-ray microanalysis.

The main preparation techniques are not required in the environmental SEM outlined below, but some biological specimens can benefit from fixation.

Biological samples

For SEM, a specimen is normally required to be completely dry, since the specimen chamber is at high vacuum. Hard, dry materials such as wood, bone, feathers, dried insects, or shells (including egg shells[19][not in citation given]) can be examined with little further treatment,[citation needed] but living cells and tissues and whole, soft-bodied organisms require chemical fixation to preserve and stabilize their structure.

Fixation is usually performed by incubation in a solution of a buffered chemical fixative, such as glutaraldehyde, sometimes in combination with formaldehyde[20][21][22] and other fixatives,[23] and optionally followed by postfixation with osmium tetroxide.[20] The fixed tissue is then dehydrated. Because air-drying causes collapse and shrinkage, this is commonly achieved by replacement of water in the cells with organic solvents such as ethanol or acetone, and replacement of these solvents in turn with a transitional fluid such as liquid carbon dioxide by critical point drying.[24] The carbon dioxide is finally removed while in a supercritical state, so that no gas–liquid interface is present within the sample during drying.

The dry specimen is usually mounted on a specimen stub using an adhesive such as epoxy resin or electrically conductive double-sided adhesive tape, and sputter-coated with gold or gold/palladium alloy before examination in the microscope. Samples may be sectioned (with a microtome) if information about the organism's internal ultrastructure is to be exposed for imaging.

If the SEM is equipped with a cold stage for cryo microscopy, cryofixation may be used and low-temperature scanning electron microscopy performed on the cryogenically fixed specimens.[20] Cryo-fixed specimens may be cryo-fractured under vacuum in a special apparatus to reveal internal structure, sputter-coated and transferred onto the SEM cryo-stage while still frozen.[25] Low-temperature scanning electron microscopy (LT-SEM) is also applicable to the imaging of temperature-sensitive materials such as ice[26][27] and fats.[28]

Freeze-fracturing, freeze-etch or freeze-and-break is a preparation method particularly useful for examining lipid membranes and their incorporated proteins in "face on" view. The preparation method reveals the proteins embedded in the lipid bilayer.

Materials

Back-scattered electron imaging, quantitative X-ray analysis, and X-ray mapping of specimens often requires grinding and polishing the surfaces to an ultra smooth surface. Specimens that undergo WDS or EDS analysis are often carbon-coated. In general, metals are not coated prior to imaging in the SEM because they are conductive and provide their own pathway to ground.

Fractography is the study of fractured surfaces that can be done on a light microscope or, commonly, on an SEM. The fractured surface is cut to a suitable size, cleaned of any organic residues, and mounted on a specimen holder for viewing in the SEM.

Integrated circuits may be cut with a focused ion beam (FIB) or other ion beam milling instrument for viewing in the SEM. The SEM in the first case may be incorporated into the FIB.[clarification needed]

Metals, geological specimens, and integrated circuits all may also be chemically polished for viewing in the SEM.

Special high-resolution coating techniques are required for high-magnification imaging of inorganic thin films.

Scanning process and image formation

Schematic of an SEM

In a typical SEM, an electron beam is thermionically emitted from an electron gun fitted with a tungsten filament cathode. Tungsten is normally used in thermionic electron guns because it has the highest melting point and lowest vapor pressure of all metals, thereby allowing it to be electrically heated for electron emission, and because of its low cost. Other types of electron emitters include lanthanum hexaboride (LaB
6
) cathodes, which can be used in a standard tungsten filament SEM if the vacuum system is upgraded or field emission guns (FEG), which may be of the cold-cathode type using tungsten single crystal emitters or the thermally assisted Schottky type, that use emitters of zirconium oxide.

The electron beam, which typically has an energy ranging from 0.2 keV to 40 keV, is focused by one or two condenser lenses to a spot about 0.4 nm to 5 nm in diameter. The beam passes through pairs of scanning coils or pairs of deflector plates in the electron column, typically in the final lens, which deflect the beam in the x and y axes so that it scans in a raster fashion over a rectangular area of the sample surface.

Signals emitted from different parts of the interaction volume
 
Mechanisms of emission of secondary electrons, backscattered electrons, and characteristic X-rays from atoms of the sample

When the primary electron beam interacts with the sample, the electrons lose energy by repeated random scattering and absorption within a teardrop-shaped volume of the specimen known as the interaction volume, which extends from less than 100 nm to approximately 5 µm into the surface. The size of the interaction volume depends on the electron's landing energy, the atomic number of the specimen and the specimen's density. The energy exchange between the electron beam and the sample results in the reflection of high-energy electrons by elastic scattering, emission of secondary electrons by inelastic scattering and the emission of electromagnetic radiation, each of which can be detected by specialized detectors. The beam current absorbed by the specimen can also be detected and used to create images of the distribution of specimen current. Electronic amplifiers of various types are used to amplify the signals, which are displayed as variations in brightness on a computer monitor (or, for vintage models, on a cathode ray tube). Each pixel of computer video memory is synchronized with the position of the beam on the specimen in the microscope, and the resulting image is therefore a distribution map of the intensity of the signal being emitted from the scanned area of the specimen. In older microscopes images may be captured by photography from a high-resolution cathode ray tube, but in modern machines they are digitised and saved as digital images.

Low-temperature SEM magnification series for a snow crystal. The crystals are captured, stored, and sputter-coated with platinum at cryogenic temperatures for imaging.

Magnification

Magnification in a SEM can be controlled over a range of about 6 orders of magnitude from about 10 to 500,000 times. Unlike optical and transmission electron microscopes, image magnification in an SEM is not a function of the power of the objective lens. SEMs may have condenser and objective lenses, but their function is to focus the beam to a spot, and not to image the specimen. Provided the electron gun can generate a beam with sufficiently small diameter, an SEM could in principle work entirely without condenser or objective lenses, although it might not be very versatile or achieve very high resolution. In an SEM, as in scanning probe microscopy, magnification results from the ratio of the dimensions of the raster on the specimen and the raster on the display device. Assuming that the display screen has a fixed size, higher magnification results from reducing the size of the raster on the specimen, and vice versa. Magnification is therefore controlled by the current supplied to the x, y scanning coils, or the voltage supplied to the x, y deflector plates, and not by objective lens power.

Detection of secondary electrons

The most common imaging mode collects low-energy (<50 a="" are="" atoms="" beam="" by="" class="mw-redirect" due="" ejected="" electrons.="" electrons="" energy="" ev="" few="" from="" href="https://en.wikipedia.org/wiki/Nanometer" inelastic="" interactions="" k-shell="" low="" of="" originate="" scattering="" secondary="" specimen="" that="" the="" their="" these="" title="Nanometer" to="" with="" within="">nanometers
from the sample surface.[14] The electrons are detected by an Everhart-Thornley detector,[29] which is a type of scintillator-photomultiplier system. The secondary electrons are first collected by attracting them towards an electrically biased grid at about +400 V, and then further accelerated towards a phosphor or scintillator positively biased to about +2,000 V. The accelerated secondary electrons are now sufficiently energetic to cause the scintillator to emit flashes of light (cathodoluminescence), which are conducted to a photomultiplier outside the SEM column via a light pipe and a window in the wall of the specimen chamber. The amplified electrical signal output by the photomultiplier is displayed as a two-dimensional intensity distribution that can be viewed and photographed on an analogue video display, or subjected to analog-to-digital conversion and displayed and saved as a digital image. This process relies on a raster-scanned primary beam. The brightness of the signal depends on the number of secondary electrons reaching the detector. If the beam enters the sample perpendicular to the surface, then the activated region is uniform about the axis of the beam and a certain number of electrons "escape" from within the sample. As the angle of incidence increases, the interaction volume increases and the "escape" distance of one side of the beam decreases, resulting in more secondary electrons being emitted from the sample. Thus steep surfaces and edges tend to be brighter than flat surfaces, which results in images with a well-defined, three-dimensional appearance. Using the signal of secondary electrons image resolution less than 0.5 nm is possible.

Detection of backscattered electrons

Comparison of SEM techniques:
Top: backscattered electron analysis – composition
Bottom: secondary electron analysis – topography

Backscattered electrons (BSE) consist of high-energy electrons originating in the electron beam, that are reflected or back-scattered out of the specimen interaction volume by elastic scattering interactions with specimen atoms. Since heavy elements (high atomic number) backscatter electrons more strongly than light elements (low atomic number), and thus appear brighter in the image, BSE are used to detect contrast between areas with different chemical compositions.[14] The Everhart-Thornley detector, which is normally positioned to one side of the specimen, is inefficient for the detection of backscattered electrons because few such electrons are emitted in the solid angle subtended by the detector, and because the positively biased detection grid has little ability to attract the higher energy BSE. Dedicated backscattered electron detectors are positioned above the sample in a "doughnut" type arrangement, concentric with the electron beam, maximizing the solid angle of collection. BSE detectors are usually either of scintillator or of semiconductor types. When all parts of the detector are used to collect electrons symmetrically about the beam, atomic number contrast is produced. However, strong topographic contrast is produced by collecting back-scattered electrons from one side above the specimen using an asymmetrical, directional BSE detector; the resulting contrast appears as illumination of the topography from that side. Semiconductor detectors can be made in radial segments that can be switched in or out to control the type of contrast produced and its directionality.

Backscattered electrons can also be used to form an electron backscatter diffraction (EBSD) image that can be used to determine the crystallographic structure of the specimen.

Beam-injection analysis of semiconductors

The nature of the SEM's probe, energetic electrons, makes it uniquely suited to examining the optical and electronic properties of semiconductor materials. The high-energy electrons from the SEM beam will inject charge carriers into the semiconductor. Thus, beam electrons lose energy by promoting electrons from the valence band into the conduction band, leaving behind holes.

In a direct bandgap material, recombination of these electron-hole pairs will result in cathodoluminescence; if the sample contains an internal electric field, such as is present at a p-n junction, the SEM beam injection of carriers will cause electron beam induced current (EBIC) to flow. Cathodoluminescence and EBIC are referred to as "beam-injection" techniques, and are very powerful probes of the optoelectronic behavior of semiconductors, in particular for studying nanoscale features and defects.

Cathodoluminescence

Color cathodoluminescence overlay on SEM image of an InGaN polycrystal. The blue and green channels represent real colors, the red channel corresponds to UV emission.

Cathodoluminescence, the emission of light when atoms excited by high-energy electrons return to their ground state, is analogous to UV-induced fluorescence, and some materials such as zinc sulfide and some fluorescent dyes, exhibit both phenomena. Over the last decades, cathodoluminescence was most commonly experienced as the light emission from the inner surface of the cathode ray tube in television sets and computer CRT monitors. In the SEM, CL detectors either collect all light emitted by the specimen or can analyse the wavelengths emitted by the specimen and display an emission spectrum or an image of the distribution of cathodoluminescence emitted by the specimen in real color.

X-ray microanalysis

Characteristic X-rays that are produced by the interaction of electrons with the sample may also be detected in an SEM equipped for energy-dispersive X-ray spectroscopy or wavelength dispersive X-ray spectroscopy. Analysis of the x-ray signals may be used to map the distribution and estimate the abundance of elements in the sample.

Resolution of the SEM

A video illustrating a typical practical magnification range of a scanning electron microscope designed for biological specimens. The video starts at 25x, about 6 mm across the whole field of view, and zooms in to 12000×, about 12 μm across the whole field of view. The spherical objects are glass beads with a diameter of 10 μm, similar in diameter to a red blood cell.

SEM is not a camera and the detector is not continuously image-forming like a CCD array or film. Unlike in an optical system, the resolution is not limited by the diffraction limit, fineness of lenses or mirrors or detector array resolution. The focusing optics can be large and coarse, and the SE detector is fist-sized and simply detects current. Instead, the spatial resolution of the SEM depends on the size of the electron spot, which in turn depends on both the wavelength of the electrons and the electron-optical system that produces the scanning beam. The resolution is also limited by the size of the interaction volume, the volume of specimen material that interacts with the electron beam. The spot size and the interaction volume are both large compared to the distances between atoms, so the resolution of the SEM is not high enough to image individual atoms, as is possible with transmission electron microscope (TEM). The SEM has compensating advantages, though, including the ability to image a comparatively large area of the specimen; the ability to image bulk materials (not just thin films or foils); and the variety of analytical modes available for measuring the composition and properties of the specimen. Depending on the instrument, the resolution can fall somewhere between less than 1 nm and 20 nm. As of 2009, The world's highest resolution conventional (≤30 kV) SEM can reach a point resolution of 0.4 nm using a secondary electron detector.[30]

Environmental SEM

Conventional SEM requires samples to be imaged under vacuum, because a gas atmosphere rapidly spreads and attenuates electron beams. As a consequence, samples that produce a significant amount of vapour, e.g. wet biological samples or oil-bearing rock, must be either dried or cryogenically frozen. Processes involving phase transitions, such as the drying of adhesives or melting of alloys, liquid transport, chemical reactions, and solid-air-gas systems, in general cannot be observed. Some observations of living insects have been possible however.[31]
The first commercial development of the ESEM in the late 1980s[32][33] allowed samples to be observed in low-pressure gaseous environments (e.g. 1–50 Torr or 0.1–6.7 kPa) and high relative humidity (up to 100%). This was made possible by the development of a secondary-electron detector[34][35] capable of operating in the presence of water vapour and by the use of pressure-limiting apertures with differential pumping in the path of the electron beam to separate the vacuum region (around the gun and lenses) from the sample chamber.

The first commercial ESEMs were produced by the ElectroScan Corporation in USA in 1988. ElectroScan was taken over by Philips (who later sold their electron-optics division to FEI Company) in 1996.[36]

ESEM is especially useful for non-metallic and biological materials because coating with carbon or gold is unnecessary. Uncoated Plastics and Elastomers can be routinely examined, as can uncoated biological samples. Coating can be difficult to reverse, may conceal small features on the surface of the sample and may reduce the value of the results obtained. X-ray analysis is difficult with a coating of a heavy metal, so carbon coatings are routinely used in conventional SEMs, but ESEM makes it possible to perform X-ray microanalysis on uncoated non-conductive specimens; however some specific for ESEM artifacts are introduced in X-ray analysis. ESEM may be the preferred for electron microscopy of unique samples from criminal or civil actions, where forensic analysis may need to be repeated by several different experts.

It is possible to study specimens in liquid with ESEM or with other liquid-phase electron microscopy methods.[37]

Transmission SEM

The SEM can also be used in transmission mode by simply incorporating an appropriate detector below a thin specimen section.[38] Both bright and dark field imaging has been reported in the generally low accelerating beam voltage range used in SEM, which increases the contrast of unstained biological specimens at high magnifications with a field emission electron gun. This mode of operation has been abbreviated by the acronym tSEM.

Color in SEM

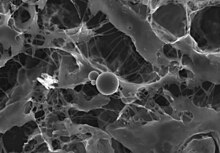
Electron microscopes do not naturally produce color images, as an SEM produces a single value per pixel; this value corresponds to the number of electrons received by the detector during a small period of time of the scanning when the beam is targeted to the (x, y) pixel position.

This single number is usually represented, for each pixel, by a grey level, forming a "black-and-white" image.[39] However, several ways have been used to get color electron microscopy images.[40]

False color using a single detector

  • On compositional images of flat surfaces (typically BSE):
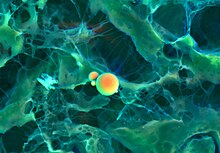
The easiest way to get color is to associate to this single number an arbitrary color, using a color look-up table (i.e. each grey level is replaced by a chosen color). This method is known as false color. On a BSE image, false color may be performed to better distinguish the various phases of the sample.
  • On textured-surface images:
As an alternative to simply replacing each grey level by a color, a sample observed by an oblique beam allows researchers to create an approximative topography image. Such topography can then be processed by 3D-rendering algorithms for a more natural rendering of the surface texture

SEM image coloring

Very often, published SEM images are artificially colored. This may be done for aesthetic effect, to clarify structure or to add a realistic appearance to the sample[41] and generally does not add information about the specimen.[42]

Coloring may be performed manually with photo-editing software, or semi-automatically with dedicated software using feature-detection or object-oriented segmentation.[43]

Color built using multiple electron detectors

In some configurations more information is gathered per pixel, often by the use of multiple detectors.[44]

As a common example, secondary electron and backscattered electron detectors are superimposed and a color is assigned to each of the images captured by each detector,[45][46] with an end result of a combined color image where colors are related to the density of the components. This method is known as density-dependent color SEM (DDC-SEM). Micrographs produced by DDC-SEM retain topographical information, which is better captured by the secondary electrons detector and combine it to the information about density, obtained by the backscattered electron detector.[47][48]

Analytical signals based on generated photons

Measurement of the energy of photons emitted from the specimen is a common method to get analytical capabilities. Examples are the energy-dispersive X-ray spectroscopy (EDS) detectors used in elemental analysis and cathodoluminescence microscope (CL) systems that analyse the intensity and spectrum of electron-induced luminescence in (for example) geological specimens. In SEM systems using these detectors it is common to color code these extra signals and superimpose them in a single color image, so that differences in the distribution of the various components of the specimen can be seen clearly and compared. Optionally, the standard secondary electron image can be merged with the one or more compositional channels, so that the specimen's structure and composition can be compared. Such images can be made while maintaining the full integrity of the original signal data, which is not modified in any way.

3D in SEM

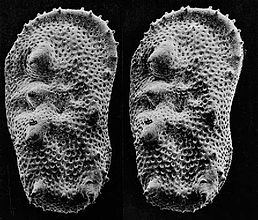
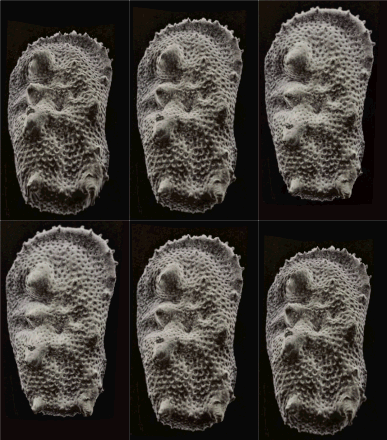
SEMs do not naturally provide 3D images contrary to SPMs. However 3D data can be obtained using an SEM with different methods as follows.

3D SEM reconstruction from a stereo pair

  • photogrammetry (two and three dimensional images from tilted specimen)

Photometric 3D SEM reconstruction from a four-quadrant detector "shape from shading"

This method typically uses a four-quadrant BSE detector. The microscope produces four images of the same specimen at the same time, so no tilt is required. The method gives metrological 3D dimensions as far as the slope of the specimen remains reasonable.

Some scanning electron microscopes are provided with software which uses a vendor-specific and usually closed-source algorithm to determine the 3D profile of the sample from the four-quadrant BSE detector. The supplied algorithms can be very simple line-by-line approaches, that only compare pixels next to each other. Due to the sample and conditions changing, this produces reasonable results only along the scan direction and is only practical for 1D line cuts along the scanning axis. Other approaches use more sophisticated (and sometimes GPU-intensive) methods like the optimal estimation algorithm and offer much better results at the cost of high demands on computing power.

As this approach works by integration of the slope, vertical slopes and overhangs are ignored; for instance, if an entire sphere lies on a flat, little more than the upper hemisphere is seen emerging above the flat, resulting in wrong altitude of the sphere apex. The prominence of this effect depends on the angle of the BSE detectors with respect to the sample, but these detectors are usually situated around (and close to) the electron beam, so this effect is very common.

Photometric 3D rendering from a single SEM image

This method requires an SEM image obtained in oblique low angle lighting. The grey-level is then interpreted as the slope, and the slope integrated to restore the specimen topography. This method is interesting for visual enhancement and the detection of the shape and position of objects ; however the vertical heights cannot usually be calibrated, contrary to other methods such as photogrammetry.

Other types of 3D SEM reconstruction

  • inverse reconstruction using electron-material interactive models
  • vertical stacks of SEM micrographs plus image-processing software
  • Multi-Resolution reconstruction using single 2D File: High-quality 3D imaging may be an ultimate solution for revealing the complexities of any porous media, but acquiring them is costly and time consuming. High-quality 2D SEM images, on the other hand, are widely available. Recently, a novel three-step, multiscale, multiresolution reconstruction method is presented that directly uses 2D images in order to develop 3D models. This method, based on a Shannon Entropy and conditional simulation, can be used for most of the available stationary materials and can build various stochastic 3D models just using a few thin sections.

Applications of 3D SEM

One possible application is measuring the roughness of ice crystals. This method can combine variable-pressure environmental SEM and the 3D capabilities of the SEM to measure roughness on individual ice crystal facets, convert it into a computer model and run further statistical analysis on the model. Other measurements include fractal dimension, examining fracture surface of metals, characterization of materials, corrosion measurement, and dimensional measurements at the nano scale (step height, volume, angle, flatness, bearing ratio, coplanarity, etc.).

Computer-aided software engineering

From Wikipedia, the free encyclopedia ...