
Pumpjack pumping an oil well near Lubbock, Texas.

It consists of hydrocarbons of various molecular weights and other organic compounds. The name petroleum covers both naturally occurring unprocessed crude oil and petroleum products that are made up of refined crude oil. A fossil fuel, petroleum is formed when large quantities of dead organisms, mostly zooplankton and algae, are buried underneath sedimentary rock and subjected to both intense heat and pressure.
Petroleum has mostly been recovered by oil drilling (natural petroleum springs are rare). Drilling is carried out after studies of structural geology (at the reservoir scale), sedimentary basin analysis, and reservoir characterisation (mainly in terms of the porosity and permeability of geologic reservoir structures) have been completed. It is refined and separated, most easily by distillation, into a large number of consumer products, from gasoline (petrol) and kerosene to asphalt and chemical reagents used to make plastics, pesticides and pharmaceuticals. Petroleum is used in manufacturing a wide variety of materials, and it is estimated that the world consumes about 95 million barrels each day.
Etymology

Fractional distillation apparatus.
The word petroleum comes from Medieval Latin petroleum (literally "rock oil"), which comes from Latin petra', "rock", (from Ancient Greek: πέτρα, translit. petra, "rock") and Latin oleum, "oil".
The term was used in the treatise De Natura Fossilium, published in 1546 by the German mineralogist Georg Bauer, also known as Georgius Agricola. In the 19th century, the term petroleum was often used to refer to mineral oils produced by distillation from mined organic solids such as cannel coal (and later oil shale),
and refined oils produced from them; in the United Kingdom, storage
(and later transport) of these oils were regulated by a series of
Petroleum Acts, from the Petroleum Act 1863 onwards.
History
Early history

Oil derrick in Okemah, Oklahoma, 1922.
Petroleum, in one form or another, has been used since ancient times,
and is now important across society, including in economy, politics and
technology. The rise in importance was due to the invention of the internal combustion engine, the rise in commercial aviation,
and the importance of petroleum to industrial organic chemistry,
particularly the synthesis of plastics, fertilizers, solvents, adhesives
and pesticides.
More than 4000 years ago, according to Herodotus and Diodorus Siculus, asphalt was used in the construction of the walls and towers of Babylon; there were oil pits near Ardericca (near Babylon), and a pitch spring on Zacynthus. Great quantities of it were found on the banks of the river Issus, one of the tributaries of the Euphrates. Ancient Persian tablets indicate the medicinal and lighting uses of petroleum in the upper levels of their society.
The use of petroleum in ancient China dates back to more than 2000 years ago. In I Ching,
one of the earliest Chinese writings cites that oil in its raw state,
without refining, was first discovered, extracted, and used in China in
the first century BCE. In addition, the Chinese were the first to use
petroleum as fuel as early as the fourth century BCE.
By 347 AD, oil was produced from bamboo-drilled wells in China. Early British explorers to Myanmar documented a flourishing oil extraction industry based in Yenangyaung that, in 1795, had hundreds of hand-dug wells under production.
Pechelbronn
(Pitch fountain) is said to be the first European site where petroleum
has been explored and used. The still active Erdpechquelle, a spring
where petroleum appears mixed with water has been used since 1498,
notably for medical purposes. Oil sands have been mined since the 18th
century.
In Wietze in lower Saxony, natural asphalt/bitumen has been explored since the 18th century. Both in Pechelbronn as in Wietze, the coal industry dominated the petroleum technologies.
Modern history

Proven world oil reserves, 2013. Unconventional reservoirs such as natural heavy oil and oil sands are included.
Chemist James Young noticed a natural petroleum seepage in the Riddings colliery at Alfreton, Derbyshire
from which he distilled a light thin oil suitable for use as lamp oil,
at the same time obtaining a more viscous oil suitable for lubricating
machinery. In 1848 Young set up a small business refining the crude oil.
Young eventually succeeded, by distilling cannel coal
at a low heat, in creating a fluid resembling petroleum, which when
treated in the same way as the seep oil gave similar products. Young
found that by slow distillation he could obtain a number of useful
liquids from it, one of which he named "paraffine oil" because at low
temperatures it congealed into a substance resembling paraffin wax.
The production of these oils and solid paraffin wax
from coal formed the subject of his patent dated 17 October 1850. In
1850 Young & Meldrum and Edward William Binney entered into
partnership under the title of E.W. Binney & Co. at Bathgate in West Lothian
and E. Meldrum & Co. at Glasgow; their works at Bathgate were
completed in 1851 and became the first truly commercial oil-works in the
world with the first modern oil refinery.

Shale bings near Broxburn, 3 of a total of 19 in West Lothian.
The world's first oil refinery was built in 1856 by Ignacy Łukasiewicz.
His achievements also included the discovery of how to distill kerosene
from seep oil, the invention of the modern kerosene lamp (1853), the
introduction of the first modern street lamp in Europe (1853), and the
construction of the world's first modern oil well (1854).
The demand for petroleum as a fuel for lighting in North America and around the world quickly grew. Edwin Drake's 1859 well
near Titusville, Pennsylvania, is popularly considered the first modern
well. Already 1858 Georg Christian Konrad Hunäus had found a
significant amount of petroleum while drilling for lignite 1858 in Wietze, Germany. Wietze later provided about 80% of the German consumption in the Wilhelminian Era. The production stopped in 1963, but Wietze has hosted a Petroleum Museum since 1970.
Drake's well is probably singled out because it was drilled, not
dug; because it used a steam engine; because there was a company
associated with it; and because it touched off a major boom.
However, there was considerable activity before Drake in various parts
of the world in the mid-19th century. A group directed by Major Alexeyev
of the Bakinskii Corps of Mining Engineers hand-drilled a well in the
Baku region in 1848. There were engine-drilled wells in West Virginia in the same year as Drake's well. An early commercial well was hand dug in Poland in 1853, and another in nearby Romania in 1857. At around the same time the world's first, small, oil refinery was opened at Jasło in Poland, with a larger one opened at Ploiești
in Romania shortly after. Romania is the first country in the world to
have had its annual crude oil output officially recorded in
international statistics: 275 tonnes for 1857.
The first commercial oil well in Canada became operational in 1858 at Oil Springs, Ontario (then Canada West). Businessman James Miller Williams dug several wells between 1855 and 1858 before discovering a rich reserve of oil four metres below ground.
Williams extracted 1.5 million litres of crude oil by 1860, refining
much of it into kerosene lamp oil. Williams's well became commercially
viable a year before Drake's Pennsylvania operation and could be argued
to be the first commercial oil well in North America. The discovery at Oil Springs touched off an oil boom
which brought hundreds of speculators and workers to the area. Advances
in drilling continued into 1862 when local driller Shaw reached a depth
of 62 metres using the spring-pole drilling method. On January 16, 1862, after an explosion of natural gas Canada's first oil gusher came into production, shooting into the air at a recorded rate of 3,000 barrels per day. By the end of the 19th century the Russian Empire, particularly the Branobel company in Azerbaijan, had taken the lead in production.

A poster used to promote carpooling as a way to ration gasoline during World War II.
Access to oil was and still is a major factor in several military conflicts of the twentieth century, including World War II, during which oil facilities were a major strategic asset and were extensively bombed. The German invasion of the Soviet Union included the goal to capture the Baku oilfields, as it would provide much needed oil-supplies for the German military which was suffering from blockades.
Oil exploration in North America during the early 20th century later
led to the US becoming the leading producer by mid-century. As petroleum
production in the US peaked during the 1960s, however, the United
States was surpassed by Saudi Arabia and the Soviet Union.
Today, about 90 percent of vehicular fuel needs are met by oil.
Petroleum also makes up 40 percent of total energy consumption in the
United States, but is responsible for only 1 percent of electricity
generation.
Petroleum's worth as a portable, dense energy source powering the vast
majority of vehicles and as the base of many industrial chemicals makes
it one of the world's most important commodities.
Viability of the oil commodity is controlled by several key parameters,
number of vehicles in the world competing for fuel, quantity of oil
exported to the world market,
net energy gain (economically useful energy provided minus energy
consumed), political stability of oil exporting nations and ability to
defend oil supply lines.
The top three oil producing countries are Russia, Saudi Arabia and the United States. In 2018, due in part to developments in hydraulic fracturing and horizonal drilling, the United States became the world's largest producer.
About 80 percent of the world's readily accessible reserves are located
in the Middle East, with 62.5 percent coming from the Arab 5: Saudi Arabia, United Arab Emirates, Iraq, Qatar and Kuwait. A large portion of the world's total oil exists as unconventional sources, such as bitumen in Athabasca oil sands and extra heavy oil in the Orinoco Belt.
While significant volumes of oil are extracted from oil sands,
particularly in Canada, logistical and technical hurdles remain, as oil
extraction requires large amounts of heat and water, making its net
energy content quite low relative to conventional crude oil. Thus,
Canada's oil sands are not expected to provide more than a few million
barrels per day in the foreseeable future.
Composition
In its strictest sense, petroleum includes only crude oil, but in common usage it includes all liquid, gaseous and solid hydrocarbons. Under surface pressure and temperature conditions, lighter hydrocarbons methane, ethane, propane and butane exist as gases, while pentane and heavier hydrocarbons are in the form of liquids or solids. However, in an underground oil reservoir the proportions of gas, liquid, and solid depend on subsurface conditions and on the phase diagram of the petroleum mixture.
An oil well produces predominantly crude oil, with some natural gas dissolved in it. Because the pressure is lower at the surface than underground, some of the gas will come out of solution and be recovered (or burned) as associated gas or solution gas. A gas well produces predominantly natural gas.
However, because the underground temperature and pressure are higher
than at the surface, the gas may contain heavier hydrocarbons such as
pentane, hexane, and heptane in the gaseous state. At surface conditions these will condense out of the gas to form "natural gas condensate", often shortened to condensate. Condensate resembles gasoline in appearance and is similar in composition to some volatile light crude oils.
The proportion of light hydrocarbons in the petroleum mixture varies greatly among different oil fields, ranging from as much as 97 percent by weight in the lighter oils to as little as 50 percent in the heavier oils and bitumens.
The hydrocarbons in crude oil are mostly alkanes, cycloalkanes and various aromatic hydrocarbons, while the other organic compounds contain nitrogen, oxygen and sulfur, and trace amounts of metals such as iron, nickel, copper and vanadium. Many oil reservoirs contain live bacteria. The exact molecular composition of crude oil varies widely from formation to formation but the proportion of chemical elements varies over fairly narrow limits as follows:
| Element | Percent range |
|---|---|
| Carbon | 83 to 85% |
| Hydrogen | 10 to 14% |
| Nitrogen | 0.1 to 2% |
| Oxygen | 0.05 to 1.5% |
| Sulfur | 0.05 to 6.0% |
| Metals | less than 0.1% |
Four different types of hydrocarbon molecules appear in crude oil.
The relative percentage of each varies from oil to oil, determining the
properties of each oil.
| Hydrocarbon | Average | Range |
|---|---|---|
| Alkanes (paraffins) | 30% | 15 to 60% |
| Naphthenes | 49% | 30 to 60% |
| Aromatics | 15% | 3 to 30% |
| Asphaltics | 6% | remainder |

Unconventional resources are much larger than conventional ones.
Crude oil varies greatly in appearance depending on its composition.
It is usually black or dark brown (although it may be yellowish,
reddish, or even greenish). In the reservoir it is usually found in
association with natural gas, which being lighter forms a "gas cap" over
the petroleum, and saline water
which, being heavier than most forms of crude oil, generally sinks
beneath it. Crude oil may also be found in a semi-solid form mixed with
sand and water, as in the Athabasca oil sands in Canada, where it is usually referred to as crude bitumen.
In Canada, bitumen is considered a sticky, black, tar-like form of
crude oil which is so thick and heavy that it must be heated or diluted
before it will flow. Venezuela also has large amounts of oil in the Orinoco oil sands, although the hydrocarbons trapped in them are more fluid than in Canada and are usually called extra heavy oil. These oil sands resources are called unconventional oil to distinguish them from oil which can be extracted using traditional oil well methods. Between them, Canada and Venezuela contain an estimated 3.6 trillion barrels (570×109 m3) of bitumen and extra-heavy oil, about twice the volume of the world's reserves of conventional oil.
Petroleum is used mostly, by volume, for refining into fuel oil and gasoline, both important "primary energy"
sources. 84 percent by volume of the hydrocarbons present in petroleum
is converted into energy-rich fuels (petroleum-based fuels), including
gasoline, diesel, jet, heating, and other fuel oils, and liquefied petroleum gas.
The lighter grades of crude oil produce the best yields of these
products, but as the world's reserves of light and medium oil are
depleted, oil refineries
are increasingly having to process heavy oil and bitumen, and use more
complex and expensive methods to produce the products required. Because
heavier crude oils have too much carbon and not enough hydrogen, these
processes generally involve removing carbon from or adding hydrogen to
the molecules, and using fluid catalytic cracking to convert the longer, more complex molecules in the oil to the shorter, simpler ones in the fuels.
Due to its high energy density, easy transportability and relative abundance, oil has become the world's most important source of energy since the mid-1950s. Petroleum is also the raw material for many chemical products, including pharmaceuticals, solvents, fertilizers, pesticides, and plastics; the 16 percent not used for energy production is converted into these other materials. Petroleum is found in porous rock formations in the upper strata of some areas of the Earth's crust. There is also petroleum in oil sands (tar sands). Known oil reserves are typically estimated at around 190 km3 (1.2 trillion (short scale) barrels) without oil sands, or 595 km3 (3.74 trillion barrels) with oil sands. Consumption is currently around 84 million barrels (13.4×10⁶ m3) per day, or 4.9 km3 per year, yielding a remaining oil supply of only about 120 years, if current demand remains static.
Chemistry

Octane, a hydrocarbon found in petroleum. Lines represent single bonds; black spheres represent carbon; white spheres represent hydrogen.
Petroleum is a mixture of a very large number of different hydrocarbons; the most commonly found molecules are alkanes (paraffins), cycloalkanes (naphthenes), aromatic hydrocarbons, or more complicated chemicals like asphaltenes. Each petroleum variety has a unique mix of molecules, which define its physical and chemical properties, like color and viscosity.
The alkanes, also known as paraffins, are saturated hydrocarbons with straight or branched chains which contain only carbon and hydrogen and have the general formula CnH2n+2.
They generally have from 5 to 40 carbon atoms per molecule, although
trace amounts of shorter or longer molecules may be present in the
mixture.
The alkanes from pentane (C5H12) to octane (C8H18) are refined into gasoline, the ones from nonane (C9H20) to hexadecane (C16H34) into diesel fuel, kerosene and jet fuel. Alkanes with more than 16 carbon atoms can be refined into fuel oil and lubricating oil. At the heavier end of the range, paraffin wax is an alkane with approximately 25 carbon atoms, while asphalt has 35 and up, although these are usually cracked
by modern refineries into more valuable products. The shortest
molecules, those with four or fewer carbon atoms, are in a gaseous state
at room temperature. They are the petroleum gases. Depending on demand
and the cost of recovery, these gases are either flared off, sold as liquefied petroleum gas under pressure, or used to power the refinery's own burners. During the winter, butane (C4H10),
is blended into the gasoline pool at high rates, because its high vapor
pressure assists with cold starts. Liquified under pressure slightly
above atmospheric, it is best known for powering cigarette lighters, but
it is also a main fuel source for many developing countries. Propane
can be liquified under modest pressure, and is consumed for just about
every application relying on petroleum for energy, from cooking to
heating to transportation.
The cycloalkanes, also known as naphthenes, are saturated hydrocarbons which have one or more carbon rings to which hydrogen atoms are attached according to the formula CnH2n. Cycloalkanes have similar properties to alkanes but have higher boiling points.
The aromatic hydrocarbons are unsaturated hydrocarbons which have one or more planar six-carbon rings called benzene rings, to which hydrogen atoms are attached with the formula CnH2n-6. They tend to burn with a sooty flame, and many have a sweet aroma. Some are carcinogenic.
These different molecules are separated by fractional distillation at an oil refinery to produce gasoline, jet fuel, kerosene, and other hydrocarbons. For example, 2,2,4-trimethylpentane (isooctane), widely used in gasoline, has a chemical formula of C8H18 and it reacts with oxygen exothermically:
2 C
8H
18(l) + 25 O
2(g) → 16 CO
2(g) + 18 H
2O(g)
8H
18(l) + 25 O
2(g) → 16 CO
2(g) + 18 H
2O(g)
(ΔH = −5.51 MJ/mol of octane)
The number of various molecules in an oil sample can be determined by
laboratory analysis. The molecules are typically extracted in a solvent, then separated in a gas chromatograph, and finally determined with a suitable detector, such as a flame ionization detector or a mass spectrometer.
Due to the large number of co-eluted hydrocarbons within oil, many
cannot be resolved by traditional gas chromatography and typically
appear as a hump in the chromatogram. This unresolved complex mixture
(UCM) of hydrocarbons is particularly apparent when analyzing weathered
oils and extracts from tissues of organisms exposed to oil. Some of the
component of oil will mix with water: the water associated fraction of the oil.
Incomplete combustion of petroleum or gasoline results in
production of toxic byproducts. Too little oxygen during combustion
results in the formation of carbon monoxide.
Due to the high temperatures and high pressures involved, exhaust gases
from gasoline combustion in car engines usually include nitrogen oxides which are responsible for creation of photochemical smog.
Empirical equations for thermal properties
Heat of combustion
At a constant volume, the heat of combustion of a petroleum product can be approximated as follows:
- ,


Thermal conductivity
The thermal conductivity of petroleum based liquids can be modeled as follows:
![K={\frac {1.62}{API}}[1-0.0003(t-32)]](https://wikimedia.org/api/rest_v1/media/math/render/svg/6241f010aae8f8eff354761338cdef95bc22922e)
where is measured in BTU · °F−1hr−1ft−1 , is measured in °F and is degrees API gravity.


Specific heat
The specific heat of petroleum oils can be modeled as follows:
- ,
![c={\frac {1}{d}}[0.388+0.00046t]](https://wikimedia.org/api/rest_v1/media/math/render/svg/1a11b711d3f4d8ee856d86ae51cd96ce50aecab5)
where is measured in BTU/(lb °F), is the temperature in Fahrenheit and is the specific gravity at 60 °F (16 °C).

In units of kcal/(kg·°C), the formula is:
- ,
![c={\frac {1}{d}}[0.4024+0.00081t]](https://wikimedia.org/api/rest_v1/media/math/render/svg/e1d985cf5a9528006e2ba228ab58a189bc99f03c)
where the temperature is in Celsius and is the specific gravity at 15 °C.
Latent heat of vaporization
The latent heat of vaporization can be modeled under atmospheric conditions as follows:
- ,
![L={\frac {1}{d}}[110.9-0.09t]](https://wikimedia.org/api/rest_v1/media/math/render/svg/3f7cb7bb16981b42ca75c3364e21400973cbe945)
where is measured in BTU/lb, is measured in °F and is the specific gravity at 60 °F (16 °C).

In units of kcal/kg, the formula is:
- ,
![L={\frac {1}{d}}[194.4-0.162t]](https://wikimedia.org/api/rest_v1/media/math/render/svg/49e9a802293d3f11638d17cf4164e08daa0c8e8b)
where the temperature is in Celsius and is the specific gravity at 15 °C.
Formation

Structure of a vanadium porphyrin compound (left) extracted from petroleum by Alfred E. Treibs, father of organic geochemistry. Treibs noted the close structural similarity of this molecule and chlorophyll a (right).
Petroleum is a fossil fuel derived from ancient fossilized organic materials, such as zooplankton and algae. Vast amounts of these remains settled to sea or lake bottoms where they were covered in stagnant water (water with no dissolved oxygen) or sediments such as mud and silt faster than they could decompose aerobically. Approximately 1 m below this sediment or water oxygen concentration was low, below 0.1 mg/l, and anoxic conditions existed. Temperatures also remained constant.
As further layers settled to the sea or lake bed, intense heat
and pressure built up in the lower regions. This process caused the
organic matter to change, first into a waxy material known as kerogen, found in various oil shales around the world, and then with more heat into liquid and gaseous hydrocarbons via a process known as catagenesis. Formation of petroleum occurs from hydrocarbon pyrolysis in a variety of mainly endothermic reactions at high temperature or pressure, or both. These phases are described in detail below.
First phase of diagenesis: anaerobic decay
In the absence of plentiful oxygen, aerobic bacteria were prevented from decaying the organic matter after it was buried under a layer of sediment or water. However, anaerobic bacteria were able to reduce sulfates and nitrates among the matter to H2S and N2
respectively by using the matter as a source for other reactants. Due
to such anaerobic bacteria, at first this matter began to break apart
mostly via hydrolysis: polysaccharides and proteins were hydrolyzed to simple sugars and amino acids respectively. These were further anaerobically oxidized at an accelerated rate by the enzymes of the bacteria: e.g. amino acids went through oxidative deamination to imino acids, which in turn reacted further to ammonia and α-keto acids. Monosaccharides in turn ultimately decayed to CO2 and methane. The anaerobic decay products of amino acids, monosaccharides, phenols and aldehydes combined to fulvic acids. Fats and waxes were not extensively hydrolyzed under these mild conditions.
Second phase of diagenesis: kerogen formation
Some phenolic compounds produced from previous reactions worked as bactericides and actinomycetales order of bacteria produced antibiotic compounds (e.g. streptomycin).
Thus the action of anaerobic bacteria ceased at about 10 m below the
water or sediment. The mixture at this depth contained fulvic acids,
unreacted and partially reacted fats and waxes, slightly modified lignin, resins and other hydrocarbons. As more layers of organic matter settled to the sea or lake bed, intense heat and pressure built up in the lower regions. As a consequence, compounds of this mixture the began to combine in poorly understood ways to kerogen. Combination happened in a similar fashion as phenol and formaldehyde molecules react to urea-formaldehyde resins,
but kerogen formation occurred in a more complex manner due to a bigger
variety of reactants. The total process of kerogen formation from the
beginning of anaerobic decay is called diagenesis, a word that means a transformation of materials by dissolution and recombination of their constituents.
Catagenesis: transformation of kerogen into fossil fuels
Kerogen formation continued to the depth of about 1 km from the Earth's surface where temperatures may reach around 50 °C.
Kerogen formation represents a halfway point between organic matter and
fossil fuels: kerogen can be exposed to oxygen, oxidize and thus be
lost or it could be buried deeper inside the Earth's crust
and be subjected to conditions which allow it to slowly transform into
fossil fuels like petroleum. The latter happened through catagenesis in which the reactions were mostly radical rearrangements
of kerogen. These reactions took thousands to millions of years and no
external reactants were involved. Due to radical nature of these
reactions, kerogen reacted towards two classes of products: those with
low H/C ratio (anthracene or products similar to it) and those with high H/C ratio (methane
or products similar to it); i.e. carbon-rich or hydrogen-rich products.
Because catagenesis was closed off from external reactants, the
resulting composition of the fuel mixture was dependent on the
composition of the kerogen via reaction stoichiometry. 3 main types of kerogen exist: type I (algal), II (liptinic) and III (humic), which were formed mainly from algae, plankton and woody plants (this term includes trees, shrubs and lianas) respectively.
Catagenesis was pyrolytic
despite of the fact that it happened at relatively low temperatures
(when compared to commercial pyrolysis plants) of 60 to several hundred
°C. Pyrolysis was possible because of the long reaction times involved.
Heat for catagenesis came from the decomposition of radioactive materials of the crust, especially 40K, 232Th, 235U and 238U. The heat varied with geothermal gradient and was typically 10-30 °C per km of depth from the Earth's surface. Unusual magma intrusions, however, could have created greater localized heating.
Geologists often refer to the temperature range in which oil forms as an "oil window".
Below the minimum temperature oil remains trapped in the form of
kerogen. Above the maximum temperature the oil is converted to natural
gas through the process of thermal cracking. Sometimes, oil formed at extreme depths may migrate and become trapped at a much shallower level. The Athabasca Oil Sands are one example of this.
Abiogenic petroleum
An alternative mechanism to the one described above was proposed by Russian scientists in the mid-1850s, the hypothesis of abiogenic petroleum origin (petroleum formed by inorganic means), but this is contradicted by geological and geochemical evidence.
Abiogenic sources of oil have been found, but never in commercially
profitable amounts. "The controversy isn't over whether abiogenic oil
reserves exist," said Larry Nation of the American Association of
Petroleum Geologists. "The controversy is over how much they contribute
to Earth's overall reserves and how much time and effort geologists
should devote to seeking them out."
Reservoirs
.svg)
Hydrocarbon trap.
Three conditions must be present for oil reservoirs to form:
- a source rock rich in hydrocarbon material buried deeply enough for subterranean heat to cook it into oil,
- a porous and permeable reservoir rock where it can accumulate,
- a caprock (seal) or other mechanism to prevent the oil from escaping to the surface. Within these reservoirs, fluids will typically organize themselves like a three-layer cake with a layer of water below the oil layer and a layer of gas above it, although the different layers vary in size between reservoirs. Because most hydrocarbons are less dense than rock or water, they often migrate upward through adjacent rock layers until either reaching the surface or becoming trapped within porous rocks (known as reservoirs) by impermeable rocks above. However, the process is influenced by underground water flows, causing oil to migrate hundreds of kilometres horizontally or even short distances downward before becoming trapped in a reservoir. When hydrocarbons are concentrated in a trap, an oil field forms, from which the liquid can be extracted by drilling and pumping.
The reactions that produce oil and natural gas are often modeled as
first order breakdown reactions, where hydrocarbons are broken down to
oil and natural gas by a set of parallel reactions, and oil eventually
breaks down to natural gas by another set of reactions. The latter set
is regularly used in petrochemical plants and oil refineries.
Wells are drilled into oil reservoirs to extract the crude oil.
"Natural lift" production methods that rely on the natural reservoir
pressure to force the oil to the surface are usually sufficient for a
while after reservoirs are first tapped. In some reservoirs, such as in
the Middle East, the natural pressure is sufficient over a long time.
The natural pressure in most reservoirs, however, eventually dissipates. Then the oil must be extracted using "artificial lift"
means. Over time, these "primary" methods become less effective and
"secondary" production methods may be used. A common secondary method is
"waterflood"
or injection of water into the reservoir to increase pressure and force
the oil to the drilled shaft or "wellbore." Eventually "tertiary" or
"enhanced" oil recovery methods may be used to increase the oil's flow
characteristics by injecting steam, carbon dioxide and other gases or
chemicals into the reservoir. In the United States, primary production
methods account for less than 40 percent of the oil produced on a daily
basis, secondary methods account for about half, and tertiary recovery
the remaining 10 percent. Extracting oil (or "bitumen") from oil/tar
sand and oil shale deposits requires mining the sand or shale and
heating it in a vessel or retort, or using "in-situ" methods of
injecting heated liquids into the deposit and then pumping the liquid
back out saturated with oil.
Unconventional oil reservoirs
Oil-eating bacteria biodegrade oil that has escaped to the surface. Oil sands
are reservoirs of partially biodegraded oil still in the process of
escaping and being biodegraded, but they contain so much migrating oil
that, although most of it has escaped, vast amounts are still
present—more than can be found in conventional oil reservoirs. The
lighter fractions of the crude oil are destroyed first, resulting in
reservoirs containing an extremely heavy form of crude oil, called crude
bitumen in Canada, or extra-heavy crude oil in Venezuela. These two countries have the world's largest deposits of oil sands.
On the other hand, oil shales
are source rocks that have not been exposed to heat or pressure long
enough to convert their trapped hydrocarbons into crude oil. Technically
speaking, oil shales are not always shales and do not contain oil, but
are fined-grain sedimentary rocks containing an insoluble organic solid
called kerogen.
The kerogen in the rock can be converted into crude oil using heat and
pressure to simulate natural processes. The method has been known for
centuries and was patented in 1694 under British Crown Patent No. 330
covering, "A way to extract and make great quantities of pitch, tar, and
oil out of a sort of stone." Although oil shales are found in many
countries, the United States has the world's largest deposits.
Classification

Some marker crudes with their sulfur content (horizontal) and API gravity (vertical) and relative production quantity.
The petroleum industry generally classifies crude oil by the geographic location it is produced in (e.g. West Texas Intermediate, Brent, or Oman), its API gravity (an oil industry measure of density), and its sulfur content. Crude oil may be considered light if it has low density or heavy if it has high density; and it may be referred to as sweet if it contains relatively little sulfur or sour if it contains substantial amounts of sulfur.
The geographic location is important because it affects transportation costs to the refinery. Light crude oil is more desirable than heavy oil since it produces a higher yield of gasoline, while sweet oil commands a higher price than sour
oil because it has fewer environmental problems and requires less
refining to meet sulfur standards imposed on fuels in consuming
countries. Each crude oil has unique molecular characteristics which are
revealed by the use of Crude oil assay analysis in petroleum laboratories.
Barrels
from an area in which the crude oil's molecular characteristics have
been determined and the oil has been classified are used as pricing references throughout the world. Some of the common reference crudes are:
- West Texas Intermediate (WTI), a very high-quality, sweet, light oil delivered at Cushing, Oklahoma for North American oil
- Brent Blend, consisting of 15 oils from fields in the Brent and Ninian systems in the East Shetland Basin of the North Sea. The oil is landed at Sullom Voe terminal in Shetland. Oil production from Europe, Africa and Middle Eastern oil flowing West tends to be priced off this oil, which forms a benchmark
- Dubai-Oman, used as benchmark for Middle East sour crude oil flowing to the Asia-Pacific region
- Tapis (from Malaysia, used as a reference for light Far East oil)
- Minas (from Indonesia, used as a reference for heavy Far East oil)
- The OPEC Reference Basket, a weighted average of oil blends from various OPEC (The Organization of the Petroleum Exporting Countries) countries
- Midway Sunset Heavy, by which heavy oil in California is priced
- Western Canadian Select the benchmark crude oil for emerging heavy, high TAN (acidic) crudes.
There are declining amounts of these benchmark oils being produced
each year, so other oils are more commonly what is actually delivered.
While the reference price may be for West Texas Intermediate delivered
at Cushing, the actual oil being traded may be a discounted Canadian
heavy oil—Western Canadian Select— delivered at Hardisty, Alberta, and for a Brent Blend delivered at Shetland, it may be a discounted Russian Export Blend delivered at the port of Primorsk.
Petroleum industry

Crude oil export treemap (2012) from Harvard Atlas of Economic Complexity.

New York Mercantile Exchange prices ($/bbl) for West Texas Intermediate 2000 through Oct 2014.
The petroleum industry is involved in the global processes of exploration, extraction, refining, transporting (often with oil tankers and pipelines), and marketing petroleum products. The largest volume products of the industry are fuel oil and gasoline. Petroleum is also the raw material for many chemical products,
including pharmaceuticals, solvents, fertilizers, pesticides, and
plastics. The industry is usually divided into three major components: upstream, midstream and downstream. Midstream operations are usually included in the downstream category.
Petroleum is vital to many industries, and is of importance to the maintenance of industrialized civilization
itself, and thus is a critical concern to many nations. Oil accounts
for a large percentage of the world's energy consumption, ranging from a
low of 32 percent for Europe and Asia, up to a high of 53 percent for
the Middle East, South and Central America (44%), Africa (41%), and
North America (40%). The world at large consumes 30 billion barrels (4.8 km3)
of oil per year, and the top oil consumers largely consist of developed
nations. In fact, 24 percent of the oil consumed in 2004 went to the
United States alone, though by 2007 this had dropped to 21 percent of world oil consumed.
In the US, in the states of Arizona, California, Hawaii, Nevada, Oregon and Washington, the Western States Petroleum Association
(WSPA) represents companies responsible for producing, distributing,
refining, transporting and marketing petroleum. This non-profit trade
association was founded in 1907, and is the oldest petroleum trade
association in the United States.
Shipping
In the 1950s, shipping costs made up 33 percent of the price of oil transported from the Persian Gulf to the United States, but due to the development of supertankers in the 1970s, the cost of shipping dropped to only 5 percent of the price of Persian oil in the US.
Due to the increase of the value of the crude oil during the last 30
years, the share of the shipping cost on the final cost of the delivered
commodity was less than 3% in 2010. For example, in 2010 the shipping
cost from the Persian Gulf to the US was in the range of 20 $/t and the
cost of the delivered crude oil around 800 $/t.
Price

Nominal and inflation-adjusted US dollar price of crude oil, 1861–2015.
After the collapse of the OPEC-administered pricing system in 1985,
and a short-lived experiment with netback pricing, oil-exporting
countries adopted a market-linked pricing mechanism. First adopted by PEMEX
in 1986, market-linked pricing was widely accepted, and by 1988 became
and still is the main method for pricing crude oil in international
trade. The current reference, or pricing markers, are Brent, WTI, and Dubai/Oman.
Uses
The chemical structure of petroleum is heterogeneous, composed of hydrocarbon chains of different lengths. Because of this, petroleum may be taken to oil refineries and the hydrocarbon chemicals separated by distillation and treated by other chemical processes, to be used for a variety of purposes. The total cost per plant is about 9 billion dollars.
Fuels
The most common distillation fractions of petroleum are fuels. Fuels include (by increasing boiling temperature range):
| Fraction | Boiling range oC |
|---|---|
| Liquefied petroleum gas (LPG) | −40 |
| Butane | −12 to −1 |
| Gasoline/Petrol | −1 to 110 |
| Jet fuel | 150 to 205 |
| Kerosene | 205 to 260 |
| Fuel oil | 205 to 290 |
| Diesel fuel | 260 to 315 |
Petroleum classification according to chemical composition.
| Class of petroleum | Composition of 250–300 °C fraction, wt. % | ||||
|---|---|---|---|---|---|
| Par. | Napth | Arom. | Wax | Asph. | |
| Paraffinic | 46—61 | 22–32 | 12–25 | 1.5–10 | 0–6 |
| Paraffinic-naphtenic | 42–45 | 38–39 | 16–20 | 1–6 | 0–6 |
| Naphthenic | 15–26 | 61–76 | 8–13 | Trace | 0–6 |
| Paraffinic-naphtenic-aromatic | 27–35 | 36–47 | 26–33 | 0.5–1 | 0–10 |
| Aromatic | 0–8 | 57–78 | 20–25 | 0–0.5 | 0–20 |
Other derivatives
Certain types of resultant hydrocarbons may be mixed with other non-hydrocarbons, to create other end products:
- Alkenes (olefins), which can be manufactured into plastics or other compounds
- Lubricants (produces light machine oils, motor oils, and greases, adding viscosity stabilizers as required)
- Wax, used in the packaging of frozen foods, among others
- Sulfur or sulfuric acid. These are useful industrial materials. Sulfuric acid is usually prepared as the acid precursor oleum, a byproduct of sulfur removal from fuels.
- Bulk tar
- Asphalt
- Petroleum coke, used in speciality carbon products or as solid fuel
- Paraffin wax
- Aromatic petrochemicals to be used as precursors in other chemical production
Agriculture
Since the 1940s, agricultural productivity has increased dramatically, due largely to the increased use of energy-intensive mechanization, fertilizers and pesticides.
Petroleum by country
Consumption statistics
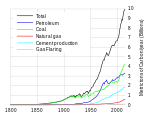 Global fossil carbon emissions, an indicator of consumption, from 1800.TotalOil
 Rate of world energy usage per year from 1970.
 Daily oil consumption from 1980 to 2006.
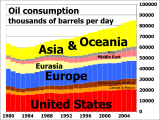
 Oil consumption 1980 to 2007 by region.


Consumption
According
to the US Energy Information Administration (EIA) estimate for 2011,
the world consumes 87.421 million barrels of oil each day.

Oil consumption per capita (darker colors represent more consumption, gray represents no data) (source: see file description).
| > 0.07 0.07–0.05 0.05–0.035 0.035–0.025 0.025–0.02 | 0.02–0.015 0.015–0.01 0.01–0.005 0.005–0.0015 < 0.0015 |
This table orders the amount of petroleum consumed in 2011 in thousand barrels (1000 bbl) per day and in thousand cubic meters (1000 m3) per day:
| Consuming nation 2011 | (1000 bbl/ day) |
(1000 m3/ day) |
Population in millions |
bbl/year per capita |
m3/year per capita |
National production/ consumption |
|---|---|---|---|---|---|---|
| United States 1 | 18,835.5 | 2,994.6 | 314 | 21.8 | 3.47 | 0.51 |
| China | 9,790.0 | 1,556.5 | 1345 | 2.7 | 0.43 | 0.41 |
| Japan 2 | 4,464.1 | 709.7 | 127 | 12.8 | 2.04 | 0.03 |
| India 2 | 3,292.2 | 523.4 | 1198 | 1 | 0.16 | 0.26 |
| Russia 1 | 3,145.1 | 500.0 | 140 | 8.1 | 1.29 | 3.35 |
| Saudi Arabia (OPEC) | 2,817.5 | 447.9 | 27 | 40 | 6.4 | 3.64 |
| Brazil | 2,594.2 | 412.4 | 193 | 4.9 | 0.78 | 0.99 |
| Germany 2 | 2,400.1 | 381.6 | 82 | 10.7 | 1.70 | 0.06 |
| Canada | 2,259.1 | 359.2 | 33 | 24.6 | 3.91 | 1.54 |
| South Korea 2 | 2,230.2 | 354.6 | 48 | 16.8 | 2.67 | 0.02 |
| Mexico 1 | 2,132.7 | 339.1 | 109 | 7.1 | 1.13 | 1.39 |
| France 2 | 1,791.5 | 284.8 | 62 | 10.5 | 1.67 | 0.03 |
| Iran (OPEC) | 1,694.4 | 269.4 | 74 | 8.3 | 1.32 | 2.54 |
| United Kingdom 1 | 1,607.9 | 255.6 | 61 | 9.5 | 1.51 | 0.93 |
| Italy 2 | 1,453.6 | 231.1 | 60 | 8.9 | 1.41 | 0.10 |
1 peak production of oil already passed in this state
2 This country is not a major oil producer
Production

Top oil-producing countries (million barrels per day).

World map with countries by oil production (information from 2006–2012).
In petroleum industry parlance, production refers to the quantity of crude extracted from reserves, not the literal creation of the product.
| Country | Oil Production (bbl/day, 2016) | |
|---|---|---|
| 1 | 10,551,497 | |
| 2 | 10,460,710 | |
| 3 | 8,875,817 | |
| 4 | 4,451,516 | |
| 5 | 3,990,956 | |
| 6 | 3,980,650 | |
| 7 | 3,662,694 | |
| 8 | 3,106,077 | |
| 9 | 2,923,825 | |
| 10 | 2,515,459 | |
| 11 | 2,276,967 | |
| 12 | 2,186,877 | |
| 13 | 1,999,885 | |
| 14 | 1,769,615 | |
| 15 | 1,647,975 | |
| 16 | 1,595,199 | |
| 17 | 1,522,902 | |
| 18 | 1,348,361 | |
| 19 | 1,006,841 | |
| 20 | 939,760 |
Export


Oil exports by country (barrels per day, 2006).
| # | Exporting nation | 103bbl/d (2011) | 103m3/d (2011) | 103bbl/d (2009) | 103m3/d (2009) | 103bbl/d (2006) | 103m3/d (2006) |
|---|---|---|---|---|---|---|---|
| 1 | Saudi Arabia (OPEC) | 8,336 | 1,325 | 7,322 | 1,164 | 8,651 | 1,376 |
| 2 | Russia 1 | 7,083 | 1,126 | 7,194 | 1,144 | 6,565 | 1,044 |
| 3 | Iran (OPEC) | 2,540 | 403 | 2,486 | 395 | 2,519 | 401 |
| 4 | United Arab Emirates (OPEC) | 2,524 | 401 | 2,303 | 366 | 2,515 | 400 |
| 5 | Kuwait (OPEC) | 2,343 | 373 | 2,124 | 338 | 2,150 | 342 |
| 6 | Nigeria (OPEC) | 2,257 | 359 | 1,939 | 308 | 2,146 | 341 |
| 7 | Iraq (OPEC) | 1,915 | 304 | 1,764 | 280 | 1,438 | 229 |
| 8 | Angola (OPEC) | 1,760 | 280 | 1,878 | 299 | 1,363 | 217 |
| 9 | Norway 1 | 1,752 | 279 | 2,132 | 339 | 2,542 | 404 |
| 10 | Venezuela (OPEC) 1 | 1,715 | 273 | 1,748 | 278 | 2,203 | 350 |
| 11 | Algeria (OPEC) 1 | 1,568 | 249 | 1,767 | 281 | 1,847 | 297 |
| 12 | Qatar (OPEC) | 1,468 | 233 | 1,066 | 169 | – | – |
| 13 | Canada 2 | 1,405 | 223 | 1,168 | 187 | 1,071 | 170 |
| 14 | Kazakhstan | 1,396 | 222 | 1,299 | 207 | 1,114 | 177 |
| 15 | Azerbaijan 1 | 836 | 133 | 912 | 145 | 532 | 85 |
| 16 | Trinidad and Tobago 1 | 177 | 112 | 167 | 160 | 155 | 199 |
1 peak production already passed in this state
2 Canadian statistics are complicated by the
fact it is both an importer and exporter of crude oil, and refines large
amounts of oil for the U.S. market. It is the leading source of U.S.
imports of oil and products, averaging 2,500,000 bbl/d (400,000 m3/d) in August 2007.
Total world production/consumption (as of 2005) is approximately 84 million barrels per day (13,400,000 m3/d).
Import

Oil imports by country (barrels per day, 2006).
| # | Importing nation | 103bbl/day (2011) | 103m3/day (2011) | 103bbl/day (2009) | 103m3/day (2009) | 103bbl/day (2006) | 103m3/day (2006) |
|---|---|---|---|---|---|---|---|
| 1 | United States 1 | 8,728 | 1,388 | 9,631 | 1,531 | 12,220 | 1,943 |
| 2 | China 2 | 5,487 | 872 | 4,328 | 688 | 3,438 | 547 |
| 3 | Japan | 4,329 | 688 | 4,235 | 673 | 5,097 | 810 |
| 4 | India | 2,349 | 373 | 2,233 | 355 | 1,687 | 268 |
| 5 | Germany | 2,235 | 355 | 2,323 | 369 | 2,483 | 395 |
| 6 | South Korea | 2,170 | 345 | 2,139 | 340 | 2,150 | 342 |
| 7 | France | 1,697 | 270 | 1,749 | 278 | 1,893 | 301 |
| 8 | Spain | 1,346 | 214 | 1,439 | 229 | 1,555 | 247 |
| 9 | Italy | 1,292 | 205 | 1,381 | 220 | 1,558 | 248 |
| 10 | Singapore | 1,172 | 186 | 916 | 146 | 787 | 125 |
| 11 | Republic of China (Taiwan) | 1,009 | 160 | 944 | 150 | 942 | 150 |
| 12 | Netherlands | 948 | 151 | 973 | 155 | 936 | 149 |
| 13 | Turkey | 650 | 103 | 650 | 103 | 576 | 92 |
| 14 | Belgium | 634 | 101 | 597 | 95 | 546 | 87 |
| 15 | Thailand | 592 | 94 | 538 | 86 | 606 | 96 |
1 peak production of oil expected in 2020
2 Major oil producer whose production is still increasing
Oil imports to the United States by country 2010

Oil imports to US, 2010.
Non-producing consumers
Countries whose oil production is 10% or less of their consumption.
| # | Consuming nation | (bbl/day) | (m3/day) |
|---|---|---|---|
| 1 | Japan | 5,578,000 | 886,831 |
| 2 | Germany | 2,677,000 | 425,609 |
| 3 | South Korea | 2,061,000 | 327,673 |
| 4 | France | 2,060,000 | 327,514 |
| 5 | Italy | 1,874,000 | 297,942 |
| 6 | Spain | 1,537,000 | 244,363 |
| 7 | Netherlands | 946,700 | 150,513 |
| 8 | Turkey | 575,011 | 91,663 |
Environmental effects

Diesel fuel spill on a road.
Because petroleum is a naturally occurring substance, its presence in
the environment need not be the result of human causes such as
accidents and routine activities (seismic exploration, drilling, extraction, refining and combustion). Phenomena such as seeps and tar pits
are examples of areas that petroleum affects without man's involvement.
Regardless of source, petroleum's effects when released into the
environment are similar.
Ocean acidification

Seawater acidification.
Ocean acidification is the increase in the acidity of the Earth's oceans caused by the uptake of carbon dioxide (CO2) from the atmosphere.
This increase in acidity inhibits all marine life – having a greater
impact on smaller organisms as well as shelled organisms.
Global warming
When burned, petroleum releases carbon dioxide, a greenhouse gas. Along with the burning of coal, petroleum combustion may be the largest contributor to the increase in atmospheric CO2. Atmospheric CO2 has risen over the last 150 years to current levels of over 400 ppmv, from the 180 – 300 ppmv of the prior 800 thousand years This rise in temperature may have reduced the Arctic ice cap to 1,100,000 sq mi (2,800,000 km2), smaller than ever recorded.
Because of this melt, more oil reserves have been revealed. About 13
percent of the world's undiscovered oil resides in the Arctic.
Extraction
Oil
extraction is simply the removal of oil from the reservoir (oil pool).
Oil is often recovered as a water-in-oil emulsion, and specialty chemicals called demulsifiers
are used to separate the oil from water. Oil extraction is costly and
sometimes environmentally damaging. Offshore exploration and extraction
of oil disturbs the surrounding marine environment.
Oil spills

Kelp after an oil spill.


Crude oil and refined fuel spills from tanker ship accidents have damaged natural ecosystems in Alaska, the Gulf of Mexico, the Galápagos Islands, France and many other places.
The quantity of oil spilled during accidents has ranged from a few hundred tons to several hundred thousand tons (e.g., Deepwater Horizon oil spill, SS Atlantic Empress, Amoco Cadiz). Smaller spills have already proven to have a great impact on ecosystems, such as the Exxon Valdez oil spill.
Oil spills at sea are generally much more damaging than those on
land, since they can spread for hundreds of nautical miles in a thin oil slick
which can cover beaches with a thin coating of oil. This can kill sea
birds, mammals, shellfish and other organisms it coats. Oil spills on
land are more readily containable if a makeshift earth dam can be
rapidly bulldozed around the spill site before most of the oil escapes, and land animals can avoid the oil more easily.
Control of oil spills is difficult, requires ad hoc methods, and
often a large amount of manpower. The dropping of bombs and incendiary
devices from aircraft on the SS Torrey Canyon wreck produced poor results; modern techniques would include pumping the oil from the wreck, like in the Prestige oil spill or the Erika oil spill.
Though crude oil is predominantly composed of various hydrocarbons, certain nitrogen heterocylic compounds, such as pyridine, picoline, and quinoline
are reported as contaminants associated with crude oil, as well as
facilities processing oil shale or coal, and have also been found at
legacy wood treatment
sites. These compounds have a very high water solubility, and thus tend
to dissolve and move with water. Certain naturally occurring bacteria,
such as Micrococcus, Arthrobacter, and Rhodococcus have been shown to degrade these contaminants.
Tarballs
A tarball is a blob of crude oil (not to be confused with tar,
which is a man-made product derived from pine trees or refined from
petroleum) which has been weathered after floating in the ocean.
Tarballs are an aquatic pollutant in most environments, although they can occur naturally, for example in the Santa Barbara Channel of California or in the Gulf of Mexico off Texas. Their concentration and features have been used to assess the extent of oil spills. Their composition can be used to identify their sources of origin, and tarballs themselves may be dispersed over long distances by deep sea currents. They are slowly decomposed by bacteria, including Chromobacterium violaceum, Cladosporium resinae, Bacillus submarinus, Micrococcus varians, Pseudomonas aeruginosa, Candida marina and Saccharomyces estuari.
Whales
James S. Robbins has argued that the advent of petroleum-refined kerosene saved some species of great whales from extinction by providing an inexpensive substitute for whale oil, thus eliminating the economic imperative for open-boat whaling.
Alternatives to petroleum
In the United States in 2007 about 70 percent of petroleum was used
for transportation (e.g. gasoline, diesel, jet fuel), 24 percent by
industry (e.g. production of plastics), 5 percent for residential and
commercial uses, and 2 percent for electricity production. Outside of the US, a higher proportion of petroleum tends to be used for electricity.
Alternatives to petroleum-based vehicle fuels

Brazilian fuel station with four alternative fuels for sale: diesel (B3), gasohol (E25), neat ethanol (E100), and compressed natural gas (CNG).
Alternative fuel vehicles refers to both:
- Vehicles that use alternative fuels used in standard or modified internal combustion engines such as natural gas vehicles, neat ethanol vehicles, flexible-fuel vehicles, biodiesel-powered vehicles, propane autogas, and hydrogen vehicles.
- Vehicles with advanced propulsion systems that reduce or substitute petroleum use such as battery electric vehicles, plug-in hybrid electric vehicles, hybrid electric vehicles, and hydrogen fuel cell vehicles.
Alternatives to using oil in industry
Biological feedstocks do exist for industrial uses such as Bioplastic production.
Alternatives to burning petroleum for electricity
In oil producing countries with little refinery capacity, oil is sometimes burned to produce electricity. Renewable energy technologies such as solar power, wind power, micro hydro, biomass and biofuels are used, but the primary alternatives remain large-scale hydroelectricity, nuclear and coal-fired generation.
Future of petroleum production

US oil production and imports, 1910-2012.
Consumption in the twentieth and twenty-first centuries has been abundantly pushed by automobile sector growth. The 1985–2003 oil glut even fueled the sales of low fuel economy vehicles in OECD
countries. The 2008 economic crisis seems to have had some impact on
the sales of such vehicles; still, in 2008 oil consumption showed a
small increase.
In 2016 Goldman Sachs predicted lower demand for oil due to emerging economies concerns, especially China. The BRICS
(Brasil, Russia, India, China, South Africa) countries might also kick
in, as China briefly was the first automobile market in December 2009. The immediate outlook still hints upwards. In the long term, uncertainties linger; the OPEC
believes that the OECD countries will push low consumption policies at
some point in the future; when that happens, it will definitely curb oil
sales, and both OPEC and the Energy Information Administration (EIA) kept lowering their 2020 consumption estimates during the past five years. A detailed review of International Energy Agency
oil projections have revealed that revisions of world oil production,
price and investments have been motivated by a combination of demand and
supply factors.
All together, Non-OPEC conventional projections have been fairly stable
the last 15 years, while downward revisions were mainly allocated to
OPEC. Recent upward revisions are primarily a result of US tight oil.
Production will also face an increasingly complex situation;
while OPEC countries still have large reserves at low production prices,
newly found reservoirs often lead to higher prices; offshore giants
such as Tupi, Guara and Tiber
demand high investments and ever-increasing technological abilities.
Subsalt reservoirs such as Tupi were unknown in the twentieth century,
mainly because the industry was unable to probe them. Enhanced Oil Recovery (EOR) techniques (example: DaQing, China ) will continue to play a major role in increasing the world's recoverable oil.
The expected availability of petroleum resources has always been
around 35 years or even less since the start of the modern exploration.
The oil constant, an insider pun in the German industry, refers to that effect.
Peak oil

Global peak oil forecast.
Peak oil is a term applied to the projection that future petroleum
production (whether for individual oil wells, entire oil fields, whole
countries, or worldwide production) will eventually peak and then
decline at a similar rate to the rate of increase before the peak as
these reserves are exhausted. The peak of oil discoveries was in 1965,
and oil production per year has surpassed oil discoveries every year
since 1980. However, this does not mean that potential oil production has surpassed oil demand.
Hubbert
applied his theory to accurately predict the peak of U.S. conventional
oil production at a date between 1966 and 1970. This prediction was
based on data available at the time of his publication in 1956. In the
same paper, Hubbert predicts world peak oil in "half a century" after
his publication, which would be 2006.
It is difficult to predict the oil peak in any given region, due
to the lack of knowledge and/or transparency in accounting of global oil
reserves.
Based on available production data, proponents have previously
predicted the peak for the world to be in years 1989, 1995, or
1995–2000. Some of these predictions date from before the recession of
the early 1980s, and the consequent reduction in global consumption, the
effect of which was to delay the date of any peak by several years.
Just as the 1971 U.S. peak in oil production was only clearly recognized
after the fact, a peak in world production will be difficult to discern
until production clearly drops off.
The peak is also a moving target as it is now measured as "liquids",
which includes synthetic fuels, instead of just conventional oil.
The International Energy Agency
(IEA) said in 2010 that production of conventional crude oil had peaked
in 2006 at 70 MBBL/d, then flattened at 68 or 69 thereafter. Since virtually all economic sectors rely heavily on petroleum, peak oil, if it were to occur, could lead to a "partial or complete failure of markets".
In the mid-2000s, widespread fears of an imminent peak led to the "peak
oil movement," in which over one hundred thousand Americans prepared,
individually and collectively, for the "post-carbon" future.
Unconventional production
Unconventional oil is petroleum produced or extracted using techniques other than the conventional methods.
The calculus for peak oil has changed with the introduction of
unconventional production methods. In particular, the combination of horizontal drilling and hydraulic fracturing has resulted in a significant increase in production from previously uneconomic plays.
Analysts expected that $150 billion would be spent on further
developing North American tight oil fields in 2015. The large increase
in tight oil production is one of the reasons behind the price drop in
late 2014. Certain rock strata
contain hydrocarbons but have low permeability and are not thick from a
vertical perspective. Conventional vertical wells would be unable to
economically retrieve these hydrocarbons. Horizontal drilling, extending
horizontally through the strata, permits the well to access a much
greater volume of the strata. Hydraulic fracturing creates greater
permeability and increases hydrocarbon flow to the wellbore.


