An Acela Express high-speed train passing Old Saybrook station on its way to Boston, Massachusetts.
Two Canadian National diesel locomotives pull a southbound freight train on the Norfolk-Southern railroad, near Columbus, Ohio in the United States
A British Rail Class 802 between London and Edinburgh in the United Kingdom
Rolling stock in a rail transport system generally encounters lower frictional resistance than road vehicles, so passenger and freight cars (carriages and wagons) can be coupled into longer trains. The operation is carried out by a railway company, providing transport between train stations or freight customer facilities. Power is provided by locomotives which either draw electric power from a railway electrification system or produce their own power, usually by diesel engines. Most tracks are accompanied by a signalling system. Railways are a safe land transport system when compared to other forms of transport.
Railway transport is capable of high levels of passenger and cargo
utilization and energy efficiency, but is often less flexible and more capital-intensive than road transport, when lower traffic levels are considered.
The oldest known, man/animal-hauled railways date back to the 6th century BC in Corinth, Greece. Rail transport then commenced in mid 16th century in Germany in the form of horse-powered funiculars and wagonways. Modern rail transport commenced with the British development of the steam locomotives in the early 19th century. Thus the railway system in Great Britain is the oldest in the world. Built by George Stephenson and his son Robert's company Robert Stephenson and Company, the Locomotion No. 1 is the first steam locomotive to carry passengers on a public rail line, the Stockton and Darlington Railway
in 1825. George Stephenson also built the first public inter-city
railway line in the world to use only the steam locomotives all the
time, the Liverpool and Manchester Railway which opened in 1830. With steam engines, one could construct mainline railways, which were a key component of the Industrial Revolution. Also, railways reduced the costs of shipping, and allowed for fewer lost goods, compared with water transport, which faced occasional sinking of ships. The change from canals
to railways allowed for "national markets" in which prices varied very
little from city to city. The spread of the railway network and the use
of railway timetables, led to the standardization of time (railway time)
in Britain based on Greenwich Mean Time. Prior to this, major towns and
cities varied their local time relative to GMT. The invention and
development of the railway in the United Kingdom was one of the most
important technological inventions of the 19th century. The world's
first underground railway, the Metropolitan Railway (part of the London Underground), opened in 1863.
In the 1880s, electrified
trains were introduced, leading to electrification of tramways and
rapid transit systems. Starting during the 1940s, the non-electrified
railways in most countries had their steam locomotives replaced by diesel-electric locomotives, with the process being almost complete by the 2000s. During the 1960s, electrified high-speed railway systems were introduced in Japan
and later in some other countries. Many countries are in the process of
replacing diesel locomotives with electric locomotives, mainly due to
environmental concerns, a notable example being Switzerland,
which has completely electrified its network. Other forms of guided
ground transport outside the traditional railway definitions, such as monorail or maglev, have been tried but have seen limited use.
Following a decline after World War II
due to competition from cars, rail transport has had a revival in
recent decades due to road congestion and rising fuel prices, as well as
governments investing in rail as a means of reducing CO2 emissions in the context of concerns about global warming.
History
The history of rail transport began in the 6th century BC in Ancient Greece. It can be divided up into several discrete periods defined by the principal means of track material and motive power used.
Ancient systems
Evidence indicates that there was 6 to 8.5 km long Diolkos paved trackway, which transported boats across the Isthmus of Corinth in Greece from around 600 BC. Wheeled vehicles pulled by men and animals ran in grooves in limestone,
which provided the track element, preventing the wagons from leaving
the intended route. The Diolkos was in use for over 650 years, until at
least the 1st century AD. The paved tracks were also later built in Roman Egypt.
Pre-steam
Wooden rails introduced
Reisszug, as it appears today
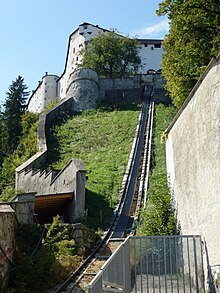
In 1515, Cardinal Matthäus Lang wrote a description of the Reisszug, a funicular railway at the Hohensalzburg Castle in Austria. The line originally used wooden rails and a hemp haulage rope and was operated by human or animal power, through a treadwheel. The line still exists and is operational, although in updated form and is possibly the oldest operational railway.
Minecart shown in De Re Metallica (1556). The guide pin fits in a groove between two wooden planks.
Wagonways (or tramways)
using wooden rails, hauled by horses, started appearing in the 1550s to
facilitate the transport of ore tubs to and from mines, and soon became
popular in Europe. Such an operation was illustrated in Germany in 1556
by Georgius Agricola (image right) in his work De re metallica.
This line used "Hund" carts with unflanged wheels running on wooden
planks and a vertical pin on the truck fitting into the gap between the
planks to keep it going the right way. The miners called the wagons Hunde ("dogs") from the noise they made on the tracks.
There are many references to their use in central Europe in the 16th century. Such a transport system was later used by German miners at Caldbeck, Cumbria, England, perhaps from the 1560s. A wagonway was built at Prescot, near Liverpool,
sometime around 1600, possibly as early as 1594. Owned by Philip
Layton, the line carried coal from a pit near Prescot Hall to a terminus
about half a mile away. A funicular railway was also made at Broseley in Shropshire some time before 1604. This carried coal for James Clifford from his mines down to the river Severn to be loaded onto barges and carried to riverside towns. The Wollaton Wagonway, completed in 1604 by Huntingdon Beaumont, has sometimes erroneously been cited as the earliest British railway. It ran from Strelley to Wollaton near Nottingham.
The Middleton Railway in Leeds,
which was built in 1758, later became the world's oldest operational
railway (other than funiculars), albeit now in an upgraded form. In
1764, the first railway in the Americas was built in Lewiston, New York.
Metal rails introduced
In the late 1760s, the Coalbrookdale Company began to fix plates of cast iron to the upper surface of the wooden rails. This allowed a variation of gauge to be used. At first only balloon loops could be used for turning, but later, movable points were taken into use that allowed for switching.
A replica of a "Little Eaton Tramway" wagon, the tracks are plateways
A system was introduced in which unflanged wheels ran on L-shaped metal plates – these became known as plateways. John Curr,
a Sheffield colliery manager, invented this flanged rail in 1787,
though the exact date of this is disputed. The plate rail was taken up
by Benjamin Outram for wagonways serving his canals, manufacturing them at his Butterley ironworks. In 1803, William Jessop opened the Surrey Iron Railway, a double track plateway, erroneously sometimes cited as world's first public railway, in south London.
Cast iron fishbelly edge rail manufactured by Outram at the Butterley Company ironworks for the Cromford and High Peak Railway (1831). These are smooth edgerails for wheels with flanges.
Meanwhile, William Jessop had earlier used a form of all-iron edge rail and flanged wheels successfully for an extension to the Charnwood Forest Canal at Nanpantan, Loughborough, Leicestershire
in 1789. In 1790, Jessop and his partner Outram began to manufacture
edge-rails. Jessop became a partner in the Butterley Company in 1790.
The first public edgeway (thus also first public railway) built was Lake Lock Rail Road in 1796. Although the primary purpose of the line was to carry coal, it also carried passengers.
These two systems of constructing iron railways, the "L"
plate-rail and the smooth edge-rail, continued to exist side by side
until well into the early 19th century. The flanged wheel and edge-rail
eventually proved its superiority and became the standard for railways.
Cast iron used in rails proved unsatisfactory because it was brittle and broke under heavy loads. The wrought iron invented by John Birkinshaw in 1820 replaced cast iron. Wrought iron
(usually simply referred to as "iron") was a ductile material that
could undergo considerable deformation before breaking, making it more
suitable for iron rails. But iron was expensive to produce until Henry Cort patented the puddling process in 1784. In 1783 Cort also patented the rolling process, which was 15 times faster at consolidating and shaping iron than hammering. These processes greatly lowered the cost of producing iron and rails. The next important development in iron production was hot blast developed by James Beaumont Neilson (patented 1828), which considerably reduced the amount of coke (fuel) or charcoal needed to produce pig iron. Wrought iron was a soft material that contained slag or dross.
The softness and dross tended to make iron rails distort and delaminate
and they lasted less than 10 years. Sometimes they lasted as little as
one year under high traffic. All these developments in the production of
iron eventually led to replacement of composite wood/iron rails with
superior all iron rails.
The introduction of the Bessemer process,
enabling steel to be made inexpensively, led to the era of great
expansion of railways that began in the late 1860s. Steel rails lasted
several times longer than iron. Steel rails made heavier locomotives possible, allowing for longer trains and improving the productivity of railroads. The Bessemer process introduced nitrogen into the steel, which caused the steel to become brittle with age. The open hearth furnace
began to replace the Bessemer process near the end of the 19th century,
improving the quality of steel and further reducing costs. Thus steel
completely replaced the use of iron in rails, becoming standard for all
railways.
The first passenger horsecar or tram, Swansea and Mumbles Railway was opened between Swansea and Mumbles in Wales in 1807.
Horses remained the preferable mode for tram transport even after the
arrival of steam engines, well till the end of the 19th century. The
major reason was that the horse-cars were cleaner compared to steam
driven trams which caused smoke in city streets.
Steam power introduced
James Watt, a Scottish inventor and mechanical engineer, greatly improved the steam engine of Thomas Newcomen, hitherto used to pump water out of mines. Watt developed a reciprocating engine in 1769, capable of powering a wheel. Although the Watt engine powered cotton mills and a variety of machinery, it was a large stationary engine.
It could not be otherwise: the state of boiler technology necessitated
the use of low pressure steam acting upon a vacuum in the cylinder; this
required a separate condenser and an air pump.
Nevertheless, as the construction of boilers improved, Watt
investigated the use of high-pressure steam acting directly upon a
piston. This raised the possibility of a smaller engine, that might be
used to power a vehicle and he patented a design for a steam locomotive in 1784. His employee William Murdoch produced a working model of a self-propelled steam carriage in that year.
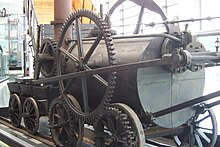
A replica of Trevithick's engine at the National Waterfront Museum, Swansea
The first full-scale working railway steam locomotive was built in the United Kingdom in 1804 by Richard Trevithick, a British engineer born in Cornwall. This used high-pressure steam to drive the engine by one power stroke. The transmission system employed a large flywheel
to even out the action of the piston rod. On 21 February 1804, the
world's first steam-powered railway journey took place when Trevithick's
unnamed steam locomotive hauled a train along the tramway of the Penydarren ironworks, near Merthyr Tydfil in South Wales. Trevithick later demonstrated a locomotive operating upon a piece of circular rail track in Bloomsbury, London, the Catch Me Who Can,
but never got beyond the experimental stage with railway locomotives,
not least because his engines were too heavy for the cast-iron plateway
track then in use.
The Salamanca locomotive
The first commercially successful steam locomotive was Matthew Murray's rack locomotive Salamanca built for the Middleton Railway in Leeds in 1812. This twin-cylinder locomotive was not heavy enough to break the edge-rails track and solved the problem of adhesion by a cog-wheel using teeth cast on the side of one of the rails. Thus it was also the first rack railway.
This was followed in 1813 by the locomotive Puffing Billy built by Christopher Blackett and William Hedley for the Wylam Colliery Railway, the first successful locomotive running by adhesion only. This was accomplished by the distribution of weight between a number of wheels. Puffing Billy is now on display in the Science Museum in London, making it the oldest locomotive in existence.
The Locomotion at Darlington Railway Centre and Museum
In 1814 George Stephenson, inspired by the early locomotives of Trevithick, Murray and Hedley, persuaded the manager of the Killingworth colliery where he worked to allow him to build a steam-powered
machine. Stephenson played a pivotal role in the development and
widespread adoption of the steam locomotive. His designs considerably
improved on the work of the earlier pioneers. He built the locomotive Blücher, also a successful flanged-wheel adhesion locomotive. In 1825 he built the locomotive Locomotion for the Stockton and Darlington Railway
in the north east of England, which became the first public steam
railway in the world in 1825, although it used both horse power and
steam power on different runs. In 1829, he built the locomotive Rocket, which entered in and won the Rainhill Trials.
This success led to Stephenson establishing his company as the
pre-eminent builder of steam locomotives for railways in Great Britain
and Ireland, the United States, and much of Europe. The first public railway which used only steam locomotives, all the time, was Liverpool and Manchester Railway, built in 1830.
Steam power continued to be the dominant power system in railways around the world for more than a century.
Electric power introduced
The first known electric locomotive was built in 1837 by chemist Robert Davidson of Aberdeen in Scotland, and it was powered by galvanic cells (batteries). Thus it was also the earliest battery electric locomotive. Davidson later built a larger locomotive named Galvani, exhibited at the Royal Scottish Society of Arts Exhibition in 1841. The seven-ton vehicle had two direct-drive reluctance motors, with fixed electromagnets acting on iron bars attached to a wooden cylinder on each axle, and simple commutators.
It hauled a load of six tons at four miles per hour (6 kilometers per
hour) for a distance of one and a half miles (2.4 kilometers). It was
tested on the Edinburgh and Glasgow Railway
in September of the following year, but the limited power from
batteries prevented its general use. It was destroyed by railway
workers, who saw it as a threat to their job security.
Lichterfelde tram, 1882
Werner von Siemens demonstrated an electric railway in 1879 in Berlin. The world's first electric tram line, Gross-Lichterfelde Tramway, opened in Lichterfelde near Berlin,
Germany, in 1881. It was built by Siemens. The tram ran on 180 Volt DC,
which was supplied by running rails. In 1891 the track was equipped
with an overhead wire and the line was extended to Berlin-Lichterfelde West station. The Volk's Electric Railway opened in 1883 in Brighton, England. The railway is still operational, thus making it the oldest operational electric railway in the world. Also in 1883, Mödling and Hinterbrühl Tram
opened near Vienna in Austria. It was the first tram line in the world
in regular service powered from an overhead line. Five years later, in
the U.S. electric trolleys were pioneered in 1888 on the Richmond Union Passenger Railway, using equipment designed by Frank J. Sprague.
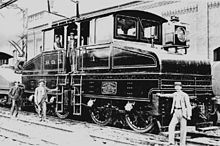
Baltimore & Ohio electric engine
The first use of electrification on a main line was on a four-mile section of the Baltimore Belt Line of the Baltimore and Ohio Railroad (B&O) in 1895 connecting the main portion of the B&O to the new line to New York
through a series of tunnels around the edges of Baltimore's downtown.
Electricity quickly became the power supply of choice for subways,
abetted by the Sprague's invention of multiple-unit train control in
1897. By the early 1900s most street railways were electrified.
Passengers wait to board a tube train on the London Underground in the early 1900s
The London Underground, the world's oldest underground railway, opened in 1863, and it began operating electric services using a fourth rail system in 1890 on the City and South London Railway, now part of the London Underground Northern line. This was the first major railway to use electric traction. The world's first deep-level electric railway, it runs from the City of London, under the River Thames, to Stockwell in south London.
The first practical AC electric locomotive was designed by Charles Brown, then working for Oerlikon, Zürich. In 1891, Brown had demonstrated long-distance power transmission, using three-phase AC, between a hydro-electric plant at Lauffen am Neckar and Frankfurt am Main West, a distance of 280 km. Using experience he had gained while working for Jean Heilmann on steam-electric locomotive designs, Brown observed that three-phase motors had a higher power-to-weight ratio than DC motors and, because of the absence of a commutator, were simpler to manufacture and maintain. However, they were much larger than the DC motors of the time and could not be mounted in underfloor bogies: they could only be carried within locomotive bodies.
In 1894, Hungarian engineer Kálmán Kandó
developed a new type 3-phase asynchronous electric drive motors and
generators for electric locomotives. Kandó's early 1894 designs were
first applied in a short three-phase AC tramway in Evian-les-Bains
(France), which was constructed between 1896 and 1898.
In 1896, Oerlikon installed the first commercial example of the system on the Lugano Tramway.
Each 30-tonne locomotive had two 110 kW (150 hp) motors run by
three-phase 750 V 40 Hz fed from double overhead lines. Three-phase
motors run at constant speed and provide regenerative braking,
and are well suited to steeply graded routes, and the first main-line
three-phase locomotives were supplied by Brown (by then in partnership
with Walter Boveri) in 1899 on the 40 km Burgdorf–Thun line, Switzerland.
A prototype of a Ganz AC electric locomotive in Valtellina, Italy, 1901
Italian railways were the first in the world to introduce electric
traction for the entire length of a main line rather than a short
section. The 106 km Valtellina line was opened on 4 September 1902, designed by Kandó and a team from the Ganz works. The electrical system was three-phase at 3 kV 15 Hz. In 1918, Kandó invented and developed the rotary phase converter,
enabling electric locomotives to use three-phase motors whilst supplied
via a single overhead wire, carrying the simple industrial frequency
(50 Hz) single phase AC of the high voltage national networks.
An important contribution to the wider adoption of AC traction
came from SNCF of France after World War II. The company conducted
trials at AC 50 HZ, and established it as a standard. Following SNCF's
successful trials, 50 HZ, now also called industrial frequency was
adopted as standard for main-lines across the world.
Diesel power introduced
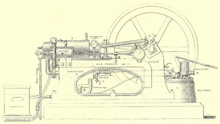
Diagram of Priestman Oil Engine from The Steam engine and gas and oil engines (1900) by John Perry
Earliest recorded examples of an internal combustion engine for railway use included a prototype designed by William Dent Priestman, which was examined by Sir William Thomson in 1888 who described it as a "[Priestman
oil engine] mounted upon a truck which is worked on a temporary line of
rails to show the adaptation of a petroleum engine for locomotive
purposes.". In 1894, a 20 hp (15 kW) two axle machine built by Priestman Brothers was used on the Hull Docks.
In 1906, Rudolf Diesel, Adolf Klose and the steam and diesel engine manufacturer Gebrüder Sulzer
founded Diesel-Sulzer-Klose GmbH to manufacture diesel-powered
locomotives. Sulzer had been manufacturing diesel engines since 1898.
The Prussian State Railways ordered a diesel locomotive from the company
in 1909. The world's first diesel-powered locomotive was operated in
the summer of 1912 on the Winterthur–Romanshorn railway in Switzerland, but was not a commercial success. The locomotive weight was 95 tonnes and the power was 883 kW with a maximum speed of 100 km/h. Small numbers of prototype diesel locomotives were produced in a number of countries through the mid-1920s.
A significant breakthrough occurred in 1914, when Hermann Lemp, a General Electric electrical engineer, developed and patented a reliable direct current electrical control system (subsequent improvements were also patented by Lemp). Lemp's design used a single lever to control both engine and generator in a coordinated fashion, and was the prototype for all diesel–electric locomotive control systems. In 1914, world's first functional diesel–electric railcars were produced for the Königlich-Sächsische Staatseisenbahnen (Royal Saxon State Railways) by Waggonfabrik Rastatt with electric equipment from Brown, Boveri & Cie and diesel engines from Swiss Sulzer AG. They were classified as DET 1 and DET 2 (de.wiki). The first regular use of diesel–electric locomotives was in switching (shunter) applications. General Electric produced several small switching locomotives in the 1930s (the famous "44-tonner"
switcher was introduced in 1940) Westinghouse Electric and Baldwin
collaborated to build switching locomotives starting in 1929.
In 1929, the Canadian National Railways became the first North American railway to use diesels in mainline service with two units, 9000 and 9001, from Westinghouse.
High-speed rail
Although high-speed steam and diesel services were started before the 1960s in Europe, they were not very successful.
0-Series Shinkansen, introduced in 1964, triggered the intercity train travel boom.
The first electrified high-speed rail Tōkaidō Shinkansen was introduced in 1964 between Tokyo and Osaka in Japan. Since then high-speed rail
transport, functioning at speeds up to and above 300 km/h, has been
built in Japan, Spain, France, Germany, Italy, the People's Republic of
China, Taiwan (Republic of China), the United Kingdom, South Korea, Scandinavia, Belgium and the Netherlands.
The construction of many of these lines has resulted in the dramatic
decline of short haul flights and automotive traffic between connected
cities, such as the London–Paris–Brussels corridor, Madrid–Barcelona,
Milan–Rome–Naples, as well as many other major lines.
High-speed trains normally operate on standard gauge tracks of continuously welded rail on grade-separated right-of-way that incorporates a large turning radius
in its design. While high-speed rail is most often designed for
passenger travel, some high-speed systems also offer freight service.
Trains
A train is a connected series of rail vehicles that move along the
track. Propulsion for the train is provided by a separate locomotive or
from individual motors in self-propelled multiple units. Most trains
carry a revenue load, although non-revenue cars exist for the railway's
own use, such as for maintenance-of-way purposes. The engine driver (engineer in North America) controls the locomotive or other power cars, although people movers and some rapid transits are under automatic control.
Haulage
Russian 2TE10U Diesel-electric locomotive
Traditionally, trains are pulled using a locomotive. This involves
one or more powered vehicles being located at the front of the train,
providing sufficient tractive force
to haul the weight of the full train. This arrangement remains dominant
for freight trains and is often used for passenger trains. A push–pull train
has the end passenger car equipped with a driver's cab so that the
engine driver can remotely control the locomotive. This allows one of
the locomotive-hauled train's drawbacks to be removed, since the
locomotive need not be moved to the front of the train each time the
train changes direction. A railroad car is a vehicle used for the haulage of either passengers or freight.
A multiple unit has powered wheels throughout the whole train.
These are used for rapid transit and tram systems, as well as many both
short- and long-haul passenger trains. A railcar is a single, self-powered car, and may be electrically-propelled or powered by a diesel engine. Multiple units have a driver's cab at each end of the unit, and were developed following the ability to build electric motors and engines small enough to fit under the coach. There are only a few freight multiple units, most of which are high-speed post trains.
Motive power
A RegioSwinger multiple unit of the Croatian Railways
Steam locomotives are locomotives with a steam engine that provides adhesion. Coal, petroleum, or wood is burned in a firebox, boiling water in the boiler to create pressurized steam. The steam travels through the smokebox before leaving via the chimney or smoke stack. In the process, it powers a piston that transmits power directly through a connecting rod (US: main rod) and a crankpin (US: wristpin) on the driving wheel (US main driver) or to a crank
on a driving axle. Steam locomotives have been phased out in most parts
of the world for economical and safety reasons, although many are
preserved in working order by heritage railways.
Electric locomotives draw power from a stationary source via an overhead wire or third rail. Some also or instead use a battery. In locomotives that are powered by high voltage alternating current, a transformer in the locomotive converts the high voltage, low current power to low voltage, high current used in the traction motors that power the wheels. Modern locomotives may use three-phase AC induction motors or direct current motors. Under certain conditions, electric locomotives are the most powerful traction. They are also the cheapest to run and provide less noise and no local air pollution. However, they require high capital investments both for the overhead lines
and the supporting infrastructure, as well as the generating station
that is needed to produce electricity. Accordingly, electric traction is
used on urban systems, lines with high traffic and for high-speed rail.
Diesel locomotives use a diesel engine as the prime mover. The energy transmission may be either diesel-electric, diesel-mechanical or diesel-hydraulic but diesel-electric is dominant. Electro-diesel locomotives are built to run as diesel-electric on unelectrified sections and as electric locomotives on electrified sections.
Alternative methods of motive power include magnetic levitation, horse-drawn, cable, gravity, pneumatics and gas turbine.
Passenger trains
Interior view of the top deck of a VR InterCity2 double-deck carriage
A
passenger train travels between stations where passengers may embark
and disembark. The oversight of the train is the duty of a guard/train manager/conductor.
Passenger trains are part of public transport and often make up the
stem of the service, with buses feeding to stations. Passenger trains
provide long-distance intercity travel, daily commuter trips, or local
urban transit services. They even include a diversity of vehicles,
operating speeds, right-of-way requirements, and service frequency.
Passenger trains usually can be divided into two operations: intercity
railway and intracity transit. Whereas as intercity railway involve
higher speeds, longer routes, and lower frequency (usually scheduled),
intracity transit involves lower speeds, shorter routes, and higher
frequency (especially during peak hours).
Intercity trains are long-haul trains that operate with few stops between cities. Trains typically have amenities such as a dining car. Some lines also provide over-night services with sleeping cars. Some long-haul trains have been given a specific name. Regional trains
are medium distance trains that connect cities with outlying,
surrounding areas, or provide a regional service, making more stops and
having lower speeds. Commuter trains serve suburbs of urban areas, providing a daily commuting service. Airport rail links provide quick access from city centers to airports.
High-speed rail
are special inter-city trains that operate at much higher speeds than
conventional railways, the limit being regarded at 200 to 320 kilometers
per hour (120 to 200 mph). High-speed trains are used mostly for
long-haul service and most systems are in Western Europe and East Asia.
The speed record is 574.8 km/h (357.2 mph), set by a modified French TGV. Magnetic levitation
trains such as the Shanghai airport train use under-riding magnets
which attract themselves upward towards the underside of a guideway and
this line has achieved somewhat higher peak speeds in day-to-day
operation than conventional high-speed railways, although only over
short distances. Due to their heightened speeds, route alignments for
high-speed rail tend to have shallower grades and broader curves than
conventional railways.
Their high kinetic energy translates to higher horsepower-to-ton ratios
(e.g. 20 horsepower per short ton or 16 kilowatts per tonne); this
allows trains to accelerate and maintain higher speeds and negotiate
steep grades as momentum builds up and recovered in downgrades (reducing
cut, fill, and tunnelling requirements). Since lateral forces act on
curves, curvatures are designed with the highest possible radius. All
these features are dramatically different from freight operations, thus
justifying exclusive high-speed rail lines if it is economically
feasible.
Rail network in Paris, France
Higher-speed rail
services are intercity rail services that have top speeds higher than
conventional intercity trains but the speeds are not as high as those in
the high-speed rail services. These services are provided after
improvements to the conventional rail infrastructure in order to support
trains that can operate safely at higher speeds.
Rapid transit
is an intracity system built in large cities and has the highest
capacity of any passenger transport system. It is usually
grade-separated and commonly built underground or elevated. At street
level, smaller trams can be used. Light rails are upgraded trams that have step-free access, their own right-of-way and sometimes sections underground. Monorail systems are elevated, medium-capacity systems. A people mover
is a driverless, grade-separated train that serves only a few stations,
as a shuttle. Due to the lack of uniformity of rapid transit systems,
route alignment varies, with diverse rights-of-way (private land, side
of road, street median) and geometric characteristics (sharp or broad curves, steep or gentle grades). For instance, the Chicago 'L' trains are designed with extremely short cars to negotiate the sharp curves in the Loop. New Jersey's PATH has similar-sized cars to accommodate curves in the trans-Hudson tunnels. San Francisco's BART operates large cars on its well-engineered routes.
Freight train
Bulk cargo of minerals
A freight train hauls cargo using freight cars
specialized for the type of goods. Freight trains are very efficient,
with economy of scale and high energy efficiency. However, their use can
be reduced by lack of flexibility, if there is need of transshipment at
both ends of the trip due to lack of tracks to the points of pick-up
and delivery. Authorities often encourage the use of cargo rail
transport due to its fame.
Container trains
have become the beta type in the US for bulk haulage. Containers can
easily be transshipped to other modes, such as ships and trucks, using
cranes. This has succeeded the boxcar (wagon-load), where the cargo had to be loaded and unloaded into the train manually. The intermodal containerization of cargo has revolutionized the supply chain logistics industry, reducing ship costs significantly. In Europe, the sliding wall wagon has largely superseded the ordinary covered wagons. Other types of cars include refrigerator cars, stock cars for livestock and autoracks for road vehicles. When rail is combined with road transport, a roadrailer will allow trailers to be driven onto the train, allowing for easy transition between road and rail.
Bulk handling
represents a key advantage for rail transport. Low or even zero
transshipment costs combined with energy efficiency and low inventory
costs allow trains to handle bulk much cheaper than by road. Typical bulk cargo includes coal, ore, grains and liquids. Bulk is transported in open-topped cars, hopper cars and tank cars.
Infrastructure
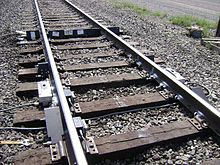
Top: Railway turnouts; Right: Chicago Transit Authority control tower 18 guides elevated Chicago 'L' north and southbound Purple and Brown lines intersecting with east and westbound Pink and Green lines and the looping Orange line above the Wells and Lake street intersection in the loop at an elevated right of way.
Right of way
Railway
tracks are laid upon land owned or leased by the railway company. Owing
to the desirability of maintaining modest grades, rails will often be
laid in circuitous routes in hilly or mountainous terrain. Route length
and grade requirements can be reduced by the use of alternating cuttings,
bridges and tunnels – all of which can greatly increase the capital
expenditures required to develop a right of way, while significantly
reducing operating costs and allowing higher speeds on longer radius
curves. In densely urbanized areas, railways are sometimes laid in
tunnels to minimize the effects on existing properties.
Track
Map of railways in Europe with main operational lines shown in black, heritage railway lines in green and former routes in light blue
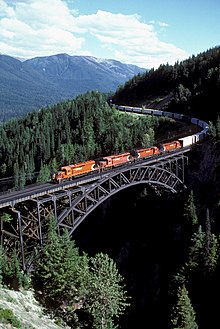
Long freight train crossing the Stoney Creek viaduct on the Canadian Pacific Railway in southern British Columbia
Track consists of two parallel steel rails, anchored perpendicular to members called ties (sleepers) of timber, concrete, steel, or plastic to maintain a consistent distance apart, or rail gauge. Rail gauges are usually categorized as standard gauge (used on approximately 55% of the world's existing railway lines), broad gauge, and narrow gauge. In addition to the rail gauge, the tracks will be laid to conform with a Loading gauge
which defines the maximum height and width for railway vehicles and
their loads to ensure safe passage through bridges, tunnels and other
structures.
The track guides the conical, flanged wheels, keeping the cars on
the track without active steering and therefore allowing trains to be
much longer than road vehicles. The rails and ties are usually placed on
a foundation made of compressed earth on top of which is placed a bed
of ballast to distribute the load from the ties and to prevent the track from buckling as the ground settles over time under the weight of the vehicles passing above.
The ballast also serves as a means of drainage. Some more modern track in special areas is attached by direct fixation without ballast. Track may be prefabricated or assembled in place. By welding rails together to form lengths of continuous welded rail,
additional wear and tear on rolling stock caused by the small surface
gap at the joints between rails can be counteracted; this also makes for
a quieter ride.
On curves the outer rail may be at a higher level than the inner rail. This is called superelevation or cant.
This reduces the forces tending to displace the track and makes for a
more comfortable ride for standing livestock and standing or seated
passengers. A given amount of superelevation is most effective over a
limited range of speeds.
Turnouts,
also known as points and switches, are the means of directing a train
onto a diverging section of track. Laid similar to normal track, a point
typically consists of a frog
(common crossing), check rails and two switch rails. The switch rails
may be moved left or right, under the control of the signalling system,
to determine which path the train will follow.
Spikes in wooden ties can loosen over time, but split and rotten
ties may be individually replaced with new wooden ties or concrete
substitutes. Concrete ties can also develop cracks or splits, and can
also be replaced individually. Should the rails settle due to soil
subsidence, they can be lifted by specialized machinery and additional
ballast tamped under the ties to level the rails.
Periodically, ballast must be removed and replaced with clean
ballast to ensure adequate drainage. Culverts and other passages for
water must be kept clear lest water is impounded by the trackbed,
causing landslips. Where trackbeds are placed along rivers, additional
protection is usually placed to prevent streambank erosion during times
of high water. Bridges require inspection and maintenance, since they
are subject to large surges of stress in a short period of time when a
heavy train crosses.
Train inspection systems
A Hot bearing detector w/ dragging equipment unit
The inspection of railway equipment is essential for the safe movement of trains. Many types of defect detectors are in use on the world's railroads. These devices utilize technologies that vary from a simplistic paddle and switch to infrared and laser scanning, and even ultrasonic audio analysis. Their use has avoided many rail accidents over the 70 years they have been used.
Signalling
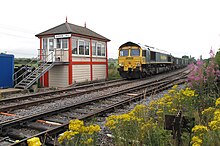
Bardon Hill box in England is a Midland Railway box dating from 1899, although the original mechanical lever frame has been replaced by electrical switches. Seen here in 2009.
Railway signalling is a system used to control railway traffic safely to prevent trains from colliding. Being guided by fixed rails
which generate low friction, trains are uniquely susceptible to
collision since they frequently operate at speeds that do not enable
them to stop quickly or within the driver's sighting distance; road
vehicles, which encounter a higher level of friction between their
rubber tyres and the road surface, have much shorter braking distances.
Most forms of train control involve movement authority being passed from
those responsible for each section of a rail network to the train crew.
Not all methods require the use of signals, and some systems are
specific to single track railways.
The signalling process is traditionally carried out in a signal box, a small building that houses the lever frame
required for the signalman to operate switches and signal equipment.
These are placed at various intervals along the route of a railway,
controlling specified sections of track. More recent technological
developments have made such operational doctrine superfluous, with the
centralization of signalling operations to regional control rooms. This
has been facilitated by the increased use of computers, allowing vast
sections of track to be monitored from a single location. The common
method of block signalling
divides the track into zones guarded by combinations of block signals,
operating rules, and automatic-control devices so that only one train
may be in a block at any time.
Electrification
The electrification system provides electrical energy to the trains,
so they can operate without a prime mover on board. This allows lower
operating costs, but requires large capital investments along the lines.
Mainline and tram systems normally have overhead wires, which hang from
poles along the line. Grade-separated rapid transit sometimes use a
ground third rail.
Power may be fed as direct or alternating current.
The most common DC voltages are 600 and 750 V for tram and rapid
transit systems, and 1,500 and 3,000 V for mainlines. The two dominant
AC systems are 15 kV AC and 25 kV AC.
Stations
Goods station in Lucerne, Switzerland
A railway station serves as an area where passengers can board and alight from trains. A goods station
is a yard which is exclusively used for loading and unloading cargo.
Large passenger stations have at least one building providing
conveniences for passengers, such as purchasing tickets and food.
Smaller stations typically only consist of a platform. Early stations were sometimes built with both passenger and goods facilities.
Platforms are used to allow easy access to the trains, and are connected to each other via underpasses, footbridges and level crossings. Some large stations are built as culs-de-sac,
with trains only operating out from one direction. Smaller stations
normally serve local residential areas, and may have connection to
feeder bus services. Large stations, in particular central stations, serve as the main public transport hub for the city, and have transfer available between rail services, and to rapid transit, tram or bus services.
Operations
Ownership
In the United States, railroads such as the Union Pacific
traditionally own and operate both their rolling stock and
infrastructure, with the company itself typically being privately owned.
Since the 1980s, there has been an increasing trend to split up
railway companies, with companies owning the rolling stock separated
from those owning the infrastructure. This is particularly true in
Europe, where this arrangement is required by the European Union. This
has allowed open access by any train operator to any portion of the
European railway network. In the UK, the railway track is state owned,
with a public controlled body (Network Rail) running, maintaining and developing the track, while Train Operating Companies have run the trains since privatization in the 1990s.
In the U.S., virtually all rail networks and infrastructure outside the Northeast Corridor are privately owned by freight lines. Passenger lines, primarily Amtrak,
operate as tenants on the freight lines. Consequently, operations must
be closely synchronized and coordinated between freight and passenger
railroads, with passenger trains often being dispatched by the host
freight railroad. Due to this shared system, both are regulated by the Federal Railroad Administration (FRA) and may follow the AREMA recommended practices for track work and AAR standards for vehicles.
Financing
The main source of income for railway companies is from ticket
revenue (for passenger transport) and shipment fees for cargo.
Discounts and monthly passes are sometimes available for frequent
travellers (e.g. season ticket and rail pass).
Freight revenue may be sold per container slot or for a whole train.
Sometimes, the shipper owns the cars and only rents the haulage. For
passenger transport, advertisement income can be significant.
Governments may choose to give subsidies to rail operation, since rail transport has fewer externalities
than other dominant modes of transport. If the railway company is
state-owned, the state may simply provide direct subsidies in exchange
for increased production. If operations have been privatized, several
options are available. Some countries have a system where the
infrastructure is owned by a government agency or company – with open
access to the tracks for any company that meets safety requirements. In
such cases, the state may choose to provide the tracks free of charge,
or for a fee that does not cover all costs. This is seen as analogous to
the government providing free access to roads. For passenger
operations, a direct subsidy may be paid to a public-owned operator, or public service obligation tender may be helt, and a time-limited contract awarded to the lowest bidder. Total EU rail subsidies amounted to €73 billion in 2005.
Amtrak, the US passenger rail service, and Canada's Via Rail
are private railroad companies chartered by their respective national
governments. As private passenger services declined because of
competition from automobiles and airlines, they became shareholders
of Amtrak either with a cash entrance fee or relinquishing their
locomotives and rolling stock. The government subsidizes Amtrak by
supplying start-up capital and making up for losses at the end of the fiscal year.
Safety
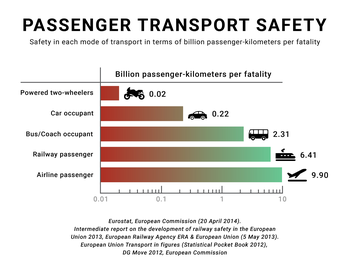
According to Eurostat and European Railway Agency,
on European railways, there is a fatality risk for passengers and
occupants 28 times lower compared with car usage. Based on data by EU-27
member nations, 2008–2010.
Trains can travel at very high speed, but they are heavy, are unable
to deviate from the track and require a great distance to stop. Possible
accidents include derailment (jumping the track), a collision with another train or collision with automobiles, other vehicles or pedestrians at level crossings.
The last accounts for the majority of rail accidents and casualties.
The most important safety measures to prevent accidents are strict
operating rules, e.g. railway signalling and gates or grade separation at crossings. Train whistles, bells or horns warn of the presence of a train, while trackside signals maintain the distances between trains.
An important element in the safety of many high-speed inter-city networks such as Japan's Shinkansen
is the fact that trains only run on dedicated railway lines, without
level crossings. This effectively eliminates the potential for collision
with automobiles, other vehicles or pedestrians, vastly reduces the
likelihood of collision with other trains and helps ensure services
remain timely.
Maintenance
As in any infrastructure
asset, railways must keep up with periodic inspection and maintenance
in order to minimize effect of infrastructure failures that can disrupt
freight revenue operations and passenger services. Because passengers
are considered the most crucial cargo and usually operate at
higher speeds, steeper grades, and higher capacity/frequency, their
lines are especially important. Inspection practices include track geometry cars
or walking inspection. Curve maintenance especially for transit
services includes gauging, fastener tightening, and rail replacement.
Rail corrugation is a common issue with transit systems due to
the high number of light-axle, wheel passages which result in grinding
of the wheel/rail interface. Since maintenance may overlap with
operations, maintenance windows (nighttime hours, off-peak
hours, altering train schedules or routes) must be closely followed. In
addition, passenger safety during maintenance work (inter-track
fencing, proper storage of materials, track work notices, hazards of
equipment near states) must be regarded at all times. At times,
maintenance access problems can emerge due to tunnels, elevated
structures, and congested cityscapes. Here, specialized equipment or
smaller versions of conventional maintenance gear are used.
Unlike highways or road networks
where capacity is disaggregated into unlinked trips over individual
route segments, railway capacity is fundamentally considered a network
system. As a result, many components are causes and effects of system
disruptions. Maintenance must acknowledge the vast array of a route's
performance (type of train service, origination/destination, seasonal
impacts), line's capacity (length, terrain, number of tracks, types of
train control), trains throughput (max speeds, acceleration/deceleration
rates), and service features with shared passenger-freight tracks
(sidings, terminal capacities, switching routes, and design type).
Social, economical, and energetic aspects
Energy
BNSF Railway freight service in the United States
German InterCityExpress (ICE)
Rail transport is an energy-efficient but capital-intensive
means of mechanized land transport. The tracks provide smooth and hard
surfaces on which the wheels of the train can roll with a relatively low
level of friction being generated. Moving a vehicle on and/or through a
medium (land, sea, or air) requires that it overcomes resistance to its
motion caused by friction. A land vehicle's total resistance (in pounds or Newtons) is a quadratic function of the vehicle's speed:
where:
- R denotes total resistance
- a denotes initial constant resistance
- b denotes velocity-related constant
- c denotes constant that is function of shape, frontal area, and sides of vehicle
- v denotes velocity
- v2 denotes velocity, squared
Essentially, resistance differs between vehicle's contact point and
surface of roadway. Metal wheels on metal rails have a significant
advantage of overcoming resistance compared to rubber-tyred wheels on
any road surface (railway – 0.001g at 10 miles per hour (16 km/h) and
0.024g at 60 miles per hour (97 km/h); truck – 0.009g at 10 miles per
hour (16 km/h) and 0.090 at 60 miles per hour (97 km/h)). In terms of
cargo capacity combining speed and size being moved in a day:
- human – can carry 100 pounds (45 kg) for 20 miles (32 km) per day, or 1 tmi/day (1.5 tkm/day)
- horse and wheelbarrow – can carry 4 tmi/day (5.8 tkm/day)
- horse cart on good pavement – can carry 10 tmi/day (14 tkm/day)
- fully utility truck – can carry 20,000 tmi/day (29,000 tkm/day)
- long-haul train – can carry 500,000 tmi/day (730,000 tkm/day) Most trains take 250–400 trucks off the road, thus making the road more safe.
In terms of the horsepower to weight ratio, a slow-moving barge
requires 0.2 horsepower per short ton (0.16 kW/t), a railway and
pipeline requires 2.5 horsepower per short ton (2.1 kW/t), and truck
requires 10 horsepower per short ton (8.2 kW/t). However, at higher
speeds, a railway overcomes the barge and proves most economical.
As an example, a typical modern wagon can hold up to 113 tonnes (125 short tons) of freight on two four-wheel bogies. The track distributes the weight of the train evenly, allowing significantly greater loads per axle
and wheel than in road transport, leading to less wear and tear on the
permanent way. This can save energy compared with other forms of
transport, such as road transport, which depends on the friction between
rubber tyres and the road. Trains have a small frontal area in relation
to the load they are carrying, which reduces air resistance and thus energy usage.
In addition, the presence of track guiding the wheels allows for
very long trains to be pulled by one or a few engines and driven by a
single operator, even around curves, which allows for economies of scale in both manpower and energy use; by contrast, in road transport, more than two articulations causes fishtailing and makes the vehicle unsafe.
Energy efficiency
Considering only the energy spent to move the means of transport, and using the example of the urban area of Lisbon,
electric trains seem to be on average 20 times more efficient than
automobiles for transportation of passengers, if we consider energy
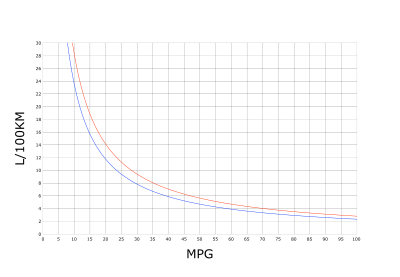
spent per passenger-distance with similar occupation ratios. Considering an automobile with a consumption of around 6 l/100 km (47 mpg‑imp; 39 mpg‑US)
of fuel, the average car in Europe has an occupancy of around 1.2
passengers per automobile (occupation ratio around 24%) and that one liter of fuel
amounts to about 8.8 kWh (32 MJ), equating to an average of 441 Wh
(1,590 kJ) per passenger-km. This compares to a modern train with an
average occupancy of 20% and a consumption of about 8.5 kW⋅h/km
(31 MJ/km; 13.7 kW⋅h/mi), equating to 21.5 Wh (77 kJ) per passenger-km,
20 times less than the automobile.
Usage
Due to
these benefits, rail transport is a major form of passenger and freight
transport in many countries. It is ubiquitous in Europe, with an
integrated network covering virtually the whole continent. In India,
China, South Korea and Japan, many millions use trains as regular
transport. In North America, freight rail transport is widespread and
heavily used, but intercity passenger rail transport is relatively
scarce outside the Northeast Corridor, due to increased preference of other modes, particularly automobiles and airplanes.
South Africa, northern Africa and Argentina have extensive rail
networks, but some railways elsewhere in Africa and South America are
isolated lines. Australia has a generally sparse network befitting its
population density but has some areas with significant networks,
especially in the southeast. In addition to the previously existing
east-west transcontinental line in Australia, a line from north to south
has been constructed. The highest railway in the world is the line to Lhasa, in Tibet,
partly running over permafrost territory. Western Europe has the
highest railway density in the world and many individual trains there
operate through several countries despite technical and organizational
differences in each national network.
Social and economic benefits
Modernization
Railways are central to the formation of modernity and ideas of progress.
The process of modernization in the 19th century involved a transition
from a spatially oriented world to a time oriented world. Exact time was
essential, and everyone had to know what the time was, resulting in
clocks towers for railway stations, clocks in public places, pocket
watches for railway workers and for travelers. Trains left on time
(they never left early). By contrast, in the premodern era, passenger
ships left when the captain had enough passengers. In the premodern era,
local time was set at noon, when the sun was at its highest. Every
place east to west had a different time and that changed with the
introduction of standard time zones. Printed time tables were a
convenience for the travelers, but more elaborate time tables, called train orders,
were even more essential for the train crews, the maintenance workers,
the station personnel, and for the repair and maintenance crews, who
knew when to expect a train would come along. Most track was single
track, with sidings and signals to allow lower priority trains to be
sidetracked. Schedules told everyone what to do, where to be, and
exactly when. If bad weather disrupted the system, telegraphers relayed
immediate corrections and updates throughout the system. Just as
railways as business organizations created the standards and models for
modern big business, so too the railway timetable was adapted to myriad
uses, such as schedules for buses ferries, and airplanes, for radio and
television programs, for school schedules, for factory time clocks. The
modern world was ruled by the clock and the timetable.
Model of corporate management
According to historian Henry Adams the system of railroads needed:
- ...the energies of a generation, for it required all the new machinery to be created – capital, banks, mines, furnaces, shops, power-houses, technical knowledge, mechanical population, together with a steady remodelling of social and political habits, ideas, and institutions to fit the new scale and suit the new conditions. The generation between 1865 and 1895 was already mortgaged to the railways, and no one knew it better than the generation itself.
The impact can be examined through five aspects: shipping, finance, management, careers, and popular reaction.
Shipping freight and passengers
First
they provided a highly efficient network for shipping freight and
passengers across a large national market. The result was a transforming
impact on most sectors of the economy including manufacturing, retail
and wholesale, agriculture, and finance. The United States now had an
integrated national market practically the size of Europe, with no
internal barriers or tariffs, all supported by a common language, and
financial system and a common legal system.
Basis of the private financial system
Railroads
financing provided the basis for a dramatic expansion of the private
(non-governmental) financial system. Construction of railroads was far
more expensive than factories. In 1860, the combined total of railroad
stocks and bonds was $1.8 billion; 1897 it reached $10.6 billion
(compared to a total national debt of $1.2 billion).
Funding came from financiers throughout the Northeast, and from Europe, especially Britain.
About 10 percent of the funding came from the government, especially in
the form of land grants that could be realized when a certain amount of
trackage was opened.
The emerging American financial system was based on railroad bonds. New
York by 1860 was the dominant financial market. The British invested
heavily in railroads around the world, but nowhere more so than the
United States; The total came to about $3 billion by 1914. In 1914–1917,
they liquidated their American assets to pay for war supplies.
Inventing modern management
Railroad
management designed complex systems that could handle far more
complicated simultaneous relationships than could be dreamed of by the
local factory owner who could patrol every part of his own factory in a
matter of hours. Civil engineers became the senior management of
railroads. The leading American innovators were the Western Railroad of
Massachusetts and the Baltimore and Ohio Railroad in the 1840s, the Erie
in the 1850s and the Pennsylvania in the 1860s.
Career paths
The
railroads invented the career path in the private sector for both
blue-collar workers and white-collar workers. Railroading became a
lifetime career for young men; women were almost never hired. A typical
career path would see a young man hired at age 18 as a shop laborer, be
promoted to skilled mechanic at age 24, brakemen at 25, freight
conductor at 27, and passenger conductor at age 57. White-collar careers
paths likewise were delineated. Educated young men started in clerical
or statistical work and moved up to station agents or bureaucrats at the
divisional or central headquarters. At each level they had more and
more knowledge, experience, and human capital.
They were very hard to replace, and were virtually guaranteed permanent
jobs and provided with insurance and medical care. Hiring, firing, and
wage rates were set not by foremen, but by central administrators, in
order to minimize favoritism and personality conflicts. Everything was
done by the book, whereby an increasingly complex set of rules dictated
to everyone exactly what should be done in every circumstance, and
exactly what their rank and pay would be. By the 1880s the career
railroaders were retiring, and pension systems were invented for them.
Transportation
Railways contribute to social vibrancy and economic competitiveness by transporting multitudes of customers and workers to city centers and inner suburbs. Hong Kong has recognized rail as "the backbone of the public transit system" and as such developed their franchised bus system and road infrastructure in comprehensive alignment with their rail services. China's large cities such as Beijing, Shanghai, and Guangzhou recognize rail transit lines as the framework and bus lines as the main body to their metropolitan transportation systems. The Japanese Shinkansen was built to meet the growing traffic demand in the "heart of Japan's industry and economy" situated on the Tokyo-Kobe line.
German soldiers in a railway car on the way to the front in August 1914. The message on the car reads Von München über Metz nach Paris. (From Munich via Metz to Paris).
During much of the 20th century, rail was an invaluable element of military mobilization,
allowing for the quick and efficient transport of large numbers of
reservists to their mustering-points, and infantry soldiers to the front
lines. However, by the 21st century, rail transport – limited to
locations on the same continent, and vulnerable to air attack – had
largely been displaced by the adoption of aerial transport.
Negative impacts
Railways channel growth towards dense city agglomerations and along their arteries, as opposed to highway expansion, indicative of the U.S. transportation policy, which encourages development of suburbs at the periphery, contributing to increased vehicle miles traveled, carbon emissions, development of greenfield spaces, and depletion of natural reserves. These arrangements revalue city spaces, local taxes, housing values, and promotion of mixed use development.
The construction of the first railway of the Austro-Hungarian
empire, from Vienna to Prague, came in 1837-1842 to promises of new
prosperity. Construction proved more costly than anticipated, and it
brought in less revenue because local industry did not have a national
market. In town after town the arrival of railway angered the locals
because of the noise, smell, and pollution caused by the trains and the
damage to homes and the surrounding land caused by the engine's soot and
fiery embers. Almost all travel was local; ordinary people seldom had
need of passenger trains.
Pollution
A
2018 study found that the opening of the Beijing Metro caused a
reduction in "most of the air pollutants concentrations (PM2.5, PM10,
SO2, NO2, and CO) but had little effect on ozone pollution."
Modern rail as economic development indicator
European development economists
have argued that the existence of modern rail infrastructure is a
significant indicator of a country's economic advancement: this
perspective is illustrated notably through the Basic Rail Transportation Infrastructure Index (known as BRTI Index).
Subsidies
Asia
China
In
2014, total rail spending by China was $130 billion and is likely to
remain at a similar rate for the rest of the country's next Five Year
Period (2016–2020).
India
The Indian railways are subsidized by around ₹400 billion (US$5.6 billion), of which around 60% goes to commuter rail and short-haul trips. It is the fourth largest railway network in the world
comprising 119,630 kilometers (74,330 miles) of total track and
92,081 km (57,216 mi) of running track over a route of 66,687 km
(41,437 mi) with 7,216 stations at the end of 2015–16.
Europe
According to the 2017 European Railway Performance Index for
intensity of use, quality of service and safety performance, the top
tier European national rail systems consists of Switzerland, Denmark,
Finland, Germany, Austria, Sweden, and France.
Performance levels reveal a positive correlation between public cost
and a given railway system’s performance, and also reveal differences in
the value that countries receive in return for their public cost.
Denmark, Finland, France, Germany, the Netherlands, Sweden, and
Switzerland capture relatively high value for their money, while
Luxembourg, Belgium, Latvia, Slovakia, Portugal, Romania, and Bulgaria
underperform relative to the average ratio of performance to cost among
European countries.
European rail subsidies in euros per passenger-km for 2008
| Country | Subsidy (billions of Euros) | Year |
|---|---|---|
| 17.0 | 2014 | |
| 13.2 | 2013 | |
| 8.1 | 2009 | |
| 5.8 | 2012 | |
| 5.1 | 2015 | |
| 4.5 | 2015 | |
| 3.4 | 2008 | |
| 2.5 | 2014 | |
| 2.3 | 2009 | |
| 1.7 | 2008 | |
| 1.6 | 2009 | |
| 1.4 | 2008 | |
| 0.91 | 2008 |
Russia
In 2016 Russian Railways received 94.9 billion rubles (around US$1.4 billion) from the government.
North America
United States
Current subsidies for Amtrak (passenger rail) are around $1.4 billion. The rail freight industry does not receive subsidies.


