Search This Blog

Tuesday, March 5, 2019

Weather

From Wikipedia, the free encyclopedia

Thunderstorm near Garajau, Madeira
 
Weather is the state of the atmosphere, describing for example the degree to which it is hot or cold, wet or dry, calm or stormy, clear or cloudy. Most weather phenomena occur in the lowest level of the atmosphere, the troposphere, just below the stratosphere. Weather refers to day-to-day temperature and precipitation activity, whereas climate is the term for the averaging of atmospheric conditions over longer periods of time. When used without qualification, "weather" is generally understood to mean the weather of Earth.

Weather is driven by air pressure, temperature and moisture differences between one place and another. These differences can occur due to the sun's angle at any particular spot, which varies with latitude. The strong temperature contrast between polar and tropical air gives rise to the largest scale atmospheric circulations: the Hadley Cell, the Ferrel Cell, the Polar Cell, and the jet stream. Weather systems in the mid-latitudes, such as extratropical cyclones, are caused by instabilities of the jet stream flow. Because the Earth's axis is tilted relative to its orbital plane, sunlight is incident at different angles at different times of the year. On Earth's surface, temperatures usually range ±40 °C (−40 °F to 100 °F) annually. Over thousands of years, changes in Earth's orbit can affect the amount and distribution of solar energy received by the Earth, thus influencing long-term climate and global climate change

Surface temperature differences in turn cause pressure differences. Higher altitudes are cooler than lower altitudes, as most atmospheric heating is due to contact with the Earth's surface while radiative losses to space are mostly constant. Weather forecasting is the application of science and technology to predict the state of the atmosphere for a future time and a given location. The Earth's weather system is a chaotic system; as a result, small changes to one part of the system can grow to have large effects on the system as a whole. Human attempts to control the weather have occurred throughout history, and there is evidence that human activities such as agriculture and industry have modified weather patterns. 

Studying how the weather works on other planets has been helpful in understanding how weather works on Earth. A famous landmark in the Solar System, Jupiter's Great Red Spot, is an anticyclonic storm known to have existed for at least 300 years. However, weather is not limited to planetary bodies. A star's corona is constantly being lost to space, creating what is essentially a very thin atmosphere throughout the Solar System. The movement of mass ejected from the Sun is known as the solar wind.

Causes

Cumulus mediocris cloud surrounded by stratocumulus
 
On Earth, the common weather phenomena include wind, cloud, rain, snow, fog and dust storms. Less common events include natural disasters such as tornadoes, hurricanes, typhoons and ice storms. Almost all familiar weather phenomena occur in the troposphere (the lower part of the atmosphere). Weather does occur in the stratosphere and can affect weather lower down in the troposphere, but the exact mechanisms are poorly understood.

Weather occurs primarily due to air pressure, temperature and moisture differences between one place to another. These differences can occur due to the sun angle at any particular spot, which varies by latitude from the tropics. In other words, the farther from the tropics one lies, the lower the sun angle is, which causes those locations to be cooler due the spread of the sunlight over a greater surface. The strong temperature contrast between polar and tropical air gives rise to the large scale atmospheric circulation cells and the jet stream. Weather systems in the mid-latitudes, such as extratropical cyclones, are caused by instabilities of the jet stream flow. Weather systems in the tropics, such as monsoons or organized thunderstorm systems, are caused by different processes.

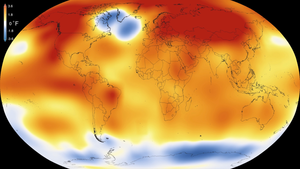
2015 – Warmest Global Year on Record (since 1880) – Colors indicate temperature anomalies (NASA/NOAA; 20 January 2016).
 
Because the Earth's axis is tilted relative to its orbital plane, sunlight is incident at different angles at different times of the year. In June the Northern Hemisphere is tilted towards the sun, so at any given Northern Hemisphere latitude sunlight falls more directly on that spot than in December. This effect causes seasons. Over thousands to hundreds of thousands of years, changes in Earth's orbital parameters affect the amount and distribution of solar energy received by the Earth and influence long-term climate.

The uneven solar heating (the formation of zones of temperature and moisture gradients, or frontogenesis) can also be due to the weather itself in the form of cloudiness and precipitation. Higher altitudes are typically cooler than lower altitudes, which the result of higher surface temperature and radiational heating, which produces the adiabatic lapse rate. In some situations, the temperature actually increases with height. This phenomenon is known as an inversion and can cause mountaintops to be warmer than the valleys below. Inversions can lead to the formation of fog and often act as a cap that suppresses thunderstorm development. On local scales, temperature differences can occur because different surfaces (such as oceans, forests, ice sheets, or man-made objects) have differing physical characteristics such as reflectivity, roughness, or moisture content. 

Surface temperature differences in turn cause pressure differences. A hot surface warms the air above it causing it to expand and lower the density and the resulting surface air pressure. The resulting horizontal pressure gradient moves the air from higher to lower pressure regions, creating a wind, and the Earth's rotation then causes deflection of this air flow due to the Coriolis effect. The simple systems thus formed can then display emergent behaviour to produce more complex systems and thus other weather phenomena. Large scale examples include the Hadley cell while a smaller scale example would be coastal breezes.

The atmosphere is a chaotic system. As a result, small changes to one part of the system can accumulate and magnify to cause large effects on the system as a whole. This atmospheric instability makes weather forecasting less predictable than tides or eclipses. Although it is difficult to accurately predict weather more than a few days in advance, weather forecasters are continually working to extend this limit through meteorological research and refining current methodologies in weather prediction. However, it is theoretically impossible to make useful day-to-day predictions more than about two weeks ahead, imposing an upper limit to potential for improved prediction skill.

Shaping the planet Earth

Weather is one of the fundamental processes that shape the Earth. The process of weathering breaks down the rocks and soils into smaller fragments and then into their constituent substances. During rains precipitation, the water droplets absorb and dissolve carbon dioxide from the surrounding air. This causes the rainwater to be slightly acidic, which aids the erosive properties of water. The released sediment and chemicals are then free to take part in chemical reactions that can affect the surface further (such as acid rain), and sodium and chloride ions (salt) deposited in the seas/oceans. The sediment may reform in time and by geological forces into other rocks and soils. In this way, weather plays a major role in erosion of the surface.

Effect on humans

Weather, seen from an anthropological perspective, is something all humans in the world constantly experience through their senses, at least while being outside. There are socially and scientifically constructed understandings of what weather is, what makes it change, the effect it has on humans in different situations, etc. Therefore, weather is something people often communicate about.

Effects on populations

New Orleans, Louisiana, after being struck by Hurricane Katrina. Katrina was a Category 3 hurricane when it struck although it had been a category 5 hurricane in the Gulf of Mexico.
 
Weather has played a large and sometimes direct part in human history. Aside from climatic changes that have caused the gradual drift of populations (for example the desertification of the Middle East, and the formation of land bridges during glacial periods), extreme weather events have caused smaller scale population movements and intruded directly in historical events. One such event is the saving of Japan from invasion by the Mongol fleet of Kublai Khan by the Kamikaze winds in 1281. French claims to Florida came to an end in 1565 when a hurricane destroyed the French fleet, allowing Spain to conquer Fort Caroline. More recently, Hurricane Katrina redistributed over one million people from the central Gulf coast elsewhere across the United States, becoming the largest diaspora in the history of the United States.

The Little Ice Age caused crop failures and famines in Europe. The 1690s saw the worst famine in France since the Middle Ages. Finland suffered a severe famine in 1696–1697, during which about one-third of the Finnish population died.

Forecasting

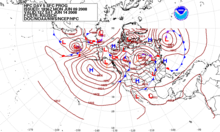
Forecast of surface pressures five days into the future for the north Pacific, North America, and north Atlantic Ocean as on 9 June 2008
 
Weather forecasting is the application of science and technology to predict the state of the atmosphere for a future time and a given location. Human beings have attempted to predict the weather informally for millennia, and formally since at least the nineteenth century. Weather forecasts are made by collecting quantitative data about the current state of the atmosphere and using scientific understanding of atmospheric processes to project how the atmosphere will evolve.

Once an all-human endeavor based mainly upon changes in barometric pressure, current weather conditions, and sky condition, forecast models are now used to determine future conditions. On the other hand, human input is still required to pick the best possible forecast model to base the forecast upon, which involve many disciplines such as pattern recognition skills, teleconnections, knowledge of model performance, and knowledge of model biases.

The chaotic nature of the atmosphere, the massive computational power required to solve the equations that describe the atmosphere, error involved in measuring the initial conditions, and an incomplete understanding of atmospheric processes mean that forecasts become less accurate as the difference in current time and the time for which the forecast is being made (the range of the forecast) increases. The use of ensembles and model consensus helps to narrow the error and pick the most likely outcome.

There are a variety of end users to weather forecasts. Weather warnings are important forecasts because they are used to protect life and property. Forecasts based on temperature and precipitation are important to agriculture, and therefore to commodity traders within stock markets. Temperature forecasts are used by utility companies to estimate demand over coming days.

In some areas, people use weather forecasts to determine what to wear on a given day. Since outdoor activities are severely curtailed by heavy rain, snow and the wind chill, forecasts can be used to plan activities around these events, and to plan ahead to survive through them.

Modification

The aspiration to control the weather is evident throughout human history: from ancient rituals intended to bring rain for crops to the U.S. Military Operation Popeye, an attempt to disrupt supply lines by lengthening the North Vietnamese monsoon. The most successful attempts at influencing weather involve cloud seeding; they include the fog- and low stratus dispersion techniques employed by major airports, techniques used to increase winter precipitation over mountains, and techniques to suppress hail. A recent example of weather control was China's preparation for the 2008 Summer Olympic Games. China shot 1,104 rain dispersal rockets from 21 sites in the city of Beijing in an effort to keep rain away from the opening ceremony of the games on 8 August 2008. Guo Hu, head of the Beijing Municipal Meteorological Bureau (BMB), confirmed the success of the operation with 100 millimeters falling in Baoding City of Hebei Province, to the southwest and Beijing's Fangshan District recording a rainfall of 25 millimeters.

Whereas there is inconclusive evidence for these techniques' efficacy, there is extensive evidence that human activity such as agriculture and industry results in inadvertent weather modification:
The effects of inadvertent weather modification may pose serious threats to many aspects of civilization, including ecosystems, natural resources, food and fiber production, economic development, and human health.

Microscale meteorology

Microscale meteorology is the study of short-lived atmospheric phenomena smaller than mesoscale, about 1 km or less. These two branches of meteorology are sometimes grouped together as "mesoscale and microscale meteorology" (MMM) and together study all phenomena smaller than synoptic scale; that is they study features generally too small to be depicted on a weather map. These include small and generally fleeting cloud "puffs" and other small cloud features.

Extremes on Earth

Early morning sunshine over Bratislava, Slovakia. February 2008.
 
The same area, just three hours later, after light snowfall
 
On Earth, temperatures usually range ±40 °C (100 °F to −40 °F) annually. The range of climates and latitudes across the planet can offer extremes of temperature outside this range. The coldest air temperature ever recorded on Earth is −89.2 °C (−128.6 °F), at Vostok Station, Antarctica on 21 July 1983. The hottest air temperature ever recorded was 57.7 °C (135.9 °F) at 'Aziziya, Libya, on 13 September 1922, but that reading is queried. The highest recorded average annual temperature was 34.4 °C (93.9 °F) at Dallol, Ethiopia. The coldest recorded average annual temperature was −55.1 °C (−67.2 °F) at Vostok Station, Antarctica.
 
The coldest average annual temperature in a permanently inhabited location is at Eureka, Nunavut, in Canada, where the annual average temperature is −19.7 °C (−3.5 °F).

Extraterrestrial within the Solar System

Jupiter's Great Red Spot in February 1979, photographed by the unmanned Voyager 1 NASA space probe.
 
Studying how the weather works on other planets has been seen as helpful in understanding how it works on Earth. Weather on other planets follows many of the same physical principles as weather on Earth, but occurs on different scales and in atmospheres having different chemical composition. The Cassini–Huygens mission to Titan discovered clouds formed from methane or ethane which deposit rain composed of liquid methane and other organic compounds. Earth's atmosphere includes six latitudinal circulation zones, three in each hemisphere. In contrast, Jupiter's banded appearance shows many such zones, Titan has a single jet stream near the 50th parallel north latitude, and Venus has a single jet near the equator.

One of the most famous landmarks in the Solar System, Jupiter's Great Red Spot, is an anticyclonic storm known to have existed for at least 300 years. On other gas giants, the lack of a surface allows the wind to reach enormous speeds: gusts of up to 600 metres per second (about 2,100 km/h or 1,300 mph) have been measured on the planet Neptune. This has created a puzzle for planetary scientists. The weather is ultimately created by solar energy and the amount of energy received by Neptune is only about ​1900 of that received by Earth, yet the intensity of weather phenomena on Neptune is far greater than on Earth. The strongest planetary winds discovered so far are on the extrasolar planet HD 189733 b, which is thought to have easterly winds moving at more than 9,600 kilometres per hour (6,000 mph).

Space weather


Weather is not limited to planetary bodies. Like all stars, the sun's corona is constantly being lost to space, creating what is essentially a very thin atmosphere throughout the Solar System. The movement of mass ejected from the Sun is known as the solar wind. Inconsistencies in this wind and larger events on the surface of the star, such as coronal mass ejections, form a system that has features analogous to conventional weather systems (such as pressure and wind) and is generally known as space weather. Coronal mass ejections have been tracked as far out in the solar system as Saturn. The activity of this system can affect planetary atmospheres and occasionally surfaces. The interaction of the solar wind with the terrestrial atmosphere can produce spectacular aurorae, and can play havoc with electrically sensitive systems such as electricity grids and radio signals.

Climate

From Wikipedia, the free encyclopedia

Climate is the statistics of weather over long periods of time. It is measured by assessing the patterns of variation in temperature, humidity, atmospheric pressure, wind, precipitation, atmospheric particle count and other meteorological variables in a given region over long periods of time. Climate differs from weather, in that weather only describes the short-term conditions of these variables in a given region. 
 
A region's climate is generated by the climate system, which has five components: atmosphere, hydrosphere, cryosphere, lithosphere, and biosphere.

The climate of a location is affected by its latitude, terrain, and altitude, as well as nearby water bodies and their currents. Climates can be classified according to the average and the typical ranges of different variables, most commonly temperature and precipitation. The most commonly used classification scheme was the Köppen climate classification. The Thornthwaite system, in use since 1948, incorporates evapotranspiration along with temperature and precipitation information and is used in studying biological diversity and how climate change affects it. The Bergeron and Spatial Synoptic Classification systems focus on the origin of air masses that define the climate of a region.

Paleoclimatology is the study of ancient climates. Since direct observations of climate are not available before the 19th century, paleoclimates are inferred from proxy variables that include non-biotic evidence such as sediments found in lake beds and ice cores, and biotic evidence such as tree rings and coral. Climate models are mathematical models of past, present and future climates. Climate change may occur over long and short timescales from a variety of factors; recent warming is discussed in global warming. Global warming results in redistributions. For example, "a 3°C change in mean annual temperature corresponds to a shift in isotherms of approximately 300–400 km in latitude (in the temperate zone) or 500 m in elevation. Therefore, species are expected to move upwards in elevation or towards the poles in latitude in response to shifting climate zones".

Definition

Generalistic map of global temperature in simple warm and cold differential.
 
Same but in threefold levels of temperature differential.
 
Climate (from Ancient Greek klima, meaning inclination) is commonly defined as the weather averaged over a long period. The standard averaging period is 30 years, but other periods may be used depending on the purpose. Climate also includes statistics other than the average, such as the magnitudes of day-to-day or year-to-year variations. The Intergovernmental Panel on Climate Change (IPCC) 2001 glossary definition is as follows:
Climate in a narrow sense is usually defined as the "average weather," or more rigorously, as the statistical description in terms of the mean and variability of relevant quantities over a period ranging from months to thousands or millions of years. The classical period is 30 years, as defined by the World Meteorological Organization (WMO). These quantities are most often surface variables such as temperature, precipitation, and wind. Climate in a wider sense is the state, including a statistical description, of the climate system.
The World Meteorological Organization (WMO) describes climate "normals" as "reference points used by climatologists to compare current climatological trends to that of the past or what is considered 'normal'. A Normal is defined as the arithmetic average of a climate element (e.g. temperature) over a 30-year period. A 30 year period is used, as it is long enough to filter out any interannual variation or anomalies, but also short enough to be able to show longer climatic trends." The WMO originated from the International Meteorological Organization which set up a technical commission for climatology in 1929. At its 1934 Wiesbaden meeting the technical commission designated the thirty-year period from 1901 to 1930 as the reference time frame for climatological standard normals. In 1982 the WMO agreed to update climate normals, and these were subsequently completed on the basis of climate data from 1 January 1961 to 31 December 1990.

The difference between climate and weather is usefully summarized by the popular phrase "Climate is what you expect, weather is what you get." Over historical time spans there are a number of nearly constant variables that determine climate, including latitude, altitude, proportion of land to water, and proximity to oceans and mountains. These change only over periods of millions of years due to processes such as plate tectonics. Other climate determinants are more dynamic: the thermohaline circulation of the ocean leads to a 5 °C (9 °F) warming of the northern Atlantic Ocean compared to other ocean basins. Other ocean currents redistribute heat between land and water on a more regional scale. The density and type of vegetation coverage affects solar heat absorption, water retention, and rainfall on a regional level. Alterations in the quantity of atmospheric greenhouse gases determines the amount of solar energy retained by the planet, leading to global warming or global cooling. The variables which determine climate are numerous and the interactions complex, but there is general agreement that the broad outlines are understood, at least insofar as the determinants of historical climate change are concerned.

Climate classification

Map of world dividing climate zones, largely influenced by latitude. The zones, going from the equator upward (and downward) are Tropical, Dry, Moderate, Continental and Polar. There are subzones within these zones.
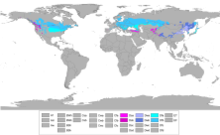
Worldwide Köppen climate classifications
 
There are several ways to classify climates into similar regimes. Originally, climes were defined in Ancient Greece to describe the weather depending upon a location's latitude. Modern climate classification methods can be broadly divided into genetic methods, which focus on the causes of climate, and empiric methods, which focus on the effects of climate. Examples of genetic classification include methods based on the relative frequency of different air mass types or locations within synoptic weather disturbances. Examples of empiric classifications include climate zones defined by plant hardiness, evapotranspiration, or more generally the Köppen climate classification which was originally designed to identify the climates associated with certain biomes. A common shortcoming of these classification schemes is that they produce distinct boundaries between the zones they define, rather than the gradual transition of climate properties more common in nature.

Bergeron and Spatial Synoptic

The simplest classification is that involving air masses. The Bergeron classification is the most widely accepted form of air mass classification. Air mass classification involves three letters. The first letter describes its moisture properties, with c used for continental air masses (dry) and m for maritime air masses (moist). The second letter describes the thermal characteristic of its source region: T for tropical, P for polar, A for Arctic or Antarctic, M for monsoon, E for equatorial, and S for superior air (dry air formed by significant downward motion in the atmosphere). The third letter is used to designate the stability of the atmosphere. If the air mass is colder than the ground below it, it is labeled k. If the air mass is warmer than the ground below it, it is labeled w. While air mass identification was originally used in weather forecasting during the 1950s, climatologists began to establish synoptic climatologies based on this idea in 1973.

Based upon the Bergeron classification scheme is the Spatial Synoptic Classification system (SSC). There are six categories within the SSC scheme: Dry Polar (similar to continental polar), Dry Moderate (similar to maritime superior), Dry Tropical (similar to continental tropical), Moist Polar (similar to maritime polar), Moist Moderate (a hybrid between maritime polar and maritime tropical), and Moist Tropical (similar to maritime tropical, maritime monsoon, or maritime equatorial).

Köppen

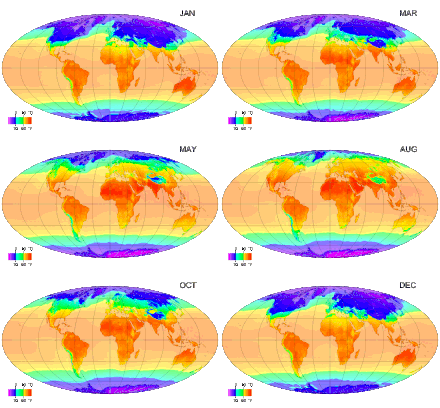
Monthly average surface temperatures from 1961–1990. This is an example of how climate varies with location and season
 
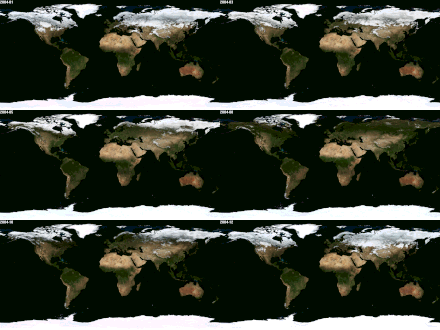
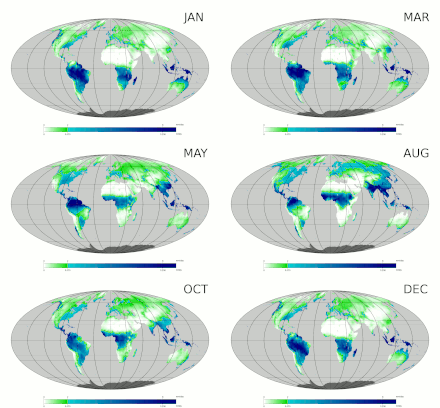
Monthly global images from NASA Earth Observatory (interactive SVG)

The Köppen classification depends on average monthly values of temperature and precipitation. The most commonly used form of the Köppen classification has five primary types labeled A through E. These primary types are A) tropical, B) dry, C) mild mid-latitude, D) cold mid-latitude, and E) polar. The five primary classifications can be further divided into secondary classifications such as rainforest, monsoon, tropical savanna, humid subtropical, humid continental, oceanic climate, Mediterranean climate, desert, steppe, subarctic climate, tundra, and polar ice cap

Rainforests are characterized by high rainfall, with definitions setting minimum normal annual rainfall between 1,750 millimetres (69 in) and 2,000 millimetres (79 in). Mean monthly temperatures exceed 18 °C (64 °F) during all months of the year.

A monsoon is a seasonal prevailing wind which lasts for several months, ushering in a region's rainy season. Regions within North America, South America, Sub-Saharan Africa, Australia and East Asia are monsoon regimes.

The world's cloudy and sunny spots. NASA Earth Observatory map using data collected between July 2002 and April 2015.
 
A tropical savanna is a grassland biome located in semiarid to semi-humid climate regions of subtropical and tropical latitudes, with average temperatures remain at or above 18 °C (64 °F) year round and rainfall between 750 millimetres (30 in) and 1,270 millimetres (50 in) a year. They are widespread on Africa, and are found in India, the northern parts of South America, Malaysia, and Australia.

Cloud cover by month for 2014. NASA Earth Observatory
 
The humid subtropical climate zone where winter rainfall (and sometimes snowfall) is associated with large storms that the westerlies steer from west to east. Most summer rainfall occurs during thunderstorms and from occasional tropical cyclones. Humid subtropical climates lie on the east side of continents, roughly between latitudes 20° and 40° degrees away from the equator.

A humid continental climate is marked by variable weather patterns and a large seasonal temperature variance. Places with more than three months of average daily temperatures above 10 °C (50 °F) and a coldest month temperature below −3 °C (27 °F) and which do not meet the criteria for an arid or semiarid climate, are classified as continental.

An oceanic climate is typically found along the west coasts at the middle latitudes of all the world's continents, and in southeastern Australia, and is accompanied by plentiful precipitation year-round.

The Mediterranean climate regime resembles the climate of the lands in the Mediterranean Basin, parts of western North America, parts of Western and South Australia, in southwestern South Africa and in parts of central Chile. The climate is characterized by hot, dry summers and cool, wet winters.

A steppe is a dry grassland with an annual temperature range in the summer of up to 40 °C (104 °F) and during the winter down to −40 °C (−40 °F).

A subarctic climate has little precipitation, and monthly temperatures which are above 10 °C (50 °F) for one to three months of the year, with permafrost in large parts of the area due to the cold winters. Winters within subarctic climates usually include up to six months of temperatures averaging below 0 °C (32 °F).

Map of arctic tundra

Tundra occurs in the far Northern Hemisphere, north of the taiga belt, including vast areas of northern Russia and Canada.

A polar ice cap, or polar ice sheet, is a high-latitude region of a planet or moon that is covered in ice. Ice caps form because high-latitude regions receive less energy as solar radiation from the sun than equatorial regions, resulting in lower surface temperatures.

A desert is a landscape form or region that receives very little precipitation. Deserts usually have a large diurnal and seasonal temperature range, with high or low, depending on location daytime temperatures (in summer up to 45 °C or 113 °F), and low nighttime temperatures (in winter down to 0 °C or 32 °F) due to extremely low humidity. Many deserts are formed by rain shadows, as mountains block the path of moisture and precipitation to the desert.

Thornthwaite

Precipitation by month

Devised by the American climatologist and geographer C. W. Thornthwaite, this climate classification method monitors the soil water budget using evapotranspiration. It monitors the portion of total precipitation used to nourish vegetation over a certain area. It uses indices such as a humidity index and an aridity index to determine an area's moisture regime based upon its average temperature, average rainfall, and average vegetation type. The lower the value of the index in any given area, the drier the area is. 

The moisture classification includes climatic classes with descriptors such as hyperhumid, humid, subhumid, subarid, semi-arid (values of −20 to −40), and arid (values below −40). Humid regions experience more precipitation than evaporation each year, while arid regions experience greater evaporation than precipitation on an annual basis. A total of 33 percent of the Earth's landmass is considered either arid or semi-arid, including southwest North America, southwest South America, most of northern and a small part of southern Africa, southwest and portions of eastern Asia, as well as much of Australia. Studies suggest that precipitation effectiveness (PE) within the Thornthwaite moisture index is overestimated in the summer and underestimated in the winter. This index can be effectively used to determine the number of herbivore and mammal species numbers within a given area. The index is also used in studies of climate change.

Thermal classifications within the Thornthwaite scheme include microthermal, mesothermal, and megathermal regimes. A microthermal climate is one of low annual mean temperatures, generally between 0 °C (32 °F) and 14 °C (57 °F) which experiences short summers and has a potential evaporation between 14 centimetres (5.5 in) and 43 centimetres (17 in). A mesothermal climate lacks persistent heat or persistent cold, with potential evaporation between 57 centimetres (22 in) and 114 centimetres (45 in). A megathermal climate is one with persistent high temperatures and abundant rainfall, with potential annual evaporation in excess of 114 centimetres (45 in).

Record

Modern

Global mean surface temperature change since 1880. Source: NASA GISS

Details of the modern climate record are known through the taking of measurements from such weather instruments as thermometers, barometers, and anemometers during the past few centuries. The instruments used to study weather over the modern time scale, their known error, their immediate environment, and their exposure have changed over the years, which must be considered when studying the climate of centuries past.

Paleoclimatology

Paleoclimatology is the study of past climate over a great period of the Earth's history. It uses evidence from ice sheets, tree rings, sediments, coral, and rocks to determine the past state of the climate. It demonstrates periods of stability and periods of change and can indicate whether changes follow patterns such as regular cycles.

Climate change

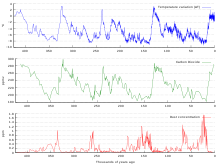
Variations in CO2, temperature and dust from the Vostok ice core over the past 450,000 years

Climate change is the variation in global or regional climates over time. It reflects changes in the variability or average state of the atmosphere over time scales ranging from decades to millions of years. These changes can be caused by processes internal to the Earth, external forces (e.g. variations in sunlight intensity) or, more recently, human activities.

2015 – Warmest Global Year on Record (since 1880) – Colors indicate temperature anomalies (NASA/NOAA; 20 January 2016).
 
In recent usage, especially in the context of environmental policy, the term "climate change" often refers only to changes in modern climate, including the rise in average surface temperature known as global warming. In some cases, the term is also used with a presumption of human causation, as in the United Nations Framework Convention on Climate Change (UNFCCC). The UNFCCC uses "climate variability" for non-human caused variations.

Earth has undergone periodic climate shifts in the past, including four major ice ages. These consisting of glacial periods where conditions are colder than normal, separated by interglacial periods. The accumulation of snow and ice during a glacial period increases the surface albedo, reflecting more of the Sun's energy into space and maintaining a lower atmospheric temperature. Increases in greenhouse gases, such as by volcanic activity, can increase the global temperature and produce an interglacial period. Suggested causes of ice age periods include the positions of the continents, variations in the Earth's orbit, changes in the solar output, and volcanism.

Climate models

Climate models use quantitative methods to simulate the interactions of the atmosphere, oceans, land surface and ice. They are used for a variety of purposes; from the study of the dynamics of the weather and climate system, to projections of future climate. All climate models balance, or very nearly balance, incoming energy as short wave (including visible) electromagnetic radiation to the earth with outgoing energy as long wave (infrared) electromagnetic radiation from the earth. Any imbalance results in a change in the average temperature of the earth. 

The most talked-about applications of these models in recent years have been their use to infer the consequences of increasing greenhouse gases in the atmosphere, primarily carbon dioxide (see greenhouse gas). These models predict an upward trend in the global mean surface temperature, with the most rapid increase in temperature being projected for the higher latitudes of the Northern Hemisphere. 

Models can range from relatively simple to quite complex:
  • Simple radiant heat transfer model that treats the earth as a single point and averages outgoing energy
  • this can be expanded vertically (radiative-convective models), or horizontally
  • finally, (coupled) atmosphere–ocean–sea ice global climate models discretise and solve the full equations for mass and energy transfer and radiant exchange.
Climate forecasting is used by some scientists to predict climate change. In 1997 the prediction division of the International Research Institute for Climate and Society at Columbia University began generating seasonal climate forecasts on a real-time basis. To produce these forecasts an extensive suite of forecasting tools was developed, including a multimodel ensemble approach that required thorough validation of each model's accuracy level in simulating interannual climate variability.

Copenhagen Consensus

From Wikipedia, the free encyclopedia

Copenhagen Consensus is a project that seeks to establish priorities for advancing global welfare using methodologies based on the theory of welfare economics, using cost–benefit analysis. It was conceived and organized by Bjørn Lomborg, the author of The Skeptical Environmentalist and the then director of the Danish government's Environmental Assessment Institute.
 
The project is run by the Copenhagen Consensus Center, which is directed by Lomborg and was part of the Copenhagen Business School, but it is now an independent 501(c)(3) non-profit organisation registered in the USA. The project considers possible solutions to a wide range of problems, presented by experts in each field. These are evaluated and ranked by a panel of economists. The emphasis is on rational prioritization by economic analysis. The panel is given an arbitrary budget constraint and instructed to use cost–benefit analysis to focus on a bottom line approach in solving/ranking presented problems. The approach is justified as a corrective to standard practice in international development, where, it is alleged, media attention and the "court of public opinion" results in priorities that are often far from optimal.

History

The project has held conferences in 2004, 2007, 2008, 2009, 2011 and 2012. The 2012 conference ranked bundled micronutrient interventions the highest priority, and the 2008 report identified supplementing vitamins for undernourished children as the world’s best investment. The 2009 conference, dealing specifically with global warming, proposed research into marine cloud whitening (ships spraying seawater into clouds to make them reflect more sunlight and thereby reduce temperature) as the top climate change priority, though climate change itself is ranked well below other world problems. In 2011 the Copenhagen Consensus Center carried out the Rethink HIV project together with the RUSH Foundation, to find smart solutions to the problem of HIV/AIDS. In 2007 looked into which projects would contribute most to welfare in Copenhagen Consensus for Latin America in cooperation with the Inter-American Development Bank. 

The initial project was co-sponsored by the Danish government and The Economist. A book summarizing the Copenhagen Consensus 2004 conclusions, Global Crises, Global Solutions, edited by Lomborg, was published in October 2004 by Cambridge University Press, followed by the second edition published in 2009 based on the 2008 conclusions. The book containing the Copenhagen Consensus 2012 research and outcomes is in the process of publication.

Copenhagen Consensus 2012

In May 2012, the third global Copenhagen Consensus was held, gathering economists to analyze the costs and benefits of different approaches to tackling the world‘s biggest problems. The aim was to provide an answer to the question: If you had $75bn for worthwhile causes, where should you start? A panel including four Nobel laureates met in Copenhagen, Denmark, in May 2012. The panel’s deliberations were informed by thirty new economic research papers that were written just for the project by scholars from around the world.

Economists

The panel members were the following, four of whom are Nobel Laureate economists.

Challenges

In addition, the Center commissioned research on Corruption and Trade Barriers, but the Expert Panel did not rank these for Copenhagen Consensus 2012, because the solutions to these challenges are political rather than investment-related.

Outcome

Given the budget restraints, they found 16 investments worthy of investment (in descending order of desirability):
  1. Bundled micronutrient interventions to fight hunger and improve education
  2. Expanding the Subsidy for Malaria Combination Treatment
  3. Expanded Childhood Immunization Coverage
  4. Deworming of Schoolchildren, to improve educational and health outcomes
  5. Expanding Tuberculosis Treatment
  6. R&D to Increase Yield Enhancements, to decrease hunger, fight biodiversity destruction, and lessen the effects of climate change
  7. Investing in Effective Early Warning Systems to protect populations against natural disaster
  8. Strengthening Surgical Capacity
  9. Hepatitis B Immunization
  10. Using Low‐Cost Drugs in the case of Acute Heart Attacks in poorer nations (these are already available in developed countries)
  11. Salt Reduction Campaign to reduce chronic disease
  12. Geo‐Engineering R&D into the feasibility of solar radiation management
  13. Conditional Cash Transfers for School Attendance
  14. Accelerated HIV Vaccine R&D
  15. Extended Field Trial of Information Campaigns on the Benefits From Schooling
  16. Borehole and Public Hand Pump Intervention

Slate ranking

During the days of the Copenhagen Consensus 2012 conference, a series of articles was published in Slate Magazine each about a challenge that was discussed, and Slate readers could make their own ranking, voting for the solutions which they thought were best. Slate readers' ranking corresponded with that of the Expert Panel on many points, including the desirability of bundled micronutrient intervention; however, the most striking difference was in connection with the problem of overpopulation. Family planning ranked highest on the Slate priority list, whereas it didn't feature in the top 16 of the Expert Panel's prioritisation.

Copenhagen Consensus 2008

Economists

Nobel Prize winners marked with (¤)

Results

In the Copenhagen Consensus 2008, the solutions for global problems have been ranked in the following order:
  1. Micronutrient supplements for children (vitamin A and zinc)
  2. The Doha development agenda
  3. Micronutrient fortification (iron and salt iodization)
  4. Expanded immunization coverage for children
  5. Biofortification
  6. Deworming and other nutrition programs at school
  7. Lowering the price of schooling
  8. Increase and improve girls’ schooling
  9. Community-based nutrition promotion
  10. Provide support for women’s reproductive role
  11. Heart attack acute management
  12. Malaria prevention and treatment
  13. Tuberculosis case finding and treatment
  14. R&D in low-carbon energy technologies
  15. Bio-sand filters for household water treatment
  16. Rural water supply
  17. Conditional cash transfer
  18. Peace-keeping in post-conflict situations
  19. HIV combination prevention
  20. Total sanitation campaign
  21. Improving surgical capacity at district hospital level
  22. Microfinance
  23. Improved stove intervention to combat Air Pollution
  24. Large, multipurpose dam in Africa
  25. Inspection and maintenance of diesel vehicles
  26. Low sulfur diesel for urban road vehicles
  27. Diesel vehicle particulate control technology
  28. Tobacco tax
  29. R&D and carbon dioxide emissions reduction
  30. Carbon dioxide emissions reduction
Unlike the 2004 results, these were not grouped into qualitative bands such as Good, Poor, etc. 

Gary Yohe, one of the authors of the global warming paper, subsequently accused Lomborg of "deliberate distortion of our conclusions", adding that "as one of the authors of the Copenhagen Consensus Project's principal climate paper, I can say with certainty that Lomborg is misrepresenting our findings thanks to a highly selective memory". Kåre Fog further pointed out that the future benefits of emissions reduction were discounted at a higher rate than for any of the other 27 proposals, stating "so there is an obvious reason why the climate issue always is ranked last" in Lomborg's environmental studies. 

In a subsequent joint statement settling their differences, Lomborg and Yohe agreed that the "failure" of Lomborg's emissions reduction plan "could be traced to faulty design".

Climate Change Project

In 2009, the Copenhagen Consensus established a Climate Change Project specifically to examine solutions to climate change. The process was similar to the 2004 and 2008 Copenhagen Consensus, involving papers by specialists considered by a panel of economists. The panel ranked 15 solutions, of which the top 5 were:
  1. Research into marine cloud whitening (involving ships spraying sea-water into clouds so as to reflect more sunlight and thereby reduce temperatures)
  2. Technology-led policy response
  3. Research into stratospheric aerosol injection (involving injected ?sulphur dioxide into the upper atmosphere to reduce sunlight)
  4. Research into carbon storage
  5. Planning for adaptation
The benefits of the number 1 solution are that if the research proved successful this solution could be deployed relatively cheaply and quickly. Potential problems include environmental impacts e.g. from changing rainfall patterns. 

Measures to cut carbon and methane emissions, such as carbon taxes, came bottom of the results list, partly because they would take a long time to have much effect on temperatures.

Copenhagen Consensus 2004

Process

Eight economists met May 24–28, 2004 at a roundtable in Copenhagen. A series of background papers had been prepared in advance to summarize the current knowledge about the welfare economics of 32 proposals ("opportunities") from 10 categories ("challenges"). For each category, one assessment article and two critiques were produced. After a closed-door review of the background papers, each of the participants gave economic priority rankings to 17 of the proposals (the rest were deemed inconclusive).

Economists

Nobel Prize winners marked with (¤)

Challenges

Below is a list of the 10 challenge areas and the author of the paper on each. Within each challenge, 3–4 opportunities (proposals) were analyzed: 

Preventing spread of HIV

Results

The panel agreed to rate seventeen of the thirty-two opportunities within seven of the ten challenges. The rated opportunities were further classified into four groups: Very Good, Good, Fair and Bad; all results are based using cost–benefit analysis.

Very good

The highest priority was assigned to implementing certain new measures to prevent the spread of HIV and AIDS. The economists estimated that an investment of $27 billion could avert nearly 30 million new infections by 2010. 

Policies to reduce malnutrition and hunger were chosen as the second priority. Increasing the availability of micronutrients, particularly reducing iron deficiency anemia through dietary supplements, was judged to have an exceptionally high ratio of benefits to costs, which were estimated at $12 billion. 

Control malaria
 
Third on the list was trade liberalization; the experts agreed that modest costs could yield large benefits for the world as a whole and for developing nations

The fourth priority identified was controlling and treating malaria; $13 billion costs were judged to produce very good benefits, particularly if applied toward chemically-treated mosquito netting for beds.

Good

The fifth priority identified was increased spending on research into new agricultural technologies appropriate for developing nations. Three proposals for improving sanitation and water quality for a billion of the world’s poorest followed in priority (ranked sixth to eighth: small-scale water technology for livelihoods, community-managed water supply and sanitation, and research on water productivity in food production). Completing this group was the 'government' project concerned with lowering the cost of starting new businesses.

Fair

Ranked tenth was the project on lowering barriers to migration for skilled workers. Eleventh and twelfth on the list were malnutrition projects – improving infant and child nutrition and reducing the prevalence of low birth weight. Ranked thirteenth was the plan for scaled-up basic health services to fight diseases.

Poor

Ranked fourteenth to seventeenth were: a migration project (guest-worker programmes for the unskilled), which was deemed to discourage integration; and three projects addressing climate change (optimal carbon tax, the Kyoto Protocol and value-at-risk carbon tax), which the panel judged to be least cost-efficient of the proposals.

Global warming

The panel found that all three climate policies presented have "costs that were likely to exceed the benefits". It further stated "global warming must be addressed, but agreed that approaches based on too abrupt a shift toward lower emissions of carbon are needlessly expensive." 

In regard to the science of global warming, the paper presented by Cline relied primarily on the framework set by Intergovernmental Panel on Climate Change, and accepted the consensus view on global warming that greenhouse gas emissions from human activities are the primary cause of the global warming. Cline relies on various research studies published in the field of economics and attempted to compare the estimated cost of mitigation policies against the expected reduction in the damage of the global warming. 

Cline used a discount rate of 1.5%. (Cline's summary is on the project webpage) He justified his choice of discount rate on the ground of "utility-based discounting", that is there is zero bias in terms of preference between the present and the future generation. Moreover, Cline extended the time frame of the analysis to three hundred years in the future. Because the expected net damage of the global warming becomes more apparent beyond the present generation(s), this choice had the effect of increasing the present-value cost of the damage of global warming as well as the benefit of abatement policies.

Criticism

Members of the panel including Thomas Schelling and one of the two perspective paper writers Robert O. Mendelsohn (both opponents of the Kyoto protocol) criticised Cline, mainly on the issue of discount rates. (See "The opponent notes to the paper on Climate Change") Mendelsohn, in particular, characterizing Cline's position, said that "[i]f we use a large discount rate, they will be judged to be small effects" and called it "circular reasoning, not a justification". Cline responded to this by arguing that there is no obvious reason to use a large discount rate just because this is what is usually done in economic analysis. In other words, climate change ought to be treated differently from other, more imminent problems. The Economist quoted Mendelsohn as worrying that "climate change was set up to fail".

Moreover, Mendelsohn argued that Cline's damage estimates were excessive. Citing various recent articles, including some of his own, he stated that "[a] series of studies on the impacts of climate change have systematically shown that the older literature overestimated climate damages by failing to allow for adaptation and for climate benefits." 

Members of the panel, including Schelling, criticised the way this issue was handled in the Consensus project.

The 2004 Copenhagen Consensus attracted various criticisms:

Approach and alleged bias

The 2004 report, especially its conclusion regarding climate change was subsequently criticised from a variety of perspectives. The general approach adopted to set priorities was criticised by Jeffrey Sachs, an American economist and advocate of both the Kyoto protocol  and increased development aid, who argued that the analytical framework was inappropriate and biased and that the project "failed to mobilize an expert group that could credibly identify and communicate a true consensus of expert knowledge on the range of issues under consideration.".

Tom Burke, a former director of Friends of the Earth, repudiated the entire approach of the project, arguing that applying cost–benefit analysis in the way the Copenhagen panel did was "junk economics".

John Quiggin, an Australian economics professor, commented that the project is a mix of "a substantial contribution to our understanding of important issues facing the world" and an "exercises in political propaganda" and argued that the selection of the panel members was slanted towards the conclusions previously supported by Lomborg. Quiggin observed that Lomborg had argued in his controversial book The Skeptical Environmentalist that resources allocated to mitigating global warming would be better spent on improving water quality and sanitation, and was therefore seen as having prejudged the issues. 

Under the heading "Wrong Question", Sachs further argued that: "The panel that drew up the Copenhagen Consensus was asked to allocate an additional US$50 billion in spending by wealthy countries, distributed over five years, to address the world’s biggest problems. This was a poor basis for decision-making and for informing the public. By choosing such a low sum — a tiny fraction of global income — the project inherently favoured specific low-cost schemes over bolder, larger projects. It is therefore no surprise that the huge and complex challenge of long-term climate change was ranked last, and that scaling up health services in poor countries was ranked lower than interventions against specific diseases, despite warnings in the background papers that such interventions require broader improvements in health services." 

In response Lomborg argued that $50 billion was "an optimistic but realistic example of actual spending." "Experience shows that pledges and actual spending are two different things. In 1970 the UN set itself the task of doubling development assistance. Since then the percentage has actually been dropping". "But even if Sachs or others could gather much more than $50 billion over the next 4 years, the Copenhagen Consensus priority list would still show us where it should be invested first."

One of the Copenhagen Consensus panel experts later distanced himself from the way in which the Consensus results have been interpreted in the wider debate. Thomas Schelling now thinks that it was misleading to put climate change at the bottom of the priority list. The Consensus panel members were presented with a dramatic proposal for handling climate change. If given the opportunity, Schelling would have put a more modest proposal higher on the list. The Yale economist Robert O. Mendelsohn was the official critic of the proposal for climate change during the Consensus. He thought the proposal was way out of the mainstream and could only be rejected. Mendelsohn worries that climate change was set up to fail. 

Michael Grubb, an economist and lead author for several IPCC reports, commented on the Copenhagen Consensus, writing:
To try and define climate policy as a trade-off against foreign aid is thus a forced choice that bears no relationship to reality. No government is proposing that the marginal costs associated with, for example, an emissions trading system, should be deducted from its foreign aid budget. This way of posing the question is both morally inappropriate and irrelevant to the determination of real climate mitigation policy.

Panel membership

Quiggin argued that the members of the 2004 panel, selected by Lomborg, were, "generally towards the right and, to the extent that they had stated views, to be opponents of Kyoto.". Sachs also noted that the panel members had not previously been much involved in issues of development economics, and were unlikely to reach useful conclusions in the time available to them. Commenting on the 2004 Copenhagen Consensus, climatologist and IPCC author Stephen Schneider criticised Lomborg for only inviting economists to participate:
In order to achieve a true consensus, I think Lomborg would've had to invite ecologists, social scientists concerned with justice and how climate change impacts and policies are often inequitably distributed, philosophers who could challenge the economic paradigm of "one dollar, one vote" implicit in cost–benefit analyses promoted by economists, and climate scientists who could easily show that Lomborg's claim that climate change will have only minimal effects is not sound science.
Lomborg countered criticism of the panel membership by stating that "Sachs disparaged the Consensus ‘dream team’ because it only consisted of economists. But that was the very point of the project. Economists have expertise in economic prioritization. It is they and not climatologists or malaria experts who can prioritize between battling global warming or communicable disease," 

Carbon nanotube field-effect transistor

From Wikipedia, the free encyclopedia https://en.wikipedia.org/wiki/Car...