| Andromeda Galaxy | |
|---|---|
.jpg) The Andromeda Galaxy with satellite galaxies M32, (center left above the galactic nucleus) and M110, (center left below the galaxy) | |
| Observation data (J2000 epoch) | |
| Pronunciation | /ænˈdrɒmɪdə/ |
| Constellation | Andromeda |
| Right ascension | 00h 42m 44.3s |
| Declination | +41° 16′ 9″ |
| Redshift | z = −0.001001 (minus sign indicates blueshift) |
| Helio radial velocity | −301 ± 1 km/s |
| Distance | 2.54 ± 0.11 Mly (778 ± 33 kpc) |
| Apparent magnitude (V) | 3.44 |
| Absolute magnitude (V) | −21.5 |
| Characteristics | |
| Type | SA(s)b |
| Mass | (1.5±0.5)×1012 M☉ |
| Number of stars | ~1 trillion (1012) |
| Size | ~220 kly (67 kpc) (diameter) |
| Apparent size (V) | 3.167° × 1° |
| Other designations | |
| M31, NGC 224, UGC 454, PGC 2557, 2C 56 (Core),[1] CGCG 535-17, MCG +07-02-016, IRAS 00400+4059, 2MASX J00424433+4116074, GC 116, h 50, Bode 3, Flamsteed 58, Hevelius 32, Ha 3.3, IRC +40013 | |
The Andromeda Galaxy (IPA: /ænˈdrɒmɪdə/), also known as Messier 31, M31, or NGC 224 and originally the Andromeda Nebula (see below), is a barred spiral galaxy approximately 2.5 million light-years (770 kiloparsecs) from Earth and the nearest major galaxy to the Milky Way. The galaxy's name stems from the area of Earth's sky in which it appears, the constellation of Andromeda, which itself is named after the Ethiopian (or Phoenician) princess who was the wife of Perseus in Greek mythology.
The virial mass of the Andromeda Galaxy is of the same order of magnitude as that of the Milky Way, at 1 trillion solar masses (2.0×1042 kilograms). The mass of either galaxy is difficult to estimate with any accuracy, but it was long thought that the Andromeda Galaxy is more massive than the Milky Way by a margin of some 25% to 50%. This has been called into question by a 2018 study that cited a lower estimate on the mass of the Andromeda Galaxy, combined with preliminary reports on a 2019 study estimating a higher mass of the Milky Way. The Andromeda Galaxy has a diameter of about 220,000 ly (67 kpc), making it the largest member of the Local Group in terms of extension, if not mass.
The number of stars contained in the Andromeda Galaxy is estimated at one trillion (1×10¹²), or roughly twice the number estimated for the Milky Way.
The Milky Way and Andromeda galaxies are expected to collide in around 4.5 billion years, merging to form a giant elliptical galaxy or a large lenticular galaxy. With an apparent magnitude of 3.4, the Andromeda Galaxy is among the brightest of the Messier objects, making it visible to the naked eye from Earth on moonless nights, even when viewed from areas with moderate light pollution.
Observation history

Around the year 964, the Persian astronomer Abd al-Rahman al-Sufi was the first to describe the Andromeda Galaxy. He referred to it in his Book of Fixed Stars as a "nebulous smear".
Star charts of that period labeled it as the Little Cloud. In 1612, the German astronomer Simon Marius gave an early description of the Andromeda Galaxy based on telescopic observations. Pierre Louis Maupertuis conjectured in 1745 that the blurry spot was an island universe. In 1764, Charles Messier cataloged Andromeda as object M31 and incorrectly credited Marius as the discoverer despite it being visible to the naked eye. In 1785, the astronomer William Herschel noted a faint reddish hue in the core region of Andromeda. He believed Andromeda to be the nearest of all the "great nebulae", and based on the color and magnitude of the nebula, he incorrectly guessed that it was no more than 2,000 times the distance of Sirius, or roughly 18,000 ly (5.5 kpc). In 1850, William Parsons, 3rd Earl of Rosse made the first drawing of Andromeda's spiral structure.
In 1864 Sir William Huggins noted that the spectrum of Andromeda differed from that of a gaseous nebula. The spectra of Andromeda displays a continuum of frequencies, superimposed with dark absorption lines that help identify the chemical composition of an object. Andromeda's spectrum is very similar to the spectra of individual stars, and from this, it was deduced that Andromeda has a stellar nature. In 1885, a supernova (known as S Andromedae) was seen in Andromeda, the first and so far only one observed in that galaxy. At the time Andromeda was considered to be a nearby object, so the cause was thought to be a much less luminous and unrelated event called a nova, and was named accordingly; "Nova 1885".
In 1887, Isaac Roberts took the first photographs of Andromeda, which was still commonly thought to be a nebula within our galaxy. Roberts mistook Andromeda and similar spiral nebulae as solar systems being formed. In 1912, Vesto Slipher used spectroscopy to measure the radial velocity of Andromeda with respect to our Solar System—the largest velocity yet measured, at 300 km/s (190 mi/s).
Island universe

In 1917, Heber Curtis observed a nova within Andromeda. Searching the photographic record, 11 more novae were discovered. Curtis noticed that these novae were, on average, 10 magnitudes fainter than those that occurred elsewhere in the sky. As a result, he was able to come up with a distance estimate of 500,000 ly (3.2×10¹⁰ AU). He became a proponent of the so-called "island universes" hypothesis, which held that spiral nebulae were actually independent galaxies.

In 1920, the Great Debate between Harlow Shapley and Curtis took place concerning the nature of the Milky Way, spiral nebulae, and the dimensions of the universe. To support his claim of the Great Andromeda Nebula being, in fact, an external galaxy, Curtis also noted the appearance of dark lanes within Andromeda which resembled the dust clouds in our own galaxy, as well as historical observations of Andromeda Galaxy's significant Doppler shift. In 1922 Ernst Öpik presented a method to estimate the distance of Andromeda using the measured velocities of its stars. His result placed the Andromeda Nebula far outside our galaxy at a distance of about 450 kpc (1,500 kly). Edwin Hubble settled the debate in 1925 when he identified extragalactic Cepheid variable stars for the first time on astronomical photos of Andromeda. These were made using the 2.5-metre (8 ft 2 in) Hooker telescope, and they enabled the distance of Great Andromeda Nebula to be determined. His measurement demonstrated conclusively that this feature was not a cluster of stars and gas within our own galaxy, but an entirely separate galaxy located a significant distance from the Milky Way.
In 1943, Walter Baade was the first person to resolve stars in the central region of the Andromeda Galaxy. Baade identified two distinct populations of stars based on their metallicity, naming the young, high-velocity stars in the disk Type I and the older, red stars in the bulge Type II. This nomenclature was subsequently adopted for stars within the Milky Way, and elsewhere. (The existence of two distinct populations had been noted earlier by Jan Oort.) Baade also discovered that there were two types of Cepheid variable stars, which resulted in a doubling of the distance estimate to Andromeda, as well as the remainder of the universe.
In 1950, radio emission from the Andromeda Galaxy was detected by Hanbury Brown and Cyril Hazard at Jodrell Bank Observatory. The first radio maps of the galaxy were made in the 1950s by John Baldwin and collaborators at the Cambridge Radio Astronomy Group. The core of the Andromeda Galaxy is called 2C 56 in the 2C radio astronomy catalog. In 2009, the first planet may have been discovered in the Andromeda Galaxy. This was detected using a technique called microlensing, which is caused by the deflection of light by a massive object.
Observations of linearly polarized radio emission with the Westerbork Synthesis Radio Telescope, the Effelsberg 100-m telescope, and the Very Large Array revealed ordered magnetic fields aligned along the "10-kpc ring" of gas and star formation. The total magnetic field has a strength of about 0.5 nT, of which 0.3 nT are ordered.
General
The estimated distance of the Andromeda Galaxy from our own was doubled in 1953 when it was discovered that there is another, dimmer type of Cepheid variable star. In the 1990s, measurements of both standard red giants as well as red clump stars from the Hipparcos satellite measurements were used to calibrate the Cepheid distances.
Formation and history

The Andromeda Galaxy was formed roughly 10 billion years ago from the collision and subsequent merger of smaller protogalaxies.
This violent collision formed most of the galaxy's (metal-rich) galactic halo and extended disk. During this epoch, its rate of star formation would have been very high, to the point of becoming a luminous infrared galaxy for roughly 100 million years. Andromeda and the Triangulum Galaxy had a very close passage 2–4 billion years ago. This event produced high rates of star formation across the Andromeda Galaxy's disk—even some globular clusters—and disturbed M33's outer disk.
Over the past 2 billion years, star formation throughout Andromeda's disk is thought to have decreased to the point of near-inactivity. There have been interactions with satellite galaxies like M32, M110, or others that have already been absorbed by Andromeda Galaxy. These interactions have formed structures like Andromeda's Giant Stellar Stream. A galactic merger roughly 100 million years ago is believed to be responsible for a counter-rotating disk of gas found in the center of Andromeda as well as the presence there of a relatively young (100 million years old) stellar population.
Distance estimate
At least four distinct techniques have been used to estimate distances from Earth to the Andromeda Galaxy. In 2003, using the infrared surface brightness fluctuations (I-SBF) and adjusting for the new period-luminosity value and a metallicity correction of −0.2 mag dex−1 in (O/H), an estimate of 2.57 ± 0.06 million light-years (1.625×10¹¹ ± 3.8×10⁹ astronomical units) was derived. A 2004 Cepheid variable method estimated the distance to be 2.51 ± 0.13 million light-years (770 ± 40 kpc). In 2005, an eclipsing binary star was discovered in the Andromeda Galaxy. The binary is two hot blue stars of types O and B. By studying the eclipses of the stars, astronomers were able to measure their sizes. Knowing the sizes and temperatures of the stars, they were able to measure their absolute magnitude. When the visual and absolute magnitudes are known, the distance to the star can be calculated. The stars lie at a distance of 2.52×10⁶ ± 0.14×10⁶ ly (1.594×10¹¹ ± 8.9×10⁹ AU) and the whole Andromeda Galaxy at about 2.5×10⁶ ly (1.6×10¹¹ AU). This new value is in excellent agreement with the previous, independent Cepheid-based distance value. The TRGB method was also used in 2005 giving a distance of 2.56×10⁶ ± 0.08×10⁶ ly (1.619×10¹¹ ± 5.1×10⁹ AU). Averaged together, these distance estimates give a value of 2.54×10⁶ ± 0.11×10⁶ ly (1.606×10¹¹ ± 7.0×10⁹ AU). And, from this, the diameter of Andromeda at the widest point is estimated to be 220 ± 3 kly (67,450 ± 920 pc). Applying trigonometry (angular diameter), this is equivalent to an apparent 4.96° angle in the sky.
Mass estimates


As of 2019, current calculations based on escape velocity and dynamical mass measurements put the Andromeda Galaxy at 0.8×10¹² M☉, which is only half of the Milky Way's newer mass, calculated in 2019 at 1.5×10¹² M☉.
In addition to stars, Andromeda Galaxy's interstellar medium contains at least 7.2×10⁹ M☉ in the form of neutral hydrogen, at least 3.4×10⁸ M☉ as molecular hydrogen (within its innermost 10 kiloparsecs), and 5.4×10⁷ M☉ of dust.
Andromeda Galaxy is surrounded by a massive halo of hot gas that is estimated to contain half the mass of the stars in the galaxy. The nearly invisible halo stretches about a million light-years from its host galaxy, halfway to our Milky Way galaxy. Simulations of galaxies indicate the halo formed at the same time as the Andromeda Galaxy. The halo is enriched in elements heavier than hydrogen and helium, formed from supernovae and its properties are those expected for a galaxy that lies in the "green valley" of the Galaxy color–magnitude diagram (see below). Supernovae erupt in Andromeda Galaxy's star-filled disk and eject these heavier elements into space. Over Andromeda Galaxy's lifetime, nearly half of the heavy elements made by its stars have been ejected far beyond the galaxy's 200,000-light-year-diameter stellar disk.
Luminosity estimates
Compared to the Milky Way, the Andromeda Galaxy appears to have predominantly older stars with ages >7×10⁹ years. The estimated luminosity of Andromeda Galaxy, ~2.6×10¹⁰ L☉, is about 25% higher than that of our own galaxy. However, the galaxy has a high inclination as seen from Earth and its interstellar dust absorbs an unknown amount of light, so it is difficult to estimate its actual brightness and other authors have given other values for the luminosity of the Andromeda Galaxy (some authors even propose it is the second-brightest galaxy within a radius of 10 mega-parsecs of the Milky Way, after the Sombrero Galaxy, with an absolute magnitude of around -22.21 or close).
An estimation done with the help of Spitzer Space Telescope published in 2010 suggests an absolute magnitude (in the blue) of −20.89 (that with a color index of +0.63 translates to an absolute visual magnitude of −21.52, compared to −20.9 for the Milky Way), and a total luminosity in that wavelength of 3.64×10¹⁰ L☉.
The rate of star formation in the Milky Way is much higher, with Andromeda Galaxy producing only about one solar mass per year compared to 3–5 solar masses for the Milky Way. The rate of novae in the Milky Way is also double that of Andromeda Galaxy. This suggests that the latter once experienced a great star formation phase, but is now in a relative state of quiescence, whereas the Milky Way is experiencing more active star formation. Should this continue, the luminosity of the Milky Way may eventually overtake that of Andromeda Galaxy.
According to recent studies, the Andromeda Galaxy lies in what in the Galaxy color–magnitude diagram is known as the "green valley," a region populated by galaxies like the Milky Way in transition from the "blue cloud" (galaxies actively forming new stars) to the "red sequence" (galaxies that lack star formation). Star formation activity in green valley galaxies is slowing as they run out of star-forming gas in the interstellar medium. In simulated galaxies with similar properties to Andromeda Galaxy, star formation is expected to extinguish within about five billion years from the now, even accounting for the expected, short-term increase in the rate of star formation due to the collision between Andromeda Galaxy and the Milky Way.
Structure


Based on its appearance in visible light, the Andromeda Galaxy is classified as an SA(s)b galaxy in the de Vaucouleurs–Sandage extended classification system of spiral galaxies. However, infrared data from the 2MASS survey and from the Spitzer Space Telescope showed that Andromeda is actually a barred spiral galaxy, like the Milky Way, with Andromeda's bar major axis oriented 55 degrees anti-clockwise from the disc major axis.
In 2005, astronomers used the Keck telescopes to show that the tenuous sprinkle of stars extending outward from the galaxy is actually part of the main disk itself. This means that the spiral disk of stars in the Andromeda Galaxy is three times larger in diameter than previously estimated. This constitutes evidence that there is a vast, extended stellar disk that makes the galaxy more than 220,000 light-years (67 kiloparsecs) in diameter. Previously, estimates of the Andromeda Galaxy's size ranged from 70,000 to 120,000 light-years (21 to 37 kpc) across.
The galaxy is inclined an estimated 77° relative to Earth (where an angle of 90° would be viewed directly from the side). Analysis of the cross-sectional shape of the galaxy appears to demonstrate a pronounced, S-shaped warp, rather than just a flat disk. A possible cause of such a warp could be gravitational interaction with the satellite galaxies near the Andromeda Galaxy. The Galaxy M33 could be responsible for some warp in Andromeda's arms, though more precise distances and radial velocities are required.
Spectroscopic studies have provided detailed measurements of the rotational velocity of the Andromeda Galaxy as a function of radial distance from the core. The rotational velocity has a maximum value of 225 km/s (140 mi/s) at 1,300 ly (82,000,000 AU) from the core, and it has its minimum possibly as low as 50 km/s (31 mi/s) at 7,000 ly (440,000,000 AU) from the core. Further out, rotational velocity rises out to a radius of 33,000 ly (2.1×10⁹ AU), where it reaches a peak of 250 km/s (160 mi/s). The velocities slowly decline beyond that distance, dropping to around 200 km/s (120 mi/s) at 80,000 ly (5.1×10⁹ AU). These velocity measurements imply a concentrated mass of about 6×10⁹ M☉ in the nucleus. The total mass of the galaxy increases linearly out to 45,000 ly (2.8×10⁹ AU), then more slowly beyond that radius.
The spiral arms of the Andromeda Galaxy are outlined by a series of HII regions, first studied in great detail by Walter Baade and described by him as resembling "beads on a string". His studies show two spiral arms that appear to be tightly wound, although they are more widely spaced than in our galaxy.[72] His descriptions of the spiral structure, as each arm crosses the major axis of the Andromeda Galaxy, are as follows[73]§pp1062§pp92:
| Arms (N=cross M31's major axis at north, S=cross M31's major axis at south) | Distance from center (arcminutes) (N*/S*) | Distance from center (kpc) (N*/S*) | Notes |
|---|---|---|---|
| N1/S1 | 3.4/1.7 | 0.7/0.4 | Dust arms with no OB associations of HII regions. |
| N2/S2 | 8.0/10.0 | 1.7/2.1 | Dust arms with some OB associations. |
| N3/S3 | 25/30 | 5.3/6.3 | As per N2/S2, but with some HII regions too. |
| N4/S4 | 50/47 | 11/9.9 | Large numbers of OB associations, HII regions, and little dust. |
| N5/S5 | 70/66 | 15/14 | As per N4/S4 but much fainter. |
| N6/S6 | 91/95 | 19/20 | Loose OB associations. No dust visible. |
| N7/S7 | 110/116 | 23/24 | As per N6/S6 but fainter and inconspicuous. |
Since the Andromeda Galaxy is seen close to edge-on, it is difficult to study its spiral structure. Rectified images of the galaxy seem to show a fairly normal spiral galaxy, exhibiting two continuous trailing arms that are separated from each other by a minimum of about 13,000 ly (820,000,000 AU) and that can be followed outward from a distance of roughly 1,600 ly (100,000,000 AU) from the core. Alternative spiral structures have been proposed such as a single spiral arm or a flocculent pattern of long, filamentary, and thick spiral arms.
The most likely cause of the distortions of the spiral pattern is thought to be interaction with galaxy satellites M32 and M110. This can be seen by the displacement of the neutral hydrogen clouds from the stars.
In 1998, images from the European Space Agency's Infrared Space Observatory demonstrated that the overall form of the Andromeda Galaxy may be transitioning into a ring galaxy. The gas and dust within the galaxy is generally formed into several overlapping rings, with a particularly prominent ring formed at a radius of 32,000 ly (9.8 kpc) from the core, nicknamed by some astronomers the ring of fire. This ring is hidden from visible light images of the galaxy because it is composed primarily of cold dust, and most of the star formation that is taking place in the Andromeda Galaxy is concentrated there.
Later studies with the help of the Spitzer Space Telescope showed how Andromeda Galaxy's spiral structure in the infrared appears to be composed of two spiral arms that emerge from a central bar and continue beyond the large ring mentioned above. Those arms, however, are not continuous and have a segmented structure.
Close examination of the inner region of the Andromeda Galaxy with the same telescope also showed a smaller dust ring that is believed to have been caused by the interaction with M32 more than 200 million years ago. Simulations show that the smaller galaxy passed through the disk of the Andromeda Galaxy along the latter's polar axis. This collision stripped more than half the mass from the smaller M32 and created the ring structures in Andromeda. It is the co-existence of the long-known large ring-like feature in the gas of Messier 31, together with this newly discovered inner ring-like structure, offset from the barycenter, that suggested a nearly head-on collision with the satellite M32, a milder version of the Cartwheel encounter.
Studies of the extended halo of the Andromeda Galaxy show that it is roughly comparable to that of the Milky Way, with stars in the halo being generally "metal-poor", and increasingly so with greater distance. This evidence indicates that the two galaxies have followed similar evolutionary paths. They are likely to have accreted and assimilated about 100–200 low-mass galaxies during the past 12 billion years. The stars in the extended halos of the Andromeda Galaxy and the Milky Way may extend nearly one third the distance separating the two galaxies.
Nucleus
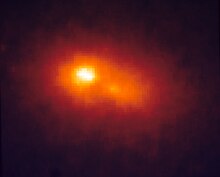

The Andromeda Galaxy is known to harbor a dense and compact star cluster at its very center. In a large telescope it creates a visual impression of a star embedded in the more diffuse surrounding bulge. In 1991, the Hubble Space Telescope was used to image Andromeda Galaxy's inner nucleus. The nucleus consists of two concentrations separated by 1.5 pc (4.9 ly). The brighter concentration, designated as P1, is offset from the center of the galaxy. The dimmer concentration, P2, falls at the true center of the galaxy and contains a black hole measured at 3–5 × 10⁷ M☉ in 1993, and at 1.1–2.3 × 10⁸ M☉ in 2005. The velocity dispersion of material around it is measured to be ≈ 160 km/s (99 mi/s).

It has been proposed that the observed double nucleus could be explained if P1 is the projection of a disk of stars in an eccentric orbit around the central black hole. The eccentricity is such that stars linger at the orbital apocenter, creating a concentration of stars. P2 also contains a compact disk of hot, spectral-class A stars. The A stars are not evident in redder filters, but in blue and ultraviolet light they dominate the nucleus, causing P2 to appear more prominent than P1.
While at the initial time of its discovery it was hypothesized that the brighter portion of the double nucleus is the remnant of a small galaxy "cannibalized" by Andromeda Galaxy, this is no longer considered a viable explanation, largely because such a nucleus would have an exceedingly short lifetime due to tidal disruption by the central black hole. While this could be partially resolved if P1 had its own black hole to stabilize it, the distribution of stars in P1 does not suggest that there is a black hole at its center.
Discrete sources

Apparently, by late 1968, no X-rays had been detected from the Andromeda Galaxy. A balloon flight on 20 October 1970, set an upper limit for detectable hard X-rays from the Andromeda Galaxy. The Swift BAT all-sky survey successfully detected hard X-rays coming from a region centered 6 arcseconds away from the galaxy center. The emission above 25 keV was later found to be originating from a single source named 3XMM J004232.1+411314, and identified as a binary system where a compact object (a neutron star or a black hole) accretes matter from a star.
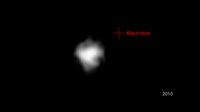
Multiple X-ray sources have since been detected in the Andromeda Galaxy, using observations from the European Space Agency's (ESA) XMM-Newton orbiting observatory. Robin Barnard et al. hypothesized that these are candidate black holes or neutron stars, which are heating the incoming gas to millions of kelvins and emitting X-rays. Neutron stars and black holes can be distinguished mainly by measuring their masses. An observation campaign of NuSTAR space mission identified 40 objects of this kind in the galaxy. In 2012, a microquasar, a radio burst emanating from a smaller black hole was detected in the Andromeda Galaxy. The progenitor black hole is located near the galactic center and has about 10 M☉. It was discovered through data collected by the European Space Agency's XMM-Newton probe and was subsequently observed by NASA's Swift Gamma-Ray Burst Mission and Chandra X-Ray Observatory, the Very Large Array, and the Very Long Baseline Array. The microquasar was the first observed within the Andromeda Galaxy and the first outside of the Milky Way Galaxy.
Globular clusters

There are approximately 460 globular clusters associated with the Andromeda Galaxy. The most massive of these clusters, identified as Mayall II, nicknamed Globular One, has a greater luminosity than any other known globular cluster in the Local Group of galaxies. It contains several million stars, and is about twice as luminous as Omega Centauri, the brightest known globular cluster in the Milky Way. Globular One (or G1) has several stellar populations and a structure too massive for an ordinary globular. As a result, some consider G1 to be the remnant core of a dwarf galaxy that was consumed by Andromeda in the distant past. The globular with the greatest apparent brightness is G76 which is located in the south-west arm's eastern half. Another massive globular cluster, named 037-B327 and discovered in 2006 as is heavily reddened by the Andromeda Galaxy's interstellar dust, was thought to be more massive than G1 and the largest cluster of the Local Group; however, other studies have shown it is actually similar in properties to G1.
Unlike the globular clusters of the Milky Way, which show a relatively low age dispersion, Andromeda Galaxy's globular clusters have a much larger range of ages: from systems as old as the galaxy itself to much younger systems, with ages between a few hundred million years to five billion years.
In 2005, astronomers discovered a completely new type of star cluster in the Andromeda Galaxy. The new-found clusters contain hundreds of thousands of stars, a similar number of stars that can be found in globular clusters. What distinguishes them from the globular clusters is that they are much larger—several hundred light-years across—and hundreds of times less dense. The distances between the stars are, therefore, much greater within the newly discovered extended clusters.
Satellites

Like the Milky Way, the Andromeda Galaxy has satellite galaxies, consisting of over 20 known dwarf galaxies. The best known and most readily observed satellite galaxies are M32 and M110. Based on current evidence, it appears that M32 underwent a close encounter with the Andromeda Galaxy in the past. M32 may once have been a larger galaxy that had its stellar disk removed by M31, and underwent a sharp increase of star formation in the core region, which lasted until the relatively recent past.
M110 also appears to be interacting with the Andromeda Galaxy, and astronomers have found in the halo of the latter a stream of metal-rich stars that appear to have been stripped from these satellite galaxies. M110 does contain a dusty lane, which may indicate recent or ongoing star formation. M32 has a young stellar population as well.
In 2006, it was discovered that nine of the satellite galaxies lie in a plane that intersects the core of the Andromeda Galaxy; they are not randomly arranged as would be expected from independent interactions. This may indicate a common tidal origin for the satellites.
PA-99-N2 event and possible exoplanet in galaxy
PA-99-N2 was a microlensing event detected in the Andromeda Galaxy in 1999. One of the explanations for this is the gravitational lensing of a red giant with a mass between 0.02 and 3.6 masses of the Sun, which suggested that the star is likely a planet. This possible exoplanet would have a mass equivalent to 6.34 times that of Jupiter. If finally confirmed, it would be the first ever found extragalactic planet. However, anomalies in the event were later found.
Collision with the Milky Way
The Andromeda Galaxy is approaching the Milky Way at about 110 kilometres per second (68 miles per second). It has been measured approaching relative to the Sun at around 300 km/s (190 mi/s) as the Sun orbits around the center of the galaxy at a speed of approximately 225 km/s (140 mi/s). This makes the Andromeda Galaxy one of about 100 observable blueshifted galaxies. Andromeda Galaxy's tangential or sideways velocity with respect to the Milky Way is relatively much smaller than the approaching velocity and therefore it is expected to collide directly with the Milky Way in about 4 billion years. A likely outcome of the collision is that the galaxies will merge to form a giant elliptical galaxy or perhaps even a large disc galaxy. Such events are frequent among the galaxies in galaxy groups. The fate of the Earth and the Solar System in the event of a collision is currently unknown. Before the galaxies merge, there is a small chance that the Solar System could be ejected from the Milky Way or join the Andromeda Galaxy.
Amateur observing
The Andromeda Galaxy is the most distant object and the only spiral galaxy outside our Milky Way able to be seen with the naked eye. The galaxy is commonly located in the sky in reference to the constellations Cassiopeia and Pegasus. Andromeda is best seen during autumn nights in the Northern Hemisphere when it passes high overhead, reaching its highest point around midnight in October, and two hours later each successive month. In early evening, it rises in the east in September and sets in the west in February. From the Southern Hemisphere the Andromeda Galaxy is visible between October and December, best viewed from as far north as possible. Binoculars can reveal some larger structures of the galaxy and its two brightest satellite galaxies, M32 and M110. An amateur telescope can reveal Andromeda's disk, some of its brightest globular clusters, dark dust lanes and the large star cloud NGC 206.