Search This Blog

Wednesday, March 31, 2021

Space weather

From Wikipedia, the free encyclopedia
 
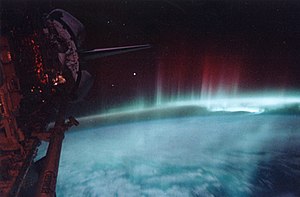
Aurora australis observed from Space Shuttle Discovery, May 1991

Space weather is a branch of space physics and aeronomy, or heliophysics, concerned with the time varying conditions within the Solar System, including the solar wind, emphasizing the space surrounding the Earth, including conditions in the magnetosphere, ionosphere, thermosphere, and exosphere. Space weather is distinct from but conceptually related to the terrestrial weather of the atmosphere of Earth (troposphere and stratosphere). The term space weather was first used in the 1950s and came into common usage in the 1990s.

History

For many centuries, the effects of space weather were noticed but not understood. Displays of auroral light have long been observed at high latitudes.

Genesis

In 1724, George Graham reported that the needle of a magnetic compass was regularly deflected from magnetic north over the course of each day. This effect was eventually attributed to overhead electric currents flowing in the ionosphere and magnetosphere by Balfour Stewart in 1882, and confirmed by Arthur Schuster in 1889 from analysis of magnetic observatory data.

In 1852, astronomer and British Major General Edward Sabine showed that the probability of the occurrence of magnetic storms on Earth was correlated with the number of sunspots, demonstrating a novel solar–terrestrial interaction. In 1859, a great magnetic storm caused brilliant auroral displays and disrupted global telegraph operations. Richard Christopher Carrington correctly connected the storm with a solar flare that he had observed the day before in the vicinity of a large sunspot group, demonstrating that specific solar events could affect the Earth.

Kristian Birkeland explained the physics of aurora by creating artificial aurora in his laboratory, and predicted the solar wind.

The introduction of radio revealed that periods of extreme static or noise occurred. Severe radar jamming during a large solar event in 1942 led to the discovery of solar radio bursts (radio waves which cover a broad frequency range created by a solar flare), another aspect of space weather.

Twentieth century

In the 20th century the interest in space weather expanded as military and commercial systems came to depend on systems affected by space weather. Communications satellites are a vital part of global commerce. Weather satellite systems provide information about terrestrial weather. The signals from satellites of the Global Positioning System (GPS) are used in a wide variety of applications. Space weather phenomena can interfere with or damage these satellites or interfere with the radio signals with which they operate. Space weather phenomena can cause damaging surges in long distance transmission lines and expose passengers and crew of aircraft travel to radiation, especially on polar routes.

The International Geophysical Year (IGY) increased research into space weather. Ground-based data obtained during IGY demonstrated that the aurora occurred in an auroral oval, a permanent region of luminescence 15 to 25 degrees in latitude from the magnetic poles and 5 to 20 degrees wide. In 1958, the Explorer I satellite discovered the Van Allen belts, regions of radiation particles trapped by the Earth's magnetic field. In January 1959, the Soviet satellite Luna 1 first directly observed the solar wind and measured its strength. A smaller International Heliophysical Year (IHY) occurred in 2007–2008.

In 1969, INJUN-5 (a.k.a. Explorer 40) made the first direct observation of the electric field impressed on the Earth's high latitude ionosphere by the solar wind. In the early 1970s, Triad data demonstrated that permanent electric currents flowed between the auroral oval and the magnetosphere.

The term space weather came into usage in the late 1950s as the space age began and satellites began to measure the space environment. The term regained popularity in the 1990s along with the belief that space's impact on human systems demanded a more coordinated research and application framework.

US National Space Weather Program

The purpose of the US National Space Weather Program is to focus research on the needs of the affected commercial and military communities, to connect the research and user communities, to create coordination between operational data centers and to better define user community needs.

The concept was turned into an action plan in 2000, an implementation plan in 2002, an assessment in 2006 and a revised strategic plan in 2010. A revised action plan was scheduled to be released in 2011 followed by a revised implementation plan in 2012.

One part of the National Space Weather Program is to show users that space weather affects their business. Private companies now acknowledge space weather "is a real risk for today's businesses".

Phenomena

Within the Solar System, space weather is influenced by the solar wind and the interplanetary magnetic field (IMF) carried by the solar wind plasma. A variety of physical phenomena are associated with space weather, including geomagnetic storms and substorms, energization of the Van Allen radiation belts, ionospheric disturbances and scintillation of satellite-to-ground radio signals and long-range radar signals, aurora, and geomagnetically induced currents at Earth's surface. Coronal mass ejections (CMEs), their associated shock waves and coronal clouds are also important drivers of space weather as they can compress the magnetosphere and trigger geomagnetic storms. Solar energetic particles (SEP) accelerated by coronal mass ejections or solar flares can trigger solar particle events (SPEs), a critical driver of human impact space weather as they can damage electronics onboard spacecraft (e.g. Galaxy 15 failure), and threaten the lives of astronauts as well as increase radiation hazards to high-altitude, high-latitude aviation.

Effects

Spacecraft electronics

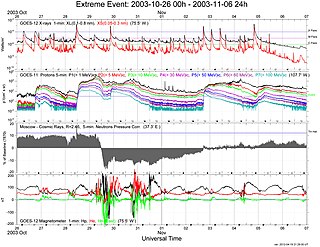
GOES-11 and GOES-12 monitored space weather conditions during the October 2003 solar activity.

Some spacecraft failures can be directly attributed to space weather; many more are thought to have a space weather component. For example, 46 of the 70 failures reported in 2003 occurred during the October 2003 geomagnetic storm. The two most common adverse space weather effects on spacecraft are radiation damage and spacecraft charging.

Radiation (high energy particles) passes through the skin of the spacecraft and into the electronic components. In most cases the radiation causes an erroneous signal or changes one bit in memory of a spacecraft's electronics (single event upsets). In a few cases, the radiation destroys a section of the electronics (single-event latchup).

Spacecraft charging is the accumulation of an electrostatic charge on a non-conducting material on the spacecraft's surface by low energy particles. If enough charge is built up, a discharge (spark) occurs. This can cause an erroneous signal to be detected and acted on by the spacecraft computer. A recent study indicates that spacecraft charging is the predominant space weather effect on spacecraft in geosynchronous orbit.

Spacecraft orbit changes

The orbits of spacecraft in low Earth orbit (LEO) decay to lower and lower altitudes due to the resistance from the friction between the spacecraft's surface (i.e. , drag) and the outer layer of the Earth's atmosphere (a.k.a. the thermosphere and exosphere). Eventually, a LEO spacecraft falls out of orbit and towards the Earth's surface. Many spacecraft launched in the past couple of decades have the ability to fire a small rocket to manage their orbits. The rocket can increase altitude to extend lifetime, to direct the reentry towards a particular (marine) site, or route the satellite to avoid collision with other spacecraft. Such maneuvers require precise information about the orbit. A geomagnetic storm can cause an orbit change over a couple of days that otherwise would occur over a year or more. The geomagnetic storm adds heat to the thermosphere, causing the thermosphere to expand and rise, increasing the drag on spacecraft. The 2009 satellite collision between the Iridium 33 and Cosmos 2251 demonstrated the importance of having precise knowledge of all objects in orbit. Iridium 33 had the capability to maneuver out of the path of Cosmos 2251 and could have evaded the crash, if a credible collision prediction had been available.

Humans in space

The exposure of a human body to ionizing radiation has the same harmful effects whether the source of the radiation is a medical X-ray machine, a nuclear power plant or radiation in space. The degree of the harmful effect depends on the length of exposure and the radiation's energy density. The ever-present radiation belts extend down to the altitude of crewed spacecraft such as the International Space Station (ISS) and the Space Shuttle, but the amount of exposure is within the acceptable lifetime exposure limit under normal conditions. During a major space weather event that includes an SEP burst, the flux can increase by orders of magnitude. Areas within ISS provide shielding that can keep the total dose within safe limits. For the Space Shuttle, such an event would have required immediate mission termination.

Ground systems

Spacecraft signals

The ionosphere bends radio waves in the same manner that water in a swimming pool bends visible light. When the medium through which such waves travel is disturbed, the light image or radio information is distorted and can become unrecognizable. The degree of distortion (scintillation) of a radio wave by the ionosphere depends on the signal frequency. Radio signals in the VHF band (30 to 300 MHz) can be distorted beyond recognition by a disturbed ionosphere. Radio signals in the UHF band (300 MHz to 3 GHz) transit a disturbed ionosphere, but a receiver may not be able to keep locked to the carrier frequency. GPS uses signals at 1575.42 MHz (L1) and 1227.6 MHz (L2) that can be distorted by a disturbed ionosphere. Space weather events that corrupt GPS signals can significantly impact society. For example, the Wide Area Augmentation System (WAAS) operated by the US Federal Aviation Administration (FAA) is used as a navigation tool for North American commercial aviation. It is disabled by every major space weather event. Outages can range from minutes to days. Major space weather events can push the disturbed polar ionosphere 10° to 30° of latitude toward the equator and can cause large ionospheric gradients (changes in density over distance of hundreds of km) at mid and low latitude. Both of these factors can distort GPS signals.

Long-distance radio signals

Radio wave in the HF band (3 to 30 MHz) (also known as the shortwave band) are reflected by the ionosphere. Since the ground also reflects HF waves, a signal can be transmitted around the curvature of the Earth beyond the line of sight. During the 20th century, HF communications was the only method for a ship or aircraft far from land or a base station to communicate. The advent of systems such as Iridium brought other methods of communications, but HF remains critical for vessels that do not carry the newer equipment and as a critical backup system for others. Space weather events can create irregularities in the ionosphere that scatter HF signals instead of reflecting them, preventing HF communications. At auroral and polar latitudes, small space weather events that occur frequently disrupt HF communications. At mid-latitudes, HF communications are disrupted by solar radio bursts, by X-rays from solar flares (which enhance and disturb the ionospheric D-layer) and by TEC enhancements and irregularities during major geomagnetic storms.

Transpolar airline routes are particularly sensitive to space weather, in part because Federal Aviation Regulations require reliable communication over the entire flight. Diverting such a flight is estimated to cost about $100,000.

All passengers in commercial aircraft flying above 26,000 feet (7,900 m) will typically experience some exposure in this aviation radiation environment.

Humans in commercial aviation

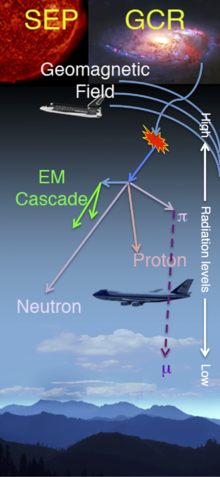
The magnetosphere guides cosmic ray and solar energetic particles to polar latitudes, while high energy charged particles enter the mesosphere, stratosphere, and troposphere. These energetic particles at the top of the atmosphere shatter atmospheric atoms and molecules, creating harmful lower energy particles that penetrate deep into the atmosphere and create measurable radiation. All aircraft flying above 8 km (26,200 feet) altitude are exposed to these particles. The dose exposure is greater in polar regions than at mid-latitude and equatorial regions. Many commercial aircraft fly over the polar region. When a space weather event causes radiation exposure to exceed the safe level set by aviation authorities, the aircraft's flight path is diverted.

While the most significant, but highly unlikely, health consequences to atmospheric radiation exposure include death from cancer due to long-term exposure, many lifestyle-degrading and career-impacting cancer forms can also occur. A cancer diagnosis can have significant career impact for a commercial pilot. A cancer diagnosis can ground a pilot temporarily or permanently. International guidelines from the International Commission on Radiological Protection (ICRP) have been developed to mitigate this statistical risk. The ICRP recommends effective dose limits of a 5-year average of 20 mSv per year with no more than 50 mSv in a single year for non-pregnant, occupationally exposed persons, and 1 mSv per year for the general public. Radiation dose limits are not engineering limits. In the U.S., they are treated as an upper limit of acceptability and not a regulatory limit.

Measurements of the radiation environment at commercial aircraft altitudes above 8 km (26,000 ft) have historically been done by instruments that record the data on board where the data are then processed later on the ground. However, a system of real-time radiation measurements on-board aircraft has been developed through the NASA Automated Radiation Measurements for Aerospace Safety (ARMAS) program. ARMAS has flown hundreds of flights since 2013, mostly on research aircraft, and sent the data to the ground through Iridium satellite links. The eventual goal of these types of measurements is to data assimilate them into physics-based global radiation models, e.g., NASA's Nowcast of Atmospheric Ionizing Radiation System (NAIRAS), so as to provide the weather of the radiation environment rather than the climatology.

Ground-induced electric fields

Magnetic storm activity can induce geoelectric fields in the Earth's conducting lithosphere. Corresponding voltage differentials can find their way into electric power grids through ground connections, driving uncontrolled electric currents that interfere with grid operation, damage transformers, trip protective relays and sometimes cause blackouts. This complicated chain of causes and effects was demonstrated during the magnetic storm of March 1989, which caused the complete collapse of the Hydro-Québec electric-power grid in Canada, temporarily leaving nine million people without electricity. The possible occurrence of an even more intense storm led to operational standards intended to mitigate induction-hazard risks, while reinsurance companies commissioned revised risk assessments.

Geophysical exploration

Air- and ship-borne magnetic surveys can be affected by rapid magnetic field variations during geomagnetic storms. Such storms cause data interpretation problems because the space-weather-related magnetic field changes are similar in magnitude to those of the sub-surface crustal magnetic field in the survey area. Accurate geomagnetic storm warnings, including an assessment of storm magnitude and duration allows for an economic use of survey equipment.

Geophysics and hydrocarbon production

For economic and other reasons, oil and gas production often involves horizontal drilling of well paths many kilometers from a single wellhead. Accuracy requirements are strict, due to target size – reservoirs may only be a few tens to hundreds of meters across – and safety, because of the proximity of other boreholes. The most accurate gyroscopic method is expensive, since it can stop drilling for hours. An alternative is to use a magnetic survey, which enables measurement while drilling (MWD). Near real-time magnetic data can be used to correct drilling direction. Magnetic data and space weather forecasts can help to clarify unknown sources of drilling error.

Terrestrial weather

The amount of energy entering the troposphere and stratosphere from space weather phenomena is trivial compared to the solar insolation in the visible and infra-red portions of the solar electromagnetic spectrum. Although some linkage between the 11-year sunspot cycle and the Earth's climate has been claimed, this has never been verified. For example, the Maunder minimum, a 70-year period almost devoid of sunspots, has often been suggested to be correlated to a cooler climate, but these correlations have disappeared after deeper studies. The suggested link from changes in cosmic ray flux cause changes in the amount of cloud formation. did not survive scientific tests. Another suggestion, that variations in the EUV flux subtly influence existing drivers of the climate and tip the balance between El Niño/La Niña events. collapsed when new research showed this was not possible. As such, a linkage between space weather and the climate has not been demonstrated.

Observation

Observation of space weather is done both for scientific research and for applications. Scientific observation has evolved with the state of knowledge, while application-related observation expanded with the ability to exploit such data.

Ground-based

Space weather is monitored at ground level by observing changes in the Earth's magnetic field over periods of seconds to days, by observing the surface of the Sun and by observing radio noise created in the Sun's atmosphere.

The Sunspot Number (SSN) is the number of sunspots on the Sun's photosphere in visible light on the side of the Sun visible to an Earth observer. The number and total area of sunspots are related to the brightness of the Sun in the extreme ultraviolet (EUV) and X-ray portions of the solar spectrum and to solar activity such as solar flares and coronal mass ejections (CMEs).

10.7 cm radio flux (F10.7) is a measurement of RF emissions from the Sun and is approximately correlated with the solar EUV flux. Since this RF emission is easily obtained from the ground and EUV flux is not, this value has been measured and disseminated continuously since 1947. The world standard measurements are made by the Dominion Radio Astrophysical Observatory at Penticton, B.C., Canada and reported once a day at local noon in solar flux units (10−22W·m−2·Hz−1). F10.7 is archived by the National Geophysical Data Center.

Fundamental space weather monitoring data are provided by ground-based magnetometers and magnetic observatories. Magnetic storms were first discovered by ground-based measurement of occasional magnetic disturbance. Ground magnetometer data provide real-time situational awareness for post-event analysis. Magnetic observatories have been in continuous operations for decades to centuries, providing data to inform studies of long-term changes in space climatology.

Dst index is an estimate of the magnetic field change at the Earth's magnetic equator due to a ring of electric current at and just earthward of the geosynchronous orbit. The index is based on data from four ground-based magnetic observatories between 21° and 33° magnetic latitude during a one-hour period. Stations closer to the magnetic equator are not used due to ionospheric effects. The Dst index is compiled and archived by the World Data Center for Geomagnetism, Kyoto.

Kp/ap Index: 'a' is an index created from the geomagnetic disturbance at one mid-latitude (40° to 50° latitude) geomagnetic observatory during a 3-hour period. 'K' is the quasi-logarithmic counterpart of the 'a' index. Kp and ap are the average of K and a over 13 geomagnetic observatories to represent planetary-wide geomagnetic disturbances. The Kp/ap index indicates both geomagnetic storms and substorms (auroral disturbance). Kp/ap is available from 1932 onward.

AE index is compiled from geomagnetic disturbances at 12 geomagnetic observatories in and near the auroral zones and is recorded at 1-minute intervals. The public AE index is available with a lag of two to three days that limits its utility for space weather applications. The AE index indicates the intensity of geomagnetic substorms except during a major geomagnetic storm when the auroral zones expand equatorward from the observatories.

Radio noise bursts are reported by the Radio Solar Telescope Network to the U.S. Air Force and to NOAA. The radio bursts are associated with solar flare plasma that interacts with the ambient solar atmosphere.

The Sun's photosphere is observed continuously for activity that can be the precursors to solar flares and CMEs. The Global Oscillation Network Group (GONG) project monitors both the surface and the interior of the Sun by using helioseismology, the study of sound waves propagating through the Sun and observed as ripples on the solar surface. GONG can detect sunspot groups on the far side of the Sun. This ability has recently been verified by visual observations from the STEREO spacecraft.

Neutron monitors on the ground indirectly monitor cosmic rays from the Sun and galactic sources. When cosmic rays interact with the atmosphere, atomic interactions occur that cause a shower of lower energy particles to descend into the atmosphere and to ground level. The presence of cosmic rays in the near-Earth space environment can be detected by monitoring high energy neutrons at ground level. Small fluxes of cosmic rays are present continuously. Large fluxes are produced by the Sun during events related to energetic solar flares.

Total Electron Content (TEC) is a measure of the ionosphere over a given location. TEC is the number of electrons in a column one meter square from the base of the ionosphere (approximately 90 km altitude) to the top of the ionosphere (approximately 1000 km altitude). Many TEC measurements are made by monitoring the two frequencies transmitted by GPS spacecraft. Presently GPS TEC is monitored and distributed in real time from more than 360 stations maintained by agencies in many countries.

Geoeffectiveness is a measure of how strongly space weather magnetic fields, such as coronal mass ejections, couple with the Earth's magnetic field. This is determined by the direction of the magnetic field held within the plasma that originates from the Sun. New techniques measuring Faraday Rotation in radio waves are in development to measure field direction.

Satellite-based

A host of research spacecraft have explored space weather. The Orbiting Geophysical Observatory series were among the first spacecraft with the mission of analyzing the space environment. Recent spacecraft include the NASA-ESA Solar-Terrestrial Relations Observatory (STEREO) pair of spacecraft launched in 2006 into solar orbit and the Van Allen Probes, launched in 2012 into a highly elliptical Earth-orbit. The two STEREO spacecraft drift away from the Earth by about 22° per year, one leading and the other trailing the Earth in its orbit. Together they compile information about the solar surface and atmosphere in three dimensions. The Van Allen probes record detailed information about the radiation belts, geomagnetic storms and the relationship between the two.

Some spacecraft with other primary missions have carried auxiliary instruments for solar observation. Among the earliest such spacecraft were the Applications Technology Satellite (ATS) series at GEO that were precursors to the modern Geostationary Operational Environmental Satellite (GOES) weather satellite and many communication satellites. The ATS spacecraft carried environmental particle sensors as auxiliary payloads and had their navigational magnetic field sensor used for sensing the environment.

Many of the early instruments were research spacecraft that were re-purposed for space weather applications. One of the first of these was the IMP-8 (Interplanetary Monitoring Platform). It orbited the Earth at 35 Earth radii and observed the solar wind for two-thirds of its 12-day orbits from 1973 to 2006. Since the solar wind carries disturbances that affect the magnetosphere and ionosphere, IMP-8 demonstrated the utility of continuous solar wind monitoring. IMP-8 was followed by ISEE-3, which was placed near the L1 Sun-Earth Lagrangian point, 235 Earth radii above the surface (about 1.5 million km, or 924,000 miles) and continuously monitored the solar wind from 1978 to 1982. The next spacecraft to monitor the solar wind at the L1 point was WIND from 1994 to 1998. After April 1998, the WIND spacecraft orbit was changed to circle the Earth and occasionally pass the L1 point. The NASA Advanced Composition Explorer (ACE) has monitored the solar wind at the L1 point from 1997 to present.

In addition to monitoring the solar wind, monitoring the Sun is important to space weather. Because the solar EUV cannot be monitored from the ground, the joint NASA-ESA Solar and Heliospheric Observatory (SOHO) spacecraft was launched and has provided solar EUV images beginning in 1995. SOHO is a main source of near-real time solar data for both research and space weather prediction and inspired the STEREO mission. The Yohkoh spacecraft at LEO observed the Sun from 1991 to 2001 in the X-ray portion of the solar spectrum and was useful for both research and space weather prediction. Data from Yohkoh inspired the Solar X-ray Imager on GOES.

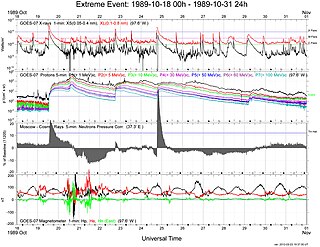
GOES-7 monitors space weather conditions during the October 1989 solar activity resulted in a Forbush Decrease, Ground Level Enhancements, and many satellite anomalies.

Spacecraft with instruments whose primary purpose is to provide data for space weather predictions and applications include the Geostationary Operational Environmental Satellite (GOES) series of spacecraft, the POES series, the DMSP series, and the Meteosat series. The GOES spacecraft have carried an X-ray sensor (XRS) which measures the flux from the whole solar disk in two bands – 0.05 to 0.4 nm and 0.1 to 0.8 nm – since 1974, an X-ray imager (SXI) since 2004, a magnetometer which measures the distortions of the Earth's magnetic field due to space weather, a whole disk EUV sensor since 2004, and particle sensors (EPS/HEPAD) which measure ions and electrons in the energy range of 50 keV to 500 MeV. Starting sometime after 2015, the GOES-R generation of GOES spacecraft will replace the SXI with a solar EUV image (SUVI) similar to the one on SOHO and STEREO and the particle sensor will be augmented with a component to extend the energy range down to 30 eV.

The Deep Space Climate Observatory (DSCOVR) satellite is a NOAA Earth observation and space weather satellite that launched in February 2015. Among its features is advance warning of coronal mass ejections.

Models

Space weather models are simulations of the space weather environment. Models use sets of mathematical equations to describe physical processes.

These models take a limited data set and attempt to describe all or part of the space weather environment in or to predict how weather evolves over time. Early models were heuristic; i.e., they did not directly employ physics. These models take less resources than their more sophisticated descendants.

Later models use physics to account for as many phenomena as possible. No model can yet reliably predict the environment from the surface of the Sun to the bottom of the Earth's ionosphere. Space weather models differ from meteorological models in that the amount of input is vastly smaller.

A significant portion of space weather model research and development in the past two decades has been done as part of the Geospace Environmental Model (GEM) program of the National Science Foundation. The two major modeling centers are the Center for Space Environment Modeling (CSEM) and the Center for Integrated Space weather Modeling (CISM). The Community Coordinated Modeling Center (CCMC) at the NASA Goddard Space Flight Center is a facility for coordinating the development and testing of research models, for improving and preparing models for use in space weather prediction and application.

Modeling techniques include (a) magnetohydrodynamics, in which the environment is treated as a fluid, (b) particle in cell, in which non-fluid interactions are handled within a cell and then cells are connected to describe the environment, (c) first principles, in which physical processes are in balance (or equilibrium) with one another, (d) semi-static modeling, in which a statistical or empirical relationship is described, or a combination of multiple methods.

Commercial space weather development

During the first decade of the 21st Century, a commercial sector emerged that engaged in space weather, serving agency, academia, commercial and consumer sectors. Space weather providers are typically smaller companies, or small divisions within a larger company, that provide space weather data, models, derivative products and service distribution.

The commercial sector includes scientific and engineering researchers as well as users. Activities are primarily directed toward the impacts of space weather upon technology. These include, for example:

  • Atmospheric drag on LEO satellites caused by energy inputs into the thermosphere from solar UV, FUV, Lyman-alpha, EUV, XUV, X-ray, and gamma ray photons as well as by charged particle precipitation and Joule heating at high latitudes;
  • Surface and internal charging from increased energetic particle fluxes, leading to effects such as discharges, single event upsets and latch-up, on LEO to GEO satellites;
  • Disrupted GPS signals caused by ionospheric scintillation leading to increased uncertainty in navigation systems such as aviation's Wide Area Augmentation System (WAAS);
  • Lost HF, UHF and L-band radio communications due to ionosphere scintillation, solar flares and geomagnetic storms;
  • Increased radiation to human tissue and avionics from galactic cosmic rays SEP, especially during large solar flares, and possibly bremsstrahlung gamma-rays produced by precipitating radiation belt energetic electrons at altitudes above 8 km;
  • Increased inaccuracy in surveying and oil/gas exploration that uses the Earth's main magnetic field when it is disturbed by geomagnetic storms;
  • Loss of power transmission from GIC surges in the electrical power grid and transformer shutdowns during large geomagnetic storms.

Many of these disturbances result in societal impacts that account for a significant part of the national GDP.

The concept of incentivizing commercial space weather was first suggested by the idea of a Space Weather Economic Innovation Zone discussed by the American Commercial Space Weather Association (ACSWA) in 2015. The establishment of this economic innovation zone would encourage expanded economic activity developing applications to manage the risks space weather and would encourage broader research activities related to space weather by universities. It could encourage U.S. business investment in space weather services and products. It promoted the support of U.S. business innovation in space weather services and products by requiring U.S. government purchases of U.S. built commercial hardware, software, and associated products and services where no suitable government capability pre-exists. It also promoted U.S. built commercial hardware, software, and associated products and services sales to international partners. designate U.S. built commercial hardware, services, and products as “Space Weather Economic Innovation Zone” activities; Finally, it recommended that U.S. built commercial hardware, services, and products be tracked as Space Weather Economic Innovation Zone contributions within agency reports. In 2015 the U.S. Congress bill HR1561 provided groundwork where social and environmental impacts from a Space Weather Economic Innovation Zone could be far-reaching. In 2016, the Space Weather Research and Forecasting Act (S. 2817) was introduced to build on that legacy. Later, in 2017-2018 the HR3086 Bill took these concepts, included the breadth of material from parallel agency studies as part of the OSTP-sponsored Space Weather Action Program (SWAP), and with bicameral and bipartisan support the 116th Congress (2019) is considering passage of the Space Weather Coordination Act (S141, 115th Congress).

American Commercial Space Weather Association

On April 29, 2010, the commercial space weather community created the American Commercial Space Weather Association (ACSWA) an industry association. ACSWA promotes space weather risk mitigation for national infrastructure, economic strength and national security. It seeks to:

  • provide quality space weather data and services to help mitigate risks to technology;
  • provide advisory services to government agencies;
  • provide guidance on the best task division between commercial providers and government agencies;
  • represent the interests of commercial providers;
  • represent commercial capabilities in the national and international arena;
  • develop best-practices.

A summary of the broad technical capabilities in space weather that are available from the association can be found on their web site http://www.acswa.us.

Notable events

  • On December 21, 1806, Alexander von Humboldt observed that his compass had become erratic during a bright auroral event.
  • The Solar storm of 1859 (Carrington Event) caused widespread disruption of telegraph service.
  • The Aurora of November 17, 1882 disrupted telegraph service.
  • The May 1921 geomagnetic storm, one of the largest geomagnetic storms disrupted telegraph service and damaged electrical equipment worldwide.
  • The Solar storm of August 1972, a large SEP event occurred. If astronauts had been in space at the time, the dose could have been life-threatening.
  • The March 1989 geomagnetic storm included multiple space weather effects: SEP, CME, Forbush decrease, ground level enhancement, geomagnetic storm, etc..
  • The 2000 Bastille Day event coincided with exceptionally bright aurora.
  • April 21, 2002, the Nozomi Mars Probe was hit by a large SEP event that caused large-scale failure. The mission, which was already about 3 years behind schedule, was abandoned in December 2003.
Van Allen radiation belt

From Wikipedia, the free encyclopedia
 
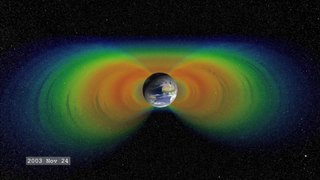
This CGI video illustrates changes in the shape and intensity of a cross section of the Van Allen belts.
 
A cross section of Van Allen radiation belts

A Van Allen radiation belt is a zone of energetic charged particles, most of which originate from the solar wind, that are captured by and held around a planet by that planet's magnetic field. Earth has two such belts, and sometimes others may be temporarily created. The belts are named after James Van Allen, who is credited with their discovery. Earth's two main belts extend from an altitude of about 640 to 58,000 km (400 to 36,040 mi) above the surface, in which region radiation levels vary. Most of the particles that form the belts are thought to come from solar wind and other particles by cosmic rays. By trapping the solar wind, the magnetic field deflects those energetic particles and protects the atmosphere from destruction.

The belts are in the inner region of Earth's magnetosphere. The belts trap energetic electrons and protons. Other nuclei, such as alpha particles, are less prevalent. The belts endanger satellites, which must have their sensitive components protected with adequate shielding if they spend significant time near that zone. In 2013, NASA reported that the Van Allen Probes had discovered a transient, third radiation belt, which was observed for four weeks until it was destroyed by a powerful, interplanetary shock wave from the Sun.

Discovery

Kristian Birkeland, Carl Størmer, Nicholas Christofilos, and Enrico Medi had investigated the possibility of trapped charged particles before the Space Age. Explorer 1 and Explorer 3 confirmed the existence of the belt in early 1958 under James Van Allen at the University of Iowa. The trapped radiation was first mapped by Explorer 4, Pioneer 3, and Luna 1.

The term Van Allen belts refers specifically to the radiation belts surrounding Earth; however, similar radiation belts have been discovered around other planets. The Sun does not support long-term radiation belts, as it lacks a stable, global, dipole field. The Earth's atmosphere limits the belts' particles to regions above 200–1,000 km, (124–620 miles) while the belts do not extend past 8 Earth radii RE. The belts are confined to a volume which extends about 65° on either side of the celestial equator.

Research

Jupiter's variable radiation belts

The NASA Van Allen Probes mission aims at understanding (to the point of predictability) how populations of relativistic electrons and ions in space form or change in response to changes in solar activity and the solar wind. NASA Institute for Advanced Concepts–funded studies have proposed magnetic scoops to collect antimatter that naturally occurs in the Van Allen belts of Earth, although only about 10 micrograms of antiprotons are estimated to exist in the entire belt.

The Van Allen Probes mission successfully launched on August 30, 2012. The primary mission was scheduled to last two years with expendables expected to last four. The probes were deactivated in 2019 after running out of fuel and are expected to deorbit during the 2030s. NASA's Goddard Space Flight Center manages the Living With a Star program — of which the Van Allen Probes are a project, along with Solar Dynamics Observatory (SDO). The Applied Physics Laboratory is responsible for the implementation and instrument management for the Van Allen Probes.

Radiation belts exist around other planets and moons in the solar system that have magnetic fields powerful enough to sustain them. To date, most of these radiation belts have been poorly mapped. The Voyager Program (namely Voyager 2) only nominally confirmed the existence of similar belts around Uranus and Neptune.

Geomagnetic storms can cause electron density to increase or decrease relatively quickly (i.e., approximately one day or less). Longer-timescale processes determine the overall configuration of the belts. After electron injection increases electron density, electron density is often observed to decay exponentially. Those decay time constants are called "lifetimes." Measurements from the Van Allen Probe B's Magnetic Electron Ion Spectrometer (MagEIS) show long electron lifetimes (i.e., longer than 100 days) in the inner belt; short electron lifetimes of around one or two days are observed in the "slot" between the belts; and energy-dependent electron lifetimes of roughly five to 20 days are found in the outer belt.

Inner belt

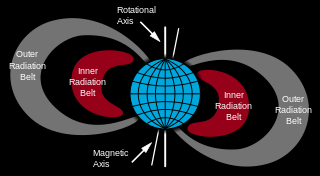
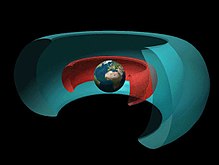
Cutaway drawing of two radiation belts around Earth: the inner belt (red) dominated by protons and the outer one (blue) by electrons. Image Credit: NASA

The inner Van Allen Belt extends typically from an altitude of 0.2 to 2 Earth radii (L values of 1 to 3) or 1,000 km (620 mi) to 12,000 km (7,500 mi) above the Earth. In certain cases, when solar activity is stronger or in geographical areas such as the South Atlantic Anomaly, the inner boundary may decline to roughly 200 km above the Earth's surface. The inner belt contains high concentrations of electrons in the range of hundreds of keV and energetic protons with energies exceeding 100 MeV — trapped by the relatively strong magnetic fields in the region (as compared to the outer belt).

It is believed that proton energies exceeding 50 MeV in the lower belts at lower altitudes are the result of the beta decay of neutrons created by cosmic ray collisions with nuclei of the upper atmosphere. The source of lower energy protons is believed to be proton diffusion, due to changes in the magnetic field during geomagnetic storms.

Due to the slight offset of the belts from Earth's geometric center, the inner Van Allen belt makes its closest approach to the surface at the South Atlantic Anomaly.

In March 2014, a pattern resembling "zebra stripes" was observed in the radiation belts by the Radiation Belt Storm Probes Ion Composition Experiment (RBSPICE) onboard Van Allen Probes. The initial theory proposed in 2014 was that — due to the tilt in Earth's magnetic field axis — the planet's rotation generated an oscillating, weak electric field that permeates through the entire inner radiation belt. A 2016 study instead concluded that the zebra stripes were an imprint of ionospheric winds on radiation belts.

Outer belt

Laboratory simulation of the Van Allen belt's influence on the Solar Wind; these aurora-like Birkeland currents were created by the scientist Kristian Birkeland in his terrella, a magnetized anode globe in an evacuated chamber

The outer belt consists mainly of high-energy (0.1–10 MeV) electrons trapped by the Earth's magnetosphere. It is more variable than the inner belt, as it is more easily influenced by solar activity. It is almost toroidal in shape, beginning at an altitude of 3 Earth radii and extending to 10 Earth radii (RE) — 13,000 to 60,000 kilometres (8,100 to 37,300 mi) above the Earth's surface. Its greatest intensity is usually around 4 to 5 RE. The outer electron radiation belt is mostly produced by the inward radial diffusion and local acceleration due to transfer of energy from whistler-mode plasma waves to radiation belt electrons. Radiation belt electrons are also constantly removed by collisions with Earth's atmosphere, losses to the magnetopause, and their outward radial diffusion. The gyroradii of energetic protons would be large enough to bring them into contact with the Earth's atmosphere. Within this belt, the electrons have a high flux and at the outer edge (close to the magnetopause), where geomagnetic field lines open into the geomagnetic "tail", the flux of energetic electrons can drop to the low interplanetary levels within about 100 km (62 mi) — a decrease by a factor of 1,000.

In 2014, it was discovered that the inner edge of the outer belt is characterized by a very sharp transition, below which highly relativistic electrons (> 5MeV) cannot penetrate. The reason for this shield-like behavior is not well understood.

The trapped particle population of the outer belt is varied, containing electrons and various ions. Most of the ions are in the form of energetic protons, but a certain percentage are alpha particles and O+ oxygen ions — similar to those in the ionosphere but much more energetic. This mixture of ions suggests that ring current particles probably originate from more than one source.

The outer belt is larger than the inner belt, and its particle population fluctuates widely. Energetic (radiation) particle fluxes can increase and decrease dramatically in response to geomagnetic storms, which are themselves triggered by magnetic field and plasma disturbances produced by the Sun. The increases are due to storm-related injections and acceleration of particles from the tail of the magnetosphere.

On February 28, 2013, a third radiation belt — consisting of high-energy ultrarelativistic charged particles — was reported to be discovered. In a news conference by NASA's Van Allen Probe team, it was stated that this third belt is a product of coronal mass ejection from the Sun. It has been represented as a separate creation which splits the Outer Belt, like a knife, on its outer side, and exists separately as a storage container of particles for a month's time, before merging once again with the Outer Belt.

The unusual stability of this third, transient belt has been explained as due to a 'trapping' by the Earth's magnetic field of ultrarelativistic particles as they are lost from the second, traditional outer belt. While the outer zone, which forms and disappears over a day, is highly variable due to interactions with the atmosphere, the ultrarelativistic particles of the third belt are thought not to scatter into the atmosphere, as they are too energetic to interact with atmospheric waves at low latitudes. This absence of scattering and the trapping allows them to persist for a long time, finally only being destroyed by an unusual event, such as the shock wave from the Sun.

Flux values

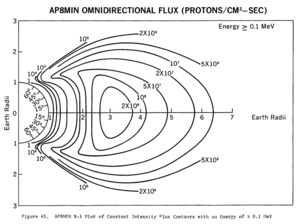
In the belts, at a given point, the flux of particles of a given energy decreases sharply with energy.

At the magnetic equator, electrons of energies exceeding 5000 keV (resp. 5 MeV) have omnidirectional fluxes ranging from 1.2×10⁶ (resp. 3.7×10⁴) up to 9.4×10⁹ (resp. 2×10⁷) particles per square centimeter per second.

The proton belts contain protons with kinetic energies ranging from about 100 keV, which can penetrate 0.6 µm of lead, to over 400 MeV, which can penetrate 143 mm of lead.

Most published flux values for the inner and outer belts may not show the maximum probable flux densities that are possible in the belts. There is a reason for this discrepancy: the flux density and the location of the peak flux is variable, depending primarily on solar activity, and the number of spacecraft with instruments observing the belt in real time has been limited. The Earth has not experienced a solar storm of Carrington event intensity and duration, while spacecraft with the proper instruments have been available to observe the event.

Radiation levels in the belts would be dangerous to humans if they were exposed for an extended period of time. The Apollo missions minimised hazards for astronauts by sending spacecraft at high speeds through the thinner areas of the upper belts, bypassing inner belts completely, except for the Apollo 14 mission where the spacecraft traveled through the heart of the trapped radiation belts.

Antimatter confinement

In 2011, a study confirmed earlier speculation that the Van Allen belt could confine antiparticles. The Payload for Antimatter Matter Exploration and Light-nuclei Astrophysics (PAMELA) experiment detected levels of antiprotons orders of magnitude higher than are expected from normal particle decays while passing through the South Atlantic Anomaly. This suggests the Van Allen belts confine a significant flux of antiprotons produced by the interaction of the Earth's upper atmosphere with cosmic rays. The energy of the antiprotons has been measured in the range from 60 to 750 MeV.

Research funded by the NASA Institute for Advanced Concepts concluded that harnessing these antiprotons for spacecraft propulsion would be feasible. Researchers believed that this approach would have advantages over antiproton generation at CERN, because collecting the particles in situ eliminates transportation losses and costs. Jupiter and Saturn are also possible sources, but the Earth belt is the most productive. Jupiter is less productive than might be expected due to magnetic shielding from cosmic rays of much of its atmosphere. In 2019, CMS announced that the construction of a device that would be capable of collecting these particles has already begun. NASA will use this device to collect these particles and transport them to institutes all around the world for further examination. These so-called "antimatter-containers" could be used for industrial purpose as well in the future.

Implications for space travel

Orbit size comparison of GPS, GLONASS, Galileo, BeiDou-2, and Iridium constellations, the International Space Station, the Hubble Space Telescope, and geostationary orbit (and its graveyard orbit), with the Van Allen radiation belts and the Earth to scale. The Moon's orbit is around 9 times as large as geostationary orbit. (In the SVG file, hover over an orbit or its label to highlight it; click to load its article.)

Spacecraft travelling beyond low Earth orbit enter the zone of radiation of the Van Allen belts. Beyond the belts, they face additional hazards from cosmic rays and solar particle events. A region between the inner and outer Van Allen belts lies at 2 to 4 Earth radii and is sometimes referred to as the "safe zone.”

Solar cells, integrated circuits, and sensors can be damaged by radiation. Geomagnetic storms occasionally damage electronic components on spacecraft. Miniaturization and digitization of electronics and logic circuits have made satellites more vulnerable to radiation, as the total electric charge in these circuits is now small enough so as to be comparable with the charge of incoming ions. Electronics on satellites must be hardened against radiation to operate reliably. The Hubble Space Telescope, among other satellites, often has its sensors turned off when passing through regions of intense radiation. A satellite shielded by 3 mm of aluminium in an elliptic orbit (200 by 20,000 miles (320 by 32,190 km)) passing the radiation belts will receive about 2,500 rem (25 Sv) per year. (For comparison, a full-body dose of 5 Sv is deadly.) Almost all radiation will be received while passing the inner belt.

The Apollo missions marked the first event where humans traveled through the Van Allen belts, which was one of several radiation hazards known by mission planners. The astronauts had low exposure in the Van Allen belts due to the short period of time spent flying through them. Apollo flight trajectories bypassed the inner belts completely, passing through the thinner areas of the outer belts.

Astronauts' overall exposure was actually dominated by solar particles once outside Earth's magnetic field. The total radiation received by the astronauts varied from mission-to-mission but was measured to be between 0.16 and 1.14 rads (1.6 and 11.4 mGy), much less than the standard of 5 rem (50 mSv) per year set by the United States Atomic Energy Commission for people who work with radioactivity.

Causes

It is generally understood that the inner and outer Van Allen belts result from different processes. The inner belt — consisting mainly of energetic protons — is the product of the decay of so-called "albedo" neutrons, which are themselves the result of cosmic ray collisions in the upper atmosphere. The outer belt consists mainly of electrons. They are injected from the geomagnetic tail following geomagnetic storms, and are subsequently energized through wave-particle interactions.

In the inner belt, particles that originate from the Sun are trapped in the Earth's magnetic field. Particles spiral along the magnetic lines of flux as they move "longitudinally" along those lines. As particles move toward the poles, the magnetic field line density increases, and their "longitudinal" velocity is slowed and can be reversed — reflecting the particles and causing them to bounce back and forth between the Earth's poles. In addition to the spiral about and motion along the flux lines, the electrons move slowly in an eastward direction, while the ions move westward.

A gap between the inner and outer Van Allen belts — sometimes called safe zone or safe slot — is caused by the Very Low Frequency (VLF) waves, which scatter particles in pitch angle, which results in the gain of particles to the atmosphere. Solar outbursts can pump particles into the gap, but they drain again in a matter of days. The radio waves were originally thought to be generated by turbulence in the radiation belts, but recent work by James L. Green of the Goddard Space Flight Center — comparing maps of lightning activity collected by the Microlab 1 spacecraft with data on radio waves in the radiation-belt gap from the IMAGE spacecraft — suggests that they are actually generated by lightning within Earth's atmosphere. The generated radio waves strike the ionosphere at the correct angle to pass through only at high latitudes, where the lower ends of the gap approach the upper atmosphere. These results are still under scientific debate.

Proposed removal

Draining the charged particles from the Van Allen belts would open up new orbits for satellites and make travel safer for astronauts.

High Voltage Orbiting Long Tether, or HiVOLT, is a concept proposed by Russian physicist V. V. Danilov and further refined by Robert P. Hoyt and Robert L. Forward for draining and removing the radiation fields of the Van Allen radiation belts that surround the Earth.

Another proposal for draining the Van Allen belts involves beaming very-low-frequency (VLF) radio waves from the ground into the Van Allen belts.

Draining radiation belts around other planets has also been proposed, for example, before exploring Europa, which orbits within Jupiter's radiation belt.

As of 2014, it remains uncertain if there are any negative unintended consequences to removing these radiation belts.

Tuesday, March 30, 2021

United States Patent and Trademark Office

From Wikipedia, the free encyclopedia

United States Patent and Trademark Office
Seal of the United States Patent and Trademark Office.svg
 
Seal of the U.S. Patent and Trademark Office
Usptojamesmadisonbuildingsouthside.jpg
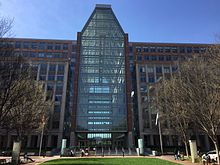
The James Madison building on the campus of the United States Patent and Trademark Office headquarters in Alexandria. This is the largest building on the campus.
Agency overview
FormedJanuary 2, 1975
Washington, D.C., U.S.
HeadquartersAlexandria, Virginia, U.S.
38.801499°N 77.063835°WCoordinates: 38.801499°N 77.063835°W
Employees12,579 (as of Sept 30, 2018)
Agency executives
Parent agencyU.S. Department of Commerce
Websitewww.uspto.gov
United States patent law
Legislation
Types of patent claims
Procedures
Other topics
Relief representing the Patent Office at the Herbert C. Hoover Building

The United States Patent and Trademark Office (USPTO) is an agency in the U.S. Department of Commerce that issues patents to inventors and businesses for their inventions, and trademark registration for product and intellectual property identification.

The USPTO is "unique among federal agencies because it operates solely on fees collected by its users, and not on taxpayer dollars". Its "operating structure is like a business in that it receives requests for services—applications for patents and trademark registrations—and charges fees projected to cover the cost of performing the services [it] provide[s]".

The USPTO is based in Alexandria, Virginia, after a 2005 move from the Crystal City area of neighboring Arlington, Virginia. The offices under Patents and the Chief Information Officer that remained just outside the southern end of Crystal City completed moving to Randolph Square, a brand-new building in Shirlington Village, on April 27, 2009.

The Office is headed by the Under Secretary of Commerce for Intellectual Property and Director of the United States Patent and Trademark Office, a position last held by Andrei Iancu until he left office on January 20, 2021. As of March 2021, Commissioner of Patents Drew Hirshfeld is performing the functions of the Under Secretary and Director in the absence of an appointment or nomination to the positions.

The USPTO cooperates with the European Patent Office (EPO) and the Japan Patent Office (JPO) as one of the Trilateral Patent Offices. The USPTO is also a Receiving Office, an International Searching Authority and an International Preliminary Examination Authority for international patent applications filed in accordance with the Patent Cooperation Treaty.

Mission

The USPTO maintains a permanent, interdisciplinary historical record of all U.S. patent applications in order to fulfill objectives outlined in the United States Constitution. The legal basis for the United States patent system is Article 1, Section 8, wherein the powers of Congress are defined.

Signboard of US Patent Office Sign Alexandria

It states, in part:

The Congress shall have Power ... To promote the Progress of Science and useful Arts, by securing for limited Times to Authors and Inventors the exclusive Right to their respective Writings and Discoveries.

The PTO's mission is to promote "industrial and technological progress in the United States and strengthen the national economy" by:

  • Administering the laws relating to patents and trademarks;
  • Advising the Secretary of Commerce, the President of the United States, and the administration on patent, trademark, and copyright protection; and
  • Providing advice on the trade-related aspects of intellectual property.

Structure

USPTO Madison Building Exterior
 
Interior atrium of the USPTO Madison Building

The USPTO is headquartered at the Alexandria Campus, consisting of 11 buildings in a city-like development surrounded by ground floor retail and high rise residential buildings between the Metro stations of King Street station (the main search building is two blocks due south of the King Street station) and Eisenhower Avenue station where the actual Alexandria Campus is located between Duke Street (on the North) to Eisenhower Avenue (on the South), and between John Carlyle Street (on the East) to Elizabeth Lane (on the West) in Alexandria, Virginia. An additional building in Arlington, Virginia, was opened in 2009.

USPTO satellite office in San Jose, California

The USPTO was expected by 2014 to open its first ever satellite offices in Detroit, Dallas, Denver, and Silicon Valley to reduce backlog and reflect regional industrial strengths. The first satellite office opened in Detroit on July 13, 2012. In 2013, due to the budget sequestration, the satellite office for Silicon Valley, which is home to one of the nation's top patent-producing cities, was put on hold. However, renovation and infrastructure updates continued after the sequestration, and the Silicon Valley location opened in the San Jose City Hall in 2015.

As of September 30, 2009, the end of the U.S. government's fiscal year, the PTO had 9,716 employees, nearly all of whom are based at its five-building headquarters complex in Alexandria. Of those, 6,242 were patent examiners (almost all of whom were assigned to examine utility patents; only 99 were assigned to examine design patents) and 388 were trademark examining attorneys; the rest are support staff. While the agency has noticeably grown in recent years, the rate of growth was far slower in fiscal 2009 than in the recent past; this is borne out by data from fiscal 2005 to the present: As of the end of FY 2018, the USPTO was composed of 12,579 federal employees, including 8,185 patent examiners, 579 trademark examiners, and 3,815 other staff.

At end of FY Employees Patent examiners Trademark examining attorneys
2016 12,725 8,351 570
2009 9,716 6,242 388
2008 9,518 6,055 398
2007 8,913 5,477 404
2006 8,189 4,883 413
2005 7,363 4,258 357

Patent examiners make up the bulk of the employees at USPTO. They hold degrees in various scientific disciplines, but do not necessarily hold law degrees. Unlike patent examiners, trademark examiners must be licensed attorneys.

All examiners work under a strict, "count"-based production system. For every application, "counts" are earned by composing, filing, and mailing a first office action on the merits, and upon disposal of an application.

The Commissioner for Patents oversees three main bodies, headed by former Deputy Commissioner for Patent Operations, currently Peggy Focarino, the Deputy Commissioner for Patent Examination Policy, currently Andrew Hirshfeld as Acting Deputy, and finally the Commissioner for Patent Resources and Planning, which is currently vacant. The Patent Operations of the office is divided into nine different technology centers that deal with various arts.

Prior to 2012, decisions of patent examiners could be appealed to the Board of Patent Appeals and Interferences, an administrative law body of the USPTO. Decisions of the BPAI could further be appealed to the United States Court of Appeals for the Federal Circuit, or a civil suit could be brought against the Commissioner of Patents in the United States District Court for the Eastern District of Virginia. The United States Supreme Court may ultimately decide on a patent case. Under the America Invents Act, the BPAI was converted to the Patent Trial and Appeal Board or "PTAB".

Similarly, decisions of trademark examiners may be appealed to the Trademark Trial and Appeal Board, with subsequent appeals directed to the Federal Circuit, or a civil action may also be brought.

In recent years, the USPTO has seen increasing delays between when a patent application is filed and when it issues. To address its workload challenges, the USPTO has undertaken an aggressive program of hiring and recruitment. The USPTO hired 1,193 new patent examiners in Fiscal Year 2006 (year ending September 30, 2006), 1,215 new examiners in fiscal 2007, and 1,211 in fiscal year 2008. The USPTO expected to continue hiring patent examiners at a rate of approximately 1,200 per year through 2012; however, due to a slowdown in new application filings since the onset of the late-2000s economic crisis, and projections of substantial declines in maintenance fees in coming years, the agency imposed a hiring freeze in early March 2009.

In 2006, USPTO instituted a new training program for patent examiners called the "Patent Training Academy". It is an eight-month program designed to teach new patent examiners the fundamentals of patent law, practice and examination procedure in a college-style environment. Because of the impending USPTO budget crisis previously alluded to, it had been rumored that the Academy would be closed by the end of 2009. Focarino, then Acting Commissioner for Patents, denied in a May 2009 interview that the Academy was being shut down, but stated that it would be cut back because the hiring goal for new examiners in fiscal 2009 was reduced to 600. Ultimately, 588 new patent examiners were hired in fiscal year 2009.

In 2016, the USPTO partnered with the Girl Scouts of the USA to create an "Intellectual Property Patch" merit badge, which is awarded to Girl Scouts at four different levels.

Fee diversion

For many years, Congress has "diverted" about 10% of the fees that the USPTO collected into the general treasury of the United States. In effect, this took money collected from the patent system to use for the general budget. This fee diversion has been generally opposed by patent practitioners (e.g., patent attorneys and patent agents), inventors, the USPTO, as well as former federal judge Paul R. Michel. These stakeholders would rather use the funds to improve the patent office and patent system, such as by implementing the USPTO's 21st Century Strategic Plan. The last six annual budgets of the George W. Bush administration did not propose to divert any USPTO fees, and the first budget of the Barack Obama administration continues this practice; however, stakeholders continue to press for a permanent end to fee diversion.

The discussion of which party can appropriate the fees is more than a financial question. Patent fees represent a policy lever that influences both the number of applications submitted to the office as well as their quality.

Patents

First United States patent
 
The National Inventors Hall of Fame is housed in the Madison Building of the USPTO.
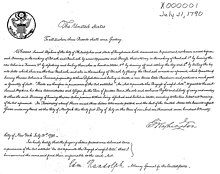
  • On July 31, 1790, the first U.S. patent was issued to Samuel Hopkins for an improvement "in the making of Pot ash and Pearl ash by a new Apparatus and Process". This patent was signed by then President George Washington.
  • The X-Patents (the first 10,280 issued between 1790 and 1836) were destroyed by a fire; fewer than 3,000 of those have been recovered and re-issued with numbers that include an "X". The X generally appears at the end of the numbers hand-written on full-page patent images; however, in patent collections and for search purposes, the X is considered to be the patent type – analogous to the "D" of design patents – and appears at the beginning of the number. The X distinguishes the patents from those issued after the fire, which began again with patent number 1.
  • Each year, the PTO issues over 150,000 patents to companies and individuals worldwide. As of December  2011, the PTO has granted 8,743,423 patents and has received 16,020,302 applications.
  • On June 19, 2018, the 10 millionth U.S. patent was issued to Joseph Marron for invention of a "Coherent LADAR [System] Using Intra-Pixel Quadrature Detection" to improve laser detection and ranging (LADAR). The patent was the first to receive the newly redesigned patent cover. It was signed by President Donald Trump during a special ceremony at the Oval Office.

Trademarks

The USPTO examines applications for trademark registration, which can be filed under five different filing bases: use in commerce, intent to use, foreign application, foreign registration, or international registration. If approved, the trademarks are registered on either the Principal Register or the Supplemental Register, depending upon whether the mark meets the appropriate distinctiveness criteria. This federal system governs goods and services distributed via interstate commerce, and operates alongside state level trademark registration systems.

Trademark applications have grown substantially in recent years, jumping from 296,490 new applications in 2000, to 345,000 new applications in 2014, to 458,103 new applications in 2018. Recent growth driven partially by growing numbers of trademark applications originating in China; trademark applications from China have grown more than 12-fold since 2013, and in 2017, one in every nine trademark applications reviewed by the U.S. Trademark Office originated in China.

Since 2008, the Trademark Office has hosted a National Trademark Expo every two years, billing it as "a free, family-friendly event designed to educate the public about trademarks and their importance in the global marketplace." The Expo features celebrity speakers such as Anson Williams (of the television show Happy Days) and basketball player Kareem Abdul-Jabbar and has numerous trademark-holding companies as exhibitors. Before the 2009 National Trademark Expo, the trademark office designed and launched a kid-friendly trademark mascot known as T. Markey, who appears as an anthropomorphized registered trademark symbol. T. Markey is featured prominently on the Kids section of the USPTO website, alongside fellow IP mascots Ms. Pat Pending (with her robot cat GeaRS) and Mark Trademan.

In 2020, trademark applications marked the sharpest declines and inclines in American history. During Spring, COVID-19 pandemic lockdowns led to reduced filings, which then increased in July 2020 to exceed the previous year. August 2020 was subsequently the highest month of trademark filings in the history of the U.S. Patent and Trademark Office.

Representation

The USPTO only allows certain qualified persons to practice before the USPTO. Practice includes filing of patent and trademark applications on behalf of individuals and companies, prosecuting the patent and trademark applications, and participating in administrative appeals and other proceedings before the PTO examiners, examining attorneys and boards. The USPTO sets its own standards for who may practice. Any person who practices patent law before the USPTO must become a registered patent attorney or agent. A patent agent is a person who has passed the USPTO registration examination (the "patent bar") but has not passed any state bar exam to become a licensed attorney; a patent attorney is a person who has passed both a state bar and the patent bar and is in good standing as an attorney. A patent agent can only act in a representative capacity in patent matters presented to the USPTO, and may not represent a patent holder or applicant in a court of law. To be eligible for taking the patent bar exam, a candidate must possess a degree in "engineering or physical science or the equivalent of such a degree". Any person who practice trademark law before the USPTO must be an active member in good standing of the highest court of any state.

The United States allows any citizen from any country to sit for the patent bar (if he/she has the requisite technical background). Only Canada has a reciprocity agreement with the United States that confers upon a patent agent similar rights.

An unrepresented inventor may file a patent application and prosecute it on his or her own behalf (pro se). If it appears to a patent examiner that an inventor filing a pro se application is not familiar with the proper procedures of the Patent Office, the examiner may suggest that the filing party obtain representation by a registered patent attorney or patent agent. The patent examiner cannot recommend a specific attorney or agent, but the Patent Office does post a list of those who are registered.

While the inventor of a relatively simple-to-describe invention may well be able to produce an adequate specification and detailed drawings, there remains language complexity in what is claimed, either in the particular claim language of a utility application, or in the manner in which drawings are presented in a design application. There is also skill required when searching for prior art that is used to support the application and to prevent applying for a patent for something that may be unpatentable. A patent examiner will make special efforts to help pro se inventors understand the process but the failure to adequately understand or respond to an Office action from the USPTO can endanger the inventor's rights, and may lead to abandonment of the application.

Electronic filing system

The USPTO accepts patent applications filed in electronic form. Inventors or their patent agents/attorneys can file applications as Adobe PDF documents. Filing fees can be paid by credit card or by a USPTO "deposit account".

Patent search tools

The lobby of the Public Search Facility, looking out toward the atrium, inside the Madison Building of the USPTO. The bronze bust of Thomas Jefferson is at the far right. Researchers can access patent search databases within the facility.

The USPTO web site provides free electronic copies of issued patents and patent applications as multiple-page TIFF (graphic) documents. The site also provides Boolean search and analysis tools.

The USPTO's free distribution service only distributes the patent documents as a set of TIFF files. Numerous free and commercial services provide patent documents in other formats, such as Adobe PDF and CPC.

Criticisms

The USPTO has been criticized for granting patents for impossible or absurd, already known, or arguably obvious inventions. Economists have documented that, although the USPTO makes mistakes when granting patents, these mistakes might be less prominent than some might believe.

Controversial patents

  • U.S. Patent 5,443,036, "Method of exercising a cat", covers having a cat chase the beam from a laser pointer. The patent has been criticized as being obvious.
  • U.S. Patent 6,004,596, "Sealed crustless sandwich", issued in 1999, covers the design of a sandwich with crimped edges. However, all claims of the patent were subsequently canceled by the PTO upon reexamination.
  • U.S. Patent 6,025,810, "Hyper-light-speed antenna", an antenna that sends signals faster than the speed of light. According to the description in the patent, "The present invention takes a transmission of energy, and instead of sending it through normal time and space, it pokes a small hole into another dimension, thus, sending the energy through a place which allows transmission of energy to exceed the speed of light."
  • U.S. Patent 6,368,227, "Method of swinging on a swing", issued April 9, 2002, was granted to a seven-year-old boy, whose father, a patent attorney, wanted to demonstrate how the patent system worked to his son who was five years old at the time of the application. The PTO initially rejected it due to prior art, but eventually issued the patent. However, all claims of the patent were subsequently canceled by the PTO upon reexamination.
  • U.S. Patent 6,960,975, "Space vehicle propelled by the pressure of inflationary vacuum state", describes an anti-gravity device. In November 2005, the USPTO was criticized by physicists for granting it. The journal Nature first highlighted this patent issued for a device that presumably amounts to a perpetual motion machine, defying the laws of physics. The device comprises a particular electrically superconducting shield and electromagnetic generating device. The examiner allowed the claims because the design of the shield and device was novel and not obvious. In situations such as this where a substantial question of patentability is raised after a patent issues, the Commissioner of the Patent Office can order a reexamination of the patent.

Controversial trademarks

Slow patent examination and backlog

US Patents Issued per year, 1790–2008

The USPTO has been criticized for taking an inordinate amount of time in examining patent applications. This is particularly true in the fast-growing area of business method patents. As of 2005, patent examiners in the business method area were still examining patent applications filed in 2001.

The delay was attributed by spokesmen for the Patent Office to a combination of a sudden increase in business method patent filings after the 1998 State Street Bank decision, the unfamiliarity of patent examiners with the business and financial arts (e.g., banking, insurance, stock trading etc.), and the issuance of a number of controversial patents (e.g., U.S. Patent 5,960,411 "Amazon one click patent") in the business method area.

Effective August 2006, the USPTO introduced an accelerated patent examination procedure in an effort to allow inventors a speedy evaluation of an application with a final disposition within twelve months. The procedure requires additional information to be submitted with the application and also includes an interview with the examiner. The first accelerated patent was granted on March 15, 2007, with a six-month issuance time.

As of the end of 2008, there were 1,208,076 patent applications pending at the Patent Office. At the end of 1997, the number of applications pending was 275,295. Therefore, over those eleven years there was a 439% increase in the number of pending applications.

December 2012 data showed that there was 597,579 unexamined patent application backlog. During the four years since 2009, more than 50% reduction was achieved. First action pendency was reported as 19.2 months.

Telework program fraud allegations

In 2012, the USPTO initiated an internal investigation into allegations of fraud in the telework program, which allowed employees to work from home. Investigators discovered that some patent examiners had lied about the hours they had worked, but high level officials prevented access to computer records, thus limiting the number of employees who could be punished.

Butane

From Wikipedia, the free encyclopedia ...