


Tides are the rise and fall of sea levels caused by the combined effects of the gravitational forces exerted by the Moon and the Sun, and the rotation of the Earth.
Tide tables can be used for any given locale to find the predicted times and amplitude (or "tidal range"). The predictions are influenced by many factors including the alignment of the Sun and Moon, the phase and amplitude of the tide (pattern of tides in the deep ocean), the amphidromic systems of the oceans, and the shape of the coastline and near-shore bathymetry (see Timing). They are however only predictions, the actual time and height of the tide is affected by wind and atmospheric pressure. Many shorelines experience semi-diurnal tides—two nearly equal high and low tides each day. Other locations have a diurnal tide—one high and low tide each day. A "mixed tide"—two uneven magnitude tides a day—is a third regular category.
Tides vary on timescales ranging from hours to years due to a number of factors, which determine the lunitidal interval. To make accurate records, tide gauges at fixed stations measure water level over time. Gauges ignore variations caused by waves with periods shorter than minutes. These data are compared to the reference (or datum) level usually called mean sea level.
While tides are usually the largest source of short-term sea-level fluctuations, sea levels are also subject to forces such as wind and barometric pressure changes, resulting in storm surges, especially in shallow seas and near coasts.
Tidal phenomena are not limited to the oceans, but can occur in other systems whenever a gravitational field that varies in time and space is present. For example, the shape of the solid part of the Earth is affected slightly by Earth tide, though this is not as easily seen as the water tidal movements.
Characteristics

Tide changes proceed via the two main stages:
- The water stops falling, reaching a local minimum called low tide.
- The water stops rising, reaching a local maximum called high tide.
In some regions, there are additional two possible stages:
- Sea level rises over several hours, covering the intertidal zone; flood tide.
- Sea level falls over several hours, revealing the intertidal zone; ebb tide.
Oscillating currents produced by tides are known as tidal streams or tidal currents. The moment that the tidal current ceases is called slack water or slack tide. The tide then reverses direction and is said to be turning. Slack water usually occurs near high water and low water, but there are locations where the moments of slack tide differ significantly from those of high and low water.
Tides are commonly semi-diurnal (two high waters and two low waters each day), or diurnal (one tidal cycle per day). The two high waters on a given day are typically not the same height (the daily inequality); these are the higher high water and the lower high water in tide tables. Similarly, the two low waters each day are the higher low water and the lower low water. The daily inequality is not consistent and is generally small when the Moon is over the Equator.
Reference levels
The following reference tide levels can be defined, from the highest level to the lowest:
- Highest astronomical tide (HAT) – The highest tide which can be predicted to occur. Note that meteorological conditions may add extra height to the HAT.
- Mean high water springs (MHWS) – The average of the two high tides on the days of spring tides.
- Mean high water neaps (MHWN) – The average of the two high tides on the days of neap tides.
- Mean sea level (MSL) – This is the average sea level. The MSL is constant for any location over a long period.
- Mean low water neaps (MLWN) – The average of the two low tides on the days of neap tides.
- Mean low water springs (MLWS) – The average of the two low tides on the days of spring tides.
- Lowest astronomical tide (LAT) – The lowest tide which can be predicted to occur.

Tidal constituents
Tidal constituents are the net result of multiple influences impacting tidal changes over certain periods of time. Primary constituents include the Earth's rotation, the position of the Moon and Sun relative to the Earth, the Moon's altitude (elevation) above the Earth's Equator, and bathymetry. Variations with periods of less than half a day are called harmonic constituents. Conversely, cycles of days, months, or years are referred to as long period constituents.
Tidal forces affect the entire earth, but the movement of solid Earth occurs by mere centimeters. In contrast, the atmosphere is much more fluid and compressible so its surface moves by kilometers, in the sense of the contour level of a particular low pressure in the outer atmosphere.
Principal lunar semi-diurnal constituent
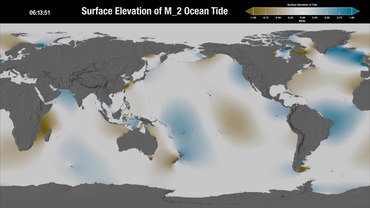
In most locations, the largest constituent is the principal lunar semi-diurnal, also known as the M2 tidal constituent or M2 tidal constituent. Its period is about 12 hours and 25.2 minutes, exactly half a tidal lunar day, which is the average time separating one lunar zenith from the next, and thus is the time required for the Earth to rotate once relative to the Moon. Simple tide clocks track this constituent. The lunar day is longer than the Earth day because the Moon orbits in the same direction the Earth spins. This is analogous to the minute hand on a watch crossing the hour hand at 12:00 and then again at about 1:05½ (not at 1:00).
The Moon orbits the Earth in the same direction as the Earth rotates on its axis, so it takes slightly more than a day—about 24 hours and 50 minutes—for the Moon to return to the same location in the sky. During this time, it has passed overhead (culmination) once and underfoot once (at an hour angle of 00:00 and 12:00 respectively), so in many places the period of strongest tidal forcing is the above-mentioned, about 12 hours and 25 minutes. The moment of highest tide is not necessarily when the Moon is nearest to zenith or nadir, but the period of the forcing still determines the time between high tides.
Because the gravitational field created by the Moon weakens with distance from the Moon, it exerts a slightly stronger than average force on the side of the Earth facing the Moon, and a slightly weaker force on the opposite side. The Moon thus tends to "stretch" the Earth slightly along the line connecting the two bodies. The solid Earth deforms a bit, but ocean water, being fluid, is free to move much more in response to the tidal force, particularly horizontally (see equilibrium tide).
As the Earth rotates, the magnitude and direction of the tidal force at any particular point on the Earth's surface change constantly; although the ocean never reaches equilibrium—there is never time for the fluid to "catch up" to the state it would eventually reach if the tidal force were constant—the changing tidal force nonetheless causes rhythmic changes in sea surface height.
When there are two high tides each day with different heights (and two low tides also of different heights), the pattern is called a mixed semi-diurnal tide.
Range variation: springs and neaps

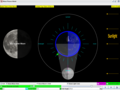
The semi-diurnal range (the difference in height between high and low waters over about half a day) varies in a two-week cycle. Approximately twice a month, around new moon and full moon when the Sun, Moon, and Earth form a line (a configuration known as a syzygy), the tidal force due to the Sun reinforces that due to the Moon. The tide's range is then at its maximum; this is called the spring tide. It is not named after the season, but, like that word, derives from the meaning "jump, burst forth, rise", as in a natural spring. Spring tides are sometimes referred to as syzygy tides.
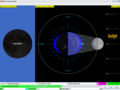
When the Moon is at first quarter or third quarter, the Sun and Moon are separated by 90° when viewed from the Earth, and the solar tidal force partially cancels the Moon's tidal force. At these points in the lunar cycle, the tide's range is at its minimum; this is called the neap tide, or neaps. "Neap" is an Anglo-Saxon word meaning "without the power", as in forðganges nip (forth-going without-the-power). Neap tides are sometimes referred to as quadrature tides.
Spring tides result in high waters that are higher than average, low waters that are lower than average, "slack water" time that is shorter than average, and stronger tidal currents than average. Neaps result in less extreme tidal conditions. There is about a seven-day interval between springs and neaps.

Spring tide: Sun and Moon on the same side (0°)

Neap tide: Sun and Moon at 90°

Spring tide: Sun and Moon at opposite sides (180°)
Neap tide: Sun and Moon at 270°
Spring tide: Sun and Moon at the same side (cycle restarts)


Lunar distance


The changing distance separating the Moon and Earth also affects tide heights. When the Moon is closest, at perigee, the range increases, and when it is at apogee, the range shrinks. Six or eight times a year perigee coincides with either a new or full moon causing perigean spring tides with the largest tidal range. The difference between the height of a tide at perigean spring tide and the spring tide when the moon is at apogee depends on location but can be large as a foot higher.
Other constituents
These include solar gravitational effects, the obliquity (tilt) of the Earth's Equator and rotational axis, the inclination of the plane of the lunar orbit and the elliptical shape of the Earth's orbit of the Sun.
A compound tide (or overtide) results from the shallow-water interaction of its two parent waves.
Phase and amplitude

Because the M2 tidal constituent dominates in most locations, the stage or phase of a tide, denoted by the time in hours after high water, is a useful concept. Tidal stage is also measured in degrees, with 360° per tidal cycle. Lines of constant tidal phase are called cotidal lines, which are analogous to contour lines of constant altitude on topographical maps, and when plotted form a cotidal map or cotidal chart. High water is reached simultaneously along the cotidal lines extending from the coast out into the ocean, and cotidal lines (and hence tidal phases) advance along the coast. Semi-diurnal and long phase constituents are measured from high water, diurnal from maximum flood tide. This and the discussion that follows is precisely true only for a single tidal constituent.
For an ocean in the shape of a circular basin enclosed by a coastline, the cotidal lines point radially inward and must eventually meet at a common point, the amphidromic point. The amphidromic point is at once cotidal with high and low waters, which is satisfied by zero tidal motion. (The rare exception occurs when the tide encircles an island, as it does around New Zealand, Iceland and Madagascar.) Tidal motion generally lessens moving away from continental coasts, so that crossing the cotidal lines are contours of constant amplitude (half the distance between high and low water) which decrease to zero at the amphidromic point. For a semi-diurnal tide the amphidromic point can be thought of roughly like the center of a clock face, with the hour hand pointing in the direction of the high water cotidal line, which is directly opposite the low water cotidal line. High water rotates about the amphidromic point once every 12 hours in the direction of rising cotidal lines, and away from ebbing cotidal lines. This rotation, caused by the Coriolis effect, is generally clockwise in the southern hemisphere and counterclockwise in the northern hemisphere. The difference of cotidal phase from the phase of a reference tide is the epoch. The reference tide is the hypothetical constituent "equilibrium tide" on a landless Earth measured at 0° longitude, the Greenwich meridian.
In the North Atlantic, because the cotidal lines circulate counterclockwise around the amphidromic point, the high tide passes New York Harbor approximately an hour ahead of Norfolk Harbor. South of Cape Hatteras the tidal forces are more complex, and cannot be predicted reliably based on the North Atlantic cotidal lines.
History
History of tidal theory
Investigation into tidal physics was important in the early development of celestial mechanics, with the existence of two daily tides being explained by the Moon's gravity. Later the daily tides were explained more precisely by the interaction of the Moon's and the Sun's gravity.
Seleucus of Seleucia theorized around 150 BC that tides were caused by the Moon. The influence of the Moon on bodies of water was also mentioned in Ptolemy's Tetrabiblos.
In De temporum ratione (The Reckoning of Time) of 725 Bede linked semidurnal tides and the phenomenon of varying tidal heights to the Moon and its phases. Bede starts by noting that the tides rise and fall 4/5 of an hour later each day, just as the Moon rises and sets 4/5 of an hour later. He goes on to emphasise that in two lunar months (59 days) the Moon circles the Earth 57 times and there are 114 tides. Bede then observes that the height of tides varies over the month. Increasing tides are called malinae and decreasing tides ledones and that the month is divided into four parts of seven or eight days with alternating malinae and ledones. In the same passage he also notes the effect of winds to hold back tides. Bede also records that the time of tides varies from place to place. To the north of Bede's location (Monkwearmouth) the tides are earlier, to the south later. He explains that the tide "deserts these shores in order to be able all the more to be able to flood other [shores] when it arrives there" noting that "the Moon which signals the rise of tide here, signals its retreat in other regions far from this quarter of the heavens".
Medieval understanding of the tides was primarily based on works of Muslim astronomers, which became available through Latin translation starting from the 12th century. Abu Ma'shar (d. circa 886), in his Introductorium in astronomiam, taught that ebb and flood tides were caused by the Moon. Abu Ma'shar discussed the effects of wind and Moon's phases relative to the Sun on the tides. In the 12th century, al-Bitruji (d. circa 1204) contributed the notion that the tides were caused by the general circulation of the heavens.
Simon Stevin, in his 1608 De spiegheling der Ebbenvloet (The theory of ebb and flood), dismissed a large number of misconceptions that still existed about ebb and flood. Stevin pleaded for the idea that the attraction of the Moon was responsible for the tides and spoke in clear terms about ebb, flood, spring tide and neap tide, stressing that further research needed to be made.
In 1609 Johannes Kepler also correctly suggested that the gravitation of the Moon caused the tides, which he based upon ancient observations and correlations.
Galileo Galilei in his 1632 Dialogue Concerning the Two Chief World Systems, whose working title was Dialogue on the Tides, gave an explanation of the tides. The resulting theory, however, was incorrect as he attributed the tides to the sloshing of water caused by the Earth's movement around the Sun. He hoped to provide mechanical proof of the Earth's movement. The value of his tidal theory is disputed. Galileo rejected Kepler's explanation of the tides.
Isaac Newton (1642–1727) was the first person to explain tides as the product of the gravitational attraction of astronomical masses. His explanation of the tides (and many other phenomena) was published in the Principia (1687) and used his theory of universal gravitation to explain the lunar and solar attractions as the origin of the tide-generating forces. Newton and others before Pierre-Simon Laplace worked the problem from the perspective of a static system (equilibrium theory), that provided an approximation that described the tides that would occur in a non-inertial ocean evenly covering the whole Earth. The tide-generating force (or its corresponding potential) is still relevant to tidal theory, but as an intermediate quantity (forcing function) rather than as a final result; theory must also consider the Earth's accumulated dynamic tidal response to the applied forces, which response is influenced by ocean depth, the Earth's rotation, and other factors.
In 1740, the Académie Royale des Sciences in Paris offered a prize for the best theoretical essay on tides. Daniel Bernoulli, Leonhard Euler, Colin Maclaurin and Antoine Cavalleri shared the prize.
Maclaurin used Newton's theory to show that a smooth sphere covered by a sufficiently deep ocean under the tidal force of a single deforming body is a prolate spheroid (essentially a three-dimensional oval) with major axis directed toward the deforming body. Maclaurin was the first to write about the Earth's rotational effects on motion. Euler realized that the tidal force's horizontal component (more than the vertical) drives the tide. In 1744 Jean le Rond d'Alembert studied tidal equations for the atmosphere which did not include rotation.
In 1770 James Cook's barque HMS Endeavour grounded on the Great Barrier Reef. Attempts were made to refloat her on the following tide which failed, but the tide after that lifted her clear with ease. Whilst she was being repaired in the mouth of the Endeavour River Cook observed the tides over a period of seven weeks. At neap tides both tides in a day were similar, but at springs the tides rose 7 feet (2.1 m) in the morning but 9 feet (2.7 m) in the evening.
Pierre-Simon Laplace formulated a system of partial differential equations relating the ocean's horizontal flow to its surface height, the first major dynamic theory for water tides. The Laplace tidal equations are still in use today. William Thomson, 1st Baron Kelvin, rewrote Laplace's equations in terms of vorticity which allowed for solutions describing tidally driven coastally trapped waves, known as Kelvin waves.
Others including Kelvin and Henri Poincaré further developed Laplace's theory. Based on these developments and the lunar theory of E W Brown describing the motions of the Moon, Arthur Thomas Doodson developed and published in 1921 the first modern development of the tide-generating potential in harmonic form: Doodson distinguished 388 tidal frequencies. Some of his methods remain in use.
History of tidal observation


From ancient times, tidal observation and discussion has increased in sophistication, first marking the daily recurrence, then tides' relationship to the Sun and moon. Pytheas travelled to the British Isles about 325 BC and seems to be the first to have related spring tides to the phase of the moon.
In the 2nd century BC, the Hellenistic astronomer Seleucus of Seleucia correctly described the phenomenon of tides in order to support his heliocentric theory. He correctly theorized that tides were caused by the moon, although he believed that the interaction was mediated by the pneuma. He noted that tides varied in time and strength in different parts of the world. According to Strabo (1.1.9), Seleucus was the first to link tides to the lunar attraction, and that the height of the tides depends on the moon's position relative to the Sun.
The Naturalis Historia of Pliny the Elder collates many tidal observations, e.g., the spring tides are a few days after (or before) new and full moon and are highest around the equinoxes, though Pliny noted many relationships now regarded as fanciful. In his Geography, Strabo described tides in the Persian Gulf having their greatest range when the moon was furthest from the plane of the Equator. All this despite the relatively small amplitude of Mediterranean basin tides. (The strong currents through the Euripus Strait and the Strait of Messina puzzled Aristotle.) Philostratus discussed tides in Book Five of The Life of Apollonius of Tyana. Philostratus mentions the moon, but attributes tides to "spirits". In Europe around 730 AD, the Venerable Bede described how the rising tide on one coast of the British Isles coincided with the fall on the other and described the time progression of high water along the Northumbrian coast.
The first tide table in China was recorded in 1056 AD primarily for visitors wishing to see the famous tidal bore in the Qiantang River. The first known British tide table is thought to be that of John Wallingford, who died Abbot of St. Albans in 1213, based on high water occurring 48 minutes later each day, and three hours earlier at the Thames mouth than upriver at London.
In 1614 Claude d'Abbeville published the work “Histoire de la mission de pères capucins en l’Isle de Maragnan et terres circonvoisines”, where he exposed that the Tupinambá people already had an understanding of the relation between the Moon and the tides before Europe.
William Thomson (Lord Kelvin) led the first systematic harmonic analysis of tidal records starting in 1867. The main result was the building of a tide-predicting machine using a system of pulleys to add together six harmonic time functions. It was "programmed" by resetting gears and chains to adjust phasing and amplitudes. Similar machines were used until the 1960s.
The first known sea-level record of an entire spring–neap cycle was made in 1831 on the Navy Dock in the Thames Estuary. Many large ports had automatic tide gauge stations by 1850.
John Lubbock was one of the first to map co-tidal lines, for Great Britain, Ireland and adjacent coasts, in 1840. William Whewell expanded this work ending with a nearly global chart in 1836. In order to make these maps consistent, he hypothesized the existence of a region with no tidal rise or fall where co-tidal lines meet in the mid-ocean. The existence of such an amphidromic point, as they are now known, was confirmed in 1840 by Captain William Hewett, RN, from careful soundings in the North Sea.
Physics
Forces
The tidal force produced by a massive object (Moon, hereafter) on a small particle located on or in an extensive body (Earth, hereafter) is the vector difference between the gravitational force exerted by the Moon on the particle, and the gravitational force that would be exerted on the particle if it were located at the Earth's center of mass.
Whereas the gravitational force subjected by a celestial body on Earth varies inversely as the square of its distance to the Earth, the maximal tidal force varies inversely as, approximately, the cube of this distance. If the tidal force caused by each body were instead equal to its full gravitational force (which is not the case due to the free fall of the whole Earth, not only the oceans, towards these bodies) a different pattern of tidal forces would be observed, e.g. with a much stronger influence from the Sun than from the Moon: The solar gravitational force on the Earth is on average 179 times stronger than the lunar, but because the Sun is on average 389 times farther from the Earth, its field gradient is weaker. The tidal force is proportional to

where M is the mass of the heavenly body, d is its distance, ρ is its average density, and r is its radius. The ratio r/d is related to the angle subtended by the object in the sky. Since the sun and the moon have practically the same diameter in the sky, the tidal force of the sun is less than that of the moon because its average density is much less, and it is only 46% as large as the lunar. More precisely, the lunar tidal acceleration (along the Moon–Earth axis, at the Earth's surface) is about 1.1 × 10⁻⁷ g, while the solar tidal acceleration (along the Sun–Earth axis, at the Earth's surface) is about 0.52 × 10⁻⁷ g, where g is the gravitational acceleration at the Earth's surface. The effects of the other planets vary as their distances from Earth vary. When Venus is closest to Earth, its effect is 0.000113 times the solar effect. At other times, Jupiter or Mars may have the most effect.

The ocean's surface is approximated by a surface referred to as the geoid, which takes into consideration the gravitational force exerted by the earth as well as centrifugal force due to rotation. Now consider the effect of massive external bodies such as the Moon and Sun. These bodies have strong gravitational fields that diminish with distance and cause the ocean's surface to deviate from the geoid. They establish a new equilibrium ocean surface which bulges toward the moon on one side and away from the moon on the other side. The earth's rotation relative to this shape causes the daily tidal cycle. The ocean surface tends toward this equilibrium shape, which is constantly changing, and never quite attains it. When the ocean surface is not aligned with it, it's as though the surface is sloping, and water accelerates in the down-slope direction.
Equilibrium
The equilibrium tide is the idealized tide assuming a landless Earth. It would produce a tidal bulge in the ocean, with the shape of an ellipsoid elongated towards the attracting body (Moon or Sun). It is not caused by the vertical pull nearest or farthest from the body, which is very weak; rather, it is caused by the tangent or "tractive" tidal force, which is strongest at about 45 degrees from the body, resulting in a horizontal tidal current.
Laplace's tidal equations
Ocean depths are much smaller than their horizontal extent. Thus, the response to tidal forcing can be modelled using the Laplace tidal equations which incorporate the following features:
- The vertical (or radial) velocity is negligible, and there is no vertical shear—this is a sheet flow.
- The forcing is only horizontal (tangential).
- The Coriolis effect appears as an inertial force (fictitious) acting laterally to the direction of flow and proportional to velocity.
- The surface height's rate of change is proportional to the negative divergence of velocity multiplied by the depth. As the horizontal velocity stretches or compresses the ocean as a sheet, the volume thins or thickens, respectively.
The boundary conditions dictate no flow across the coastline and free slip at the bottom.
The Coriolis effect (inertial force) steers flows moving towards the Equator to the west and flows moving away from the Equator toward the east, allowing coastally trapped waves. Finally, a dissipation term can be added which is an analog to viscosity.
Amplitude and cycle time
The theoretical amplitude of oceanic tides caused by the Moon is about 54 centimetres (21 in) at the highest point, which corresponds to the amplitude that would be reached if the ocean possessed a uniform depth, there were no landmasses, and the Earth were rotating in step with the Moon's orbit. The Sun similarly causes tides, of which the theoretical amplitude is about 25 centimetres (9.8 in) (46% of that of the Moon) with a cycle time of 12 hours. At spring tide the two effects add to each other to a theoretical level of 79 centimetres (31 in), while at neap tide the theoretical level is reduced to 29 centimetres (11 in). Since the orbits of the Earth about the Sun, and the Moon about the Earth, are elliptical, tidal amplitudes change somewhat as a result of the varying Earth–Sun and Earth–Moon distances. This causes a variation in the tidal force and theoretical amplitude of about ±18% for the Moon and ±5% for the Sun. If both the Sun and Moon were at their closest positions and aligned at new moon, the theoretical amplitude would reach 93 centimetres (37 in).
Real amplitudes differ considerably, not only because of depth variations and continental obstacles, but also because wave propagation across the ocean has a natural period of the same order of magnitude as the rotation period: if there were no land masses, it would take about 30 hours for a long wavelength surface wave to propagate along the Equator halfway around the Earth (by comparison, the Earth's lithosphere has a natural period of about 57 minutes). Earth tides, which raise and lower the bottom of the ocean, and the tide's own gravitational self attraction are both significant and further complicate the ocean's response to tidal forces.
Dissipation
Earth's tidal oscillations introduce dissipation at an average rate of about 3.75 terawatts. About 98% of this dissipation is by marine tidal movement. Dissipation arises as basin-scale tidal flows drive smaller-scale flows which experience turbulent dissipation. This tidal drag creates torque on the moon that gradually transfers angular momentum to its orbit, and a gradual increase in Earth–moon separation. The equal and opposite torque on the Earth correspondingly decreases its rotational velocity. Thus, over geologic time, the moon recedes from the Earth, at about 3.8 centimetres (1.5 in)/year, lengthening the terrestrial day. Day length has increased by about 2 hours in the last 600 million years. Assuming (as a crude approximation) that the deceleration rate has been constant, this would imply that 70 million years ago, day length was on the order of 1% shorter with about 4 more days per year.
Bathymetry

The shape of the shoreline and the ocean floor changes the way that tides propagate, so there is no simple, general rule that predicts the time of high water from the Moon's position in the sky. Coastal characteristics such as underwater bathymetry and coastline shape mean that individual location characteristics affect tide forecasting; actual high water time and height may differ from model predictions due to the coastal morphology's effects on tidal flow. However, for a given location the relationship between lunar altitude and the time of high or low tide (the lunitidal interval) is relatively constant and predictable, as is the time of high or low tide relative to other points on the same coast. For example, the high tide at Norfolk, Virginia, U.S., predictably occurs approximately two and a half hours before the Moon passes directly overhead.
Land masses and ocean basins act as barriers against water moving freely around the globe, and their varied shapes and sizes affect the size of tidal frequencies. As a result, tidal patterns vary. For example, in the U.S., the East coast has predominantly semi-diurnal tides, as do Europe's Atlantic coasts, while the West coast predominantly has mixed tides. Human changes to the landscape can also significantly alter local tides.
Observation and prediction
Timing

The tidal forces due to the Moon and Sun generate very long waves which travel all around the ocean following the paths shown in co-tidal charts. The time when the crest of the wave reaches a port then gives the time of high water at the port. The time taken for the wave to travel around the ocean also means that there is a delay between the phases of the Moon and their effect on the tide. Springs and neaps in the North Sea, for example, are two days behind the new/full moon and first/third quarter moon. This is called the tide's age.
The ocean bathymetry greatly influences the tide's exact time and height at a particular coastal point. There are some extreme cases; the Bay of Fundy, on the east coast of Canada, is often stated to have the world's highest tides because of its shape, bathymetry, and its distance from the continental shelf edge. Measurements made in November 1998 at Burntcoat Head in the Bay of Fundy recorded a maximum range of 16.3 metres (53 ft) and a highest predicted extreme of 17 metres (56 ft). Similar measurements made in March 2002 at Leaf Basin, Ungava Bay in northern Quebec gave similar values (allowing for measurement errors), a maximum range of 16.2 metres (53 ft) and a highest predicted extreme of 16.8 metres (55 ft). Ungava Bay and the Bay of Fundy lie similar distances from the continental shelf edge, but Ungava Bay is free of pack ice for about four months every year while the Bay of Fundy rarely freezes.
Southampton in the United Kingdom has a double high water caused by the interaction between the M2 and M4 tidal constituents (Shallow water overtides of principal lunar). Portland has double low waters for the same reason. The M4 tide is found all along the south coast of the United Kingdom, but its effect is most noticeable between the Isle of Wight and Portland because the M2 tide is lowest in this region.
Because the oscillation modes of the Mediterranean Sea and the Baltic Sea do not coincide with any significant astronomical forcing period, the largest tides are close to their narrow connections with the Atlantic Ocean. Extremely small tides also occur for the same reason in the Gulf of Mexico and Sea of Japan. Elsewhere, as along the southern coast of Australia, low tides can be due to the presence of a nearby amphidrome.
Analysis

Isaac Newton's theory of gravitation first enabled an explanation of why there were generally two tides a day, not one, and offered hope for a detailed understanding of tidal forces and behavior. Although it may seem that tides could be predicted via a sufficiently detailed knowledge of instantaneous astronomical forcings, the actual tide at a given location is determined by astronomical forces accumulated by the body of water over many days. In addition, accurate results would require detailed knowledge of the shape of all the ocean basins—their bathymetry, and coastline shape.
Current procedure for analysing tides follows the method of harmonic analysis introduced in the 1860s by William Thomson. It is based on the principle that the astronomical theories of the motions of Sun and Moon determine a large number of component frequencies, and at each frequency there is a component of force tending to produce tidal motion, but that at each place of interest on the Earth, the tides respond at each frequency with an amplitude and phase peculiar to that locality. At each place of interest, the tide heights are therefore measured for a period of time sufficiently long (usually more than a year in the case of a new port not previously studied) to enable the response at each significant tide-generating frequency to be distinguished by analysis, and to extract the tidal constants for a sufficient number of the strongest known components of the astronomical tidal forces to enable practical tide prediction. The tide heights are expected to follow the tidal force, with a constant amplitude and phase delay for each component. Because astronomical frequencies and phases can be calculated with certainty, the tide height at other times can then be predicted once the response to the harmonic components of the astronomical tide-generating forces has been found.
The main patterns in the tides are
- the twice-daily variation
- the difference between the first and second tide of a day
- the spring–neap cycle
- the annual variation
The Highest Astronomical Tide is the perigean spring tide when both the Sun and Moon are closest to the Earth.
When confronted by a periodically varying function, the standard approach is to employ Fourier series, a form of analysis that uses sinusoidal functions as a basis set, having frequencies that are zero, one, two, three, etc. times the frequency of a particular fundamental cycle. These multiples are called harmonics of the fundamental frequency, and the process is termed harmonic analysis. If the basis set of sinusoidal functions suit the behaviour being modelled, relatively few harmonic terms need to be added. Orbital paths are very nearly circular, so sinusoidal variations are suitable for tides.
For the analysis of tide heights, the Fourier series approach has in practice to be made more elaborate than the use of a single frequency and its harmonics. The tidal patterns are decomposed into many sinusoids having many fundamental frequencies, corresponding (as in the lunar theory) to many different combinations of the motions of the Earth, the Moon, and the angles that define the shape and location of their orbits.
For tides, then, harmonic analysis is not limited to harmonics of a single frequency. In other words, the harmonies are multiples of many fundamental frequencies, not just of the fundamental frequency of the simpler Fourier series approach. Their representation as a Fourier series having only one fundamental frequency and its (integer) multiples would require many terms, and would be severely limited in the time-range for which it would be valid.
The study of tide height by harmonic analysis was begun by Laplace, William Thomson (Lord Kelvin), and George Darwin. A.T. Doodson extended their work, introducing the Doodson Number notation to organise the hundreds of resulting terms. This approach has been the international standard ever since, and the complications arise as follows: the tide-raising force is notionally given by sums of several terms. Each term is of the form

where A is the amplitude, ω is the angular frequency usually given in degrees per hour corresponding to t measured in hours, and p is the phase offset with regard to the astronomical state at time t = 0 . There is one term for the Moon and a second term for the Sun. The phase p of the first harmonic for the Moon term is called the lunitidal interval or high water interval. The next step is to accommodate the harmonic terms due to the elliptical shape of the orbits. Accordingly, the value of A is not a constant but also varying with time, slightly, about some average figure. Replace it then by A(t) where A is another sinusoid, similar to the cycles and epicycles of Ptolemaic theory. Accordingly,

which is to say an average value A with a sinusoidal variation about it of magnitude Aa, with frequency ωa and phase pa. Thus the simple term is now the product of two cosine factors:
![A \bigl[ 1 + A_a \cos\,(\omega_a t + p_a)\bigr] \cos\,(\omega t + p)](https://wikimedia.org/api/rest_v1/media/math/render/svg/27dd605f09c7af15645266adc3d30cbe8a22640a)
Given that for any x and y

it is clear that a compound term involving the product of two cosine terms each with their own frequency is the same as three simple cosine terms that are to be added at the original frequency and also at frequencies which are the sum and difference of the two frequencies of the product term. (Three, not two terms, since the whole expression is .) Consider further that the tidal force on a location depends also on whether the Moon (or the Sun) is above or below the plane of the Equator, and that these attributes have their own periods also incommensurable with a day and a month, and it is clear that many combinations result. With a careful choice of the basic astronomical frequencies, the Doodson Number annotates the particular additions and differences to form the frequency of each simple cosine term.


Remember that astronomical tides do not include weather effects. Also, changes to local conditions (sandbank movement, dredging harbour mouths, etc.) away from those prevailing at the measurement time affect the tide's actual timing and magnitude. Organisations quoting a "highest astronomical tide" for some location may exaggerate the figure as a safety factor against analytical uncertainties, distance from the nearest measurement point, changes since the last observation time, ground subsidence, etc., to avert liability should an engineering work be overtopped. Special care is needed when assessing the size of a "weather surge" by subtracting the astronomical tide from the observed tide.
Careful Fourier data analysis over a nineteen-year period (the National Tidal Datum Epoch in the U.S.) uses frequencies called the tidal harmonic constituents. Nineteen years is preferred because the Earth, Moon and Sun's relative positions repeat almost exactly in the Metonic cycle of 19 years, which is long enough to include the 18.613 year lunar nodal tidal constituent. This analysis can be done using only the knowledge of the forcing period, but without detailed understanding of the mathematical derivation, which means that useful tidal tables have been constructed for centuries. The resulting amplitudes and phases can then be used to predict the expected tides. These are usually dominated by the constituents near 12 hours (the semi-diurnal constituents), but there are major constituents near 24 hours (diurnal) as well. Longer term constituents are 14 day or fortnightly, monthly, and semiannual. Semi-diurnal tides dominated coastline, but some areas such as the South China Sea and the Gulf of Mexico are primarily diurnal. In the semi-diurnal areas, the primary constituents M2 (lunar) and S2 (solar) periods differ slightly, so that the relative phases, and thus the amplitude of the combined tide, change fortnightly (14 day period).
In the M2 plot above, each cotidal line differs by one hour from its neighbors, and the thicker lines show tides in phase with equilibrium at Greenwich. The lines rotate around the amphidromic points counterclockwise in the northern hemisphere so that from Baja California Peninsula to Alaska and from France to Ireland the M2 tide propagates northward. In the southern hemisphere this direction is clockwise. On the other hand, M2 tide propagates counterclockwise around New Zealand, but this is because the islands act as a dam and permit the tides to have different heights on the islands' opposite sides. (The tides do propagate northward on the east side and southward on the west coast, as predicted by theory.)
The exception is at Cook Strait where the tidal currents periodically link high to low water. This is because cotidal lines 180° around the amphidromes are in opposite phase, for example high water across from low water at each end of Cook Strait. Each tidal constituent has a different pattern of amplitudes, phases, and amphidromic points, so the M2 patterns cannot be used for other tide components.
Example calculation


Because the Moon is moving in its orbit around the Earth and in the same sense as the Earth's rotation, a point on the Earth must rotate slightly further to catch up so that the time between semi-diurnal tides is not twelve but 12.4206 hours—a bit over twenty-five minutes extra. The two peaks are not equal. The two high tides a day alternate in maximum heights: lower high (just under three feet), higher high (just over three feet), and again lower high. Likewise for the low tides.
When the Earth, Moon, and Sun are in line (Sun–Earth–Moon, or Sun–Moon–Earth) the two main influences combine to produce spring tides; when the two forces are opposing each other as when the angle Moon–Earth–Sun is close to ninety degrees, neap tides result. As the Moon moves around its orbit it changes from north of the Equator to south of the Equator. The alternation in high tide heights becomes smaller, until they are the same (at the lunar equinox, the Moon is above the Equator), then redevelop but with the other polarity, waxing to a maximum difference and then waning again.
Current
The tides' influence on current or flow is much more difficult to analyze, and data is much more difficult to collect. A tidal height is a scalar quantity and varies smoothly over a wide region. A flow is a vector quantity, with magnitude and direction, both of which can vary substantially with depth and over short distances due to local bathymetry. Also, although a water channel's center is the most useful measuring site, mariners object when current-measuring equipment obstructs waterways. A flow proceeding up a curved channel may have similar magnitude, even though its direction varies continuously along the channel. Surprisingly, flood and ebb flows are often not in opposite directions. Flow direction is determined by the upstream channel's shape, not the downstream channel's shape. Likewise, eddies may form in only one flow direction.
Nevertheless, tidal current analysis is similar to tidal heights analysis: in the simple case, at a given location the flood flow is in mostly one direction, and the ebb flow in another direction. Flood velocities are given positive sign, and ebb velocities negative sign. Analysis proceeds as though these are tide heights.
In more complex situations, the main ebb and flood flows do not dominate. Instead, the flow direction and magnitude trace an ellipse over a tidal cycle (on a polar plot) instead of along the ebb and flood lines. In this case, analysis might proceed along pairs of directions, with the primary and secondary directions at right angles. An alternative is to treat the tidal flows as complex numbers, as each value has both a magnitude and a direction.
Tide flow information is most commonly seen on nautical charts, presented as a table of flow speeds and bearings at hourly intervals, with separate tables for spring and neap tides. The timing is relative to high water at some harbour where the tidal behaviour is similar in pattern, though it may be far away.
As with tide height predictions, tide flow predictions based only on astronomical factors do not incorporate weather conditions, which can completely change the outcome.
The tidal flow through Cook Strait between the two main islands of New Zealand is particularly interesting, as the tides on each side of the strait are almost exactly out of phase, so that one side's high water is simultaneous with the other's low water. Strong currents result, with almost zero tidal height change in the strait's center. Yet, although the tidal surge normally flows in one direction for six hours and in the reverse direction for six hours, a particular surge might last eight or ten hours with the reverse surge enfeebled. In especially boisterous weather conditions, the reverse surge might be entirely overcome so that the flow continues in the same direction through three or more surge periods.
A further complication for Cook Strait's flow pattern is that the tide at the south side (e.g. at Nelson) follows the common bi-weekly spring–neap tide cycle (as found along the west side of the country), but the north side's tidal pattern has only one cycle per month, as on the east side: Wellington, and Napier.
The graph of Cook Strait's tides shows separately the high water and low water height and time, through November 2007; these are not measured values but instead are calculated from tidal parameters derived from years-old measurements. Cook Strait's nautical chart offers tidal current information. For instance the January 1979 edition for 41°13·9’S 174°29·6’E (north west of Cape Terawhiti) refers timings to Westport while the January 2004 issue refers to Wellington. Near Cape Terawhiti in the middle of Cook Strait the tidal height variation is almost nil while the tidal current reaches its maximum, especially near the notorious Karori Rip. Aside from weather effects, the actual currents through Cook Strait are influenced by the tidal height differences between the two ends of the strait and as can be seen, only one of the two spring tides at the north west end of the strait near Nelson has a counterpart spring tide at the south east end (Wellington), so the resulting behaviour follows neither reference harbour.
Power generation
Tidal energy can be extracted by two means: inserting a water turbine into a tidal current, or building ponds that release/admit water through a turbine. In the first case, the energy amount is entirely determined by the timing and tidal current magnitude. However, the best currents may be unavailable because the turbines would obstruct ships. In the second, the impoundment dams are expensive to construct, natural water cycles are completely disrupted, ship navigation is disrupted. However, with multiple ponds, power can be generated at chosen times. So far, there are few installed systems for tidal power generation (most famously, La Rance at Saint Malo, France) which face many difficulties. Aside from environmental issues, simply withstanding corrosion and biological fouling pose engineering challenges.
Tidal power proponents point out that, unlike wind power systems, generation levels can be reliably predicted, save for weather effects. While some generation is possible for most of the tidal cycle, in practice turbines lose efficiency at lower operating rates. Since the power available from a flow is proportional to the cube of the flow speed, the times during which high power generation is possible are brief.

Tidal flows are important for navigation, and significant errors in position occur if they are not accommodated. Tidal heights are also important; for example many rivers and harbours have a shallow "bar" at the entrance which prevents boats with significant draft from entering at low tide.
Until the advent of automated navigation, competence in calculating tidal effects was important to naval officers. The certificate of examination for lieutenants in the Royal Navy once declared that the prospective officer was able to "shift his tides".
Tidal flow timings and velocities appear in tide charts or a tidal stream atlas. Tide charts come in sets. Each chart covers a single hour between one high water and another (they ignore the leftover 24 minutes) and show the average tidal flow for that hour. An arrow on the tidal chart indicates the direction and the average flow speed (usually in knots) for spring and neap tides. If a tide chart is not available, most nautical charts have "tidal diamonds" which relate specific points on the chart to a table giving tidal flow direction and speed.
The standard procedure to counteract tidal effects on navigation is to (1) calculate a "dead reckoning" position (or DR) from travel distance and direction, (2) mark the chart (with a vertical cross like a plus sign) and (3) draw a line from the DR in the tide's direction. The distance the tide moves the boat along this line is computed by the tidal speed, and this gives an "estimated position" or EP (traditionally marked with a dot in a triangle).

Nautical charts display the water's "charted depth" at specific locations with "soundings" and the use of bathymetric contour lines to depict the submerged surface's shape. These depths are relative to a "chart datum", which is typically the water level at the lowest possible astronomical tide (although other datums are commonly used, especially historically, and tides may be lower or higher for meteorological reasons) and are therefore the minimum possible water depth during the tidal cycle. "Drying heights" may also be shown on the chart, which are the heights of the exposed seabed at the lowest astronomical tide.
Tide tables list each day's high and low water heights and times. To calculate the actual water depth, add the charted depth to the published tide height. Depth for other times can be derived from tidal curves published for major ports. The rule of twelfths can suffice if an accurate curve is not available. This approximation presumes that the increase in depth in the six hours between low and high water is: first hour — 1/12, second — 2/12, third — 3/12, fourth — 3/12, fifth — 2/12, sixth — 1/12.
Biological aspects
Intertidal ecology

Intertidal ecology is the study of ecosystems between the low- and high-water lines along a shore. At low water, the intertidal zone is exposed (or emersed), whereas at high water, it is underwater (or immersed). Intertidal ecologists therefore study the interactions between intertidal organisms and their environment, as well as among the different species. The most important interactions may vary according to the type of intertidal community. The broadest classifications are based on substrates — rocky shore or soft bottom.
Intertidal organisms experience a highly variable and often hostile environment, and have adapted to cope with and even exploit these conditions. One easily visible feature is vertical zonation, in which the community divides into distinct horizontal bands of specific species at each elevation above low water. A species' ability to cope with desiccation determines its upper limit, while competition with other species sets its lower limit.
Humans use intertidal regions for food and recreation. Overexploitation can damage intertidals directly. Other anthropogenic actions such as introducing invasive species and climate change have large negative effects. Marine Protected Areas are one option communities can apply to protect these areas and aid scientific research.
Biological rhythms
The approximately fortnightly tidal cycle has large effects on intertidal and marine organisms. Hence their biological rhythms tend to occur in rough multiples of this period. Many other animals such as the vertebrates, display similar rhythms. Examples include gestation and egg hatching. In humans, the menstrual cycle lasts roughly a lunar month, an even multiple of the tidal period. Such parallels at least hint at the common descent of all animals from a marine ancestor.
Other tides
When oscillating tidal currents in the stratified ocean flow over uneven bottom topography, they generate internal waves with tidal frequencies. Such waves are called internal tides.
Shallow areas in otherwise open water can experience rotary tidal currents, flowing in directions that continually change and thus the flow direction (not the flow) completes a full rotation in 12+1⁄2 hours (for example, the Nantucket Shoals).
In addition to oceanic tides, large lakes can experience small tides and even planets can experience atmospheric tides and Earth tides. These are continuum mechanical phenomena. The first two take place in fluids. The third affects the Earth's thin solid crust surrounding its semi-liquid interior (with various modifications).
Lake tides
Large lakes such as Superior and Erie can experience tides of 1 to 4 cm (0.39 to 1.6 in), but these can be masked by meteorologically induced phenomena such as seiche. The tide in Lake Michigan is described as 1.3 to 3.8 cm (0.5 to 1.5 in) or 4.4 cm (1+3⁄4 in). This is so small that other larger effects completely mask any tide, and as such these lakes are considered non-tidal.
Atmospheric tides
Atmospheric tides are negligible at ground level and aviation altitudes, masked by weather's much more important effects. Atmospheric tides are both gravitational and thermal in origin and are the dominant dynamics from about 80 to 120 kilometres (50 to 75 mi), above which the molecular density becomes too low to support fluid behavior.
Earth tides
Earth tides or terrestrial tides affect the entire Earth's mass, which acts similarly to a liquid gyroscope with a very thin crust. The Earth's crust shifts (in/out, east/west, north/south) in response to lunar and solar gravitation, ocean tides, and atmospheric loading. While negligible for most human activities, terrestrial tides' semi-diurnal amplitude can reach about 55 centimetres (22 in) at the Equator—15 centimetres (5.9 in) due to the Sun—which is important in GPS calibration and VLBI measurements. Precise astronomical angular measurements require knowledge of the Earth's rotation rate and polar motion, both of which are influenced by Earth tides. The semi-diurnal M2 Earth tides are nearly in phase with the Moon with a lag of about two hours.
Galactic tides
Galactic tides are the tidal forces exerted by galaxies on stars within them and satellite galaxies orbiting them. The galactic tide's effects on the Solar System's Oort cloud are believed to cause 90 percent of long-period comets.
Misnomers
Tsunamis, the large waves that occur after earthquakes, are sometimes called tidal waves, but this name is given by their resemblance to the tide, rather than any causal link to the tide. Other phenomena unrelated to tides but using the word tide are rip tide, storm tide, hurricane tide, and black or red tides. Many of these usages are historic and refer to the earlier meaning of tide as "a portion of time, a season".


