DNA barcoding is a method of species identification using a short section of DNA from a specific gene or genes. The premise of DNA barcoding is that, by comparison with a reference library of such DNA sections (also called "sequences"), an individual sequence can be used to uniquely identify an organism to species, in the same way that a supermarket scanner uses the familiar black stripes of the UPC barcode to identify an item in its stock against its reference database. These "barcodes" are sometimes used in an effort to identify unknown species, parts of an organism, or simply to catalog as many taxa as possible, or to compare with traditional taxonomy in an effort to determine species boundaries.
Different gene regions are used to identify the different organismal groups using barcoding. The most commonly used barcode region for animals and some protists is a portion of the cytochrome c oxidase I (COI or COX1) gene, found in mitochondrial DNA. Other genes suitable for DNA barcoding are the internal transcribed spacer (ITS) rRNA often used for fungi and RuBisCO used for plants. Microorganisms are detected using different gene regions. The 16S rRNA gene for example is widely used in identification of prokaryotes, whereas the 18S rRNA gene is mostly used for detecting microbial eukaryotes. These gene regions are chosen because they have less intraspecific (within species) variation than interspecific (between species) variation, which is known as the "Barcoding Gap".
Some applications of DNA barcoding include: identifying plant leaves even when flowers or fruits are not available; identifying pollen collected on the bodies of pollinating animals; identifying insect larvae which may have fewer diagnostic characters than adults; or investigating the diet of an animal based on its stomach content, saliva or feces. When barcoding is used to identify organisms from a sample containing DNA from more than one organism, the term DNA metabarcoding is used, e.g. DNA metabarcoding of diatom communities in rivers and streams, which is used to assess water quality.
| DNA barcoding |
|---|
 |
| By taxa |
| Other |
Background
DNA barcoding techniques were developed from early DNA sequencing work on microbial communities using the 5S rRNA gene. In 2003, specific methods and terminology of modern DNA barcoding were proposed as a standardized method for identifying species, as well as potentially allocating unknown sequences to higher taxa such as orders and phyla, in a paper by Paul D.N. Hebert et al. from the University of Guelph, Ontario, Canada. Hebert and his colleagues demonstrated the utility of the cytochrome c oxidase I (COI) gene, first utilized by Folmer et al. in 1994, using their published DNA primers as a tool for phylogenetic analyses at the species levels as a suitable discriminatory tool between metazoan invertebrates. The "Folmer region" of the COI gene is commonly used for distinction between taxa based on its patterns of variation at the DNA level. The relative ease of retrieving the sequence, and variability mixed with conservation between species, are some of the benefits of COI. Calling the profiles "barcodes", Hebert et al. envisaged the development of a COI database that could serve as the basis for a "global bioidentification system".
Methodology
Sampling and preservation
Barcoding can be done from tissue from a target specimen, from a mixture of organisms (bulk sample), or from DNA present in environmental samples (e.g. water or soil). The methods for sampling, preservation or analysis differ between those different types of sample.
Tissue samples
To barcode a tissue sample from the target specimen, a small piece of skin, a scale, a leg or antenna is likely to be sufficient (depending on the size of the specimen). To avoid contamination, it is necessary to sterilize used tools between samples. It is recommended to collect two samples from one specimen, one to archive, and one for the barcoding process. Sample preservation is crucial to overcome the issue of DNA degradation.
Bulk samples
A bulk sample is a type of environmental sample containing several organisms from the taxonomic group under study. The difference between bulk samples (in the sense used here) and other environmental samples is that the bulk sample usually provides a large quantity of good-quality DNA. Examples of bulk samples include aquatic macroinvertebrate samples collected by kick-net, or insect samples collected with a Malaise trap. Filtered or size-fractionated water samples containing whole organisms like unicellular eukaryotes are also sometimes defined as bulk samples. Such samples can be collected by the same techniques used to obtain traditional samples for morphology-based identification.
eDNA samples
The environmental DNA (eDNA) method is a non-invasive approach to detect and identify species from cellular debris or extracellular DNA present in environmental samples (e.g. water or soil) through barcoding or metabarcoding. The approach is based on the fact that every living organism leaves DNA in the environment, and this environmental DNA can be detected even for organisms that are at very low abundance. Thus, for field sampling, the most crucial part is to use DNA-free material and tools on each sampling site or sample to avoid contamination, if the DNA of the target organism(s) is likely to be present in low quantities. On the other hand, an eDNA sample always includes the DNA of whole-cell, living microorganisms, which are often present in large quantities. Therefore, microorganism samples taken in the natural environment also are called eDNA samples, but contamination is less problematic in this context due to the large quantity of target organisms. The eDNA method is applied on most sample types, like water, sediment, soil, animal feces, stomach content or blood from e.g. leeches.
DNA extraction, amplification and sequencing
DNA barcoding requires that DNA in the sample is extracted. Several different DNA extraction methods exist, and factors like cost, time, sample type and yield affect the selection of the optimal method.
When DNA from organismal or eDNA samples is amplified using polymerase chain reaction (PCR), the reaction can be affected negatively by inhibitor molecules contained in the sample. Removal of these inhibitors is crucial to ensure that high quality DNA is available for subsequent analyzing.
Amplification of the extracted DNA is a required step in DNA barcoding. Typically, only a small fragment of the total DNA material is sequenced (typically 400–800 base pairs) to obtain the DNA barcode. Amplification of eDNA material is usually focused on smaller fragment sizes (<200 base pairs), as eDNA is more likely to be fragmented than DNA material from other sources. However, some studies argue that there is no relationship between amplicon size and detection rate of eDNA.

When the DNA barcode marker region has been amplified, the next step is to sequence the marker region using DNA sequencing methods. Many different sequencing platforms are available, and technical development is proceeding rapidly.
Marker selection

Markers used for DNA barcoding are called barcodes. In order to successfully characterize species based on DNA barcodes, selection of informative DNA regions is crucial. A good DNA barcode should have low intra-specific and high inter-specific variability and possess conserved flanking sites for developing universal PCR primers for wide taxonomic application. The goal is to design primers that will detect and distinguish most or all the species in the studied group of organisms (high taxonomic resolution). The length of the barcode sequence should be short enough to be used with current sampling source, DNA extraction, amplification and sequencing methods.
Ideally, one gene sequence would be used for all taxonomic groups, from viruses to plants and animals. However, no such gene region has been found yet, so different barcodes are used for different groups of organisms, or depending on the study question.
For animals, the most widely used barcode is mitochondrial cytochrome C oxidase I (COI) locus. Other mitochondrial genes, such as Cytb, 12S or 18S are also used. Mitochondrial genes are preferred over nuclear genes because of their lack of introns, their haploid mode of inheritance and their limited recombination. Moreover, each cell has various mitochondria (up to several thousand) and each of them contains several circular DNA molecules. Mitochondria can therefore offer abundant source of DNA even when sample tissue is limited.
In plants, however, mitochondrial genes are not appropriate for DNA barcoding because they exhibit low mutation rates. A few candidate genes have been found in the chloroplast genome, the most promising being maturase K gene (matK) by itself or in association with other genes. Multi-locus markers such as ribosomal internal transcribed spacers (ITS DNA) along with matK, rbcL, trnH or other genes have also been used for species identification. The best discrimination between plant species has been achieved when using two or more chloroplast barcodes.
For bacteria, the small subunit of ribosomal RNA (16S) gene can be used for different taxa, as it is highly conserved. Some studies suggest COI, type II chaperonin (cpn60) or β subunit of RNA polymerase (rpoB) also could serve as bacterial DNA barcodes.
Barcoding fungi is more challenging, and more than one primer combination might be required. The COI marker performs well in certain fungi groups, but not equally well in others. Therefore, additional markers are being used, such as ITS rDNA and the large subunit of nuclear ribosomal RNA (28S LSU rRNA).
Within the group of protists, various barcodes have been proposed, such as the D1–D2 or D2–D3 regions of 28S rDNA, V4 subregion of 18S rRNA gene, ITS rDNA and COI. Additionally, some specific barcodes can be used for photosynthetic protists, for example the large subunit of ribulose-1,5-bisphosphate carboxylase-oxygenase gene (rbcL) and the chloroplastic 23S rRNA gene.
| Organism group | Marker gene/locus |
|---|---|
| Animals | COI, Cytb, 12S, 16S |
| Plants | matK, rbcL, psbA-trnH, ITS |
| Bacteria | COI, rpoB, 16S, cpn60, tuf, RIF, gnd |
| Fungi | ITS, TEF1α, RPB1, RPB2, 18S, 28S |
| Protists | ITS, COI, rbcL, 18S, 28S, 23S |
Reference libraries and bioinformatics
Reference libraries are used for the taxonomic identification, also called annotation, of sequences obtained from barcoding or metabarcoding. These databases contain the DNA barcodes assigned to previously identified taxa. Most reference libraries do not cover all species within an organism group, and new entries are continually created. In the case of macro- and many microorganisms (such as algae), these reference libraries require detailed documentation (sampling location and date, person who collected it, image, etc.) and authoritative taxonomic identification of the voucher specimen, as well as submission of sequences in a particular format. However, such standards are fulfilled for only a small number of species. The process also requires the storage of voucher specimens in museum collections, herbaria and other collaborating institutions. Both taxonomically comprehensive coverage and content quality are important for identification accuracy. In the microbial world, there is no DNA information for most species names, and many DNA sequences cannot be assigned to any Linnaean binomial. Several reference databases exist depending on the organism group and the genetic marker used. There are smaller, national databases (e.g. FinBOL), and large consortia like the International Barcode of Life Project (iBOL).
Launched in 2007, the Barcode of Life Data System (BOLD) is one of the biggest databases, containing more than 450 000 BINs (Barcode Index Numbers) in 2019. It is a freely accessible repository for the specimen and sequence records for barcode studies, and it is also a workbench aiding the management, quality assurance and analysis of barcode data. The database mainly contains BIN records for animals based on the COI genetic marker.
The UNITE database was launched in 2003 and is a reference database for the molecular identification of fungal species with the internal transcribed spacer (ITS) genetic marker region. This database is based on the concept of species hypotheses: you choose the % at which you want to work, and the sequences are sorted in comparison to sequences obtained from voucher specimens identified by experts.
Diat.barcode database was first published under the name R-syst::diatom in 2016 starting with data from two sources: the Thonon culture collection (TCC) in the hydrobiological station of the French National Institute for Agricultural Research (INRA), and from the NCBI (National Center for Biotechnology Information) nucleotide database. Diat.barcode provides data for two genetic markers, rbcL (Ribulose-1,5-bisphosphate carboxylase/oxygenase) and 18S (18S ribosomal RNA). The database also involves additional, trait information of species, like morphological characteristics (biovolume, size dimensions, etc.), life-forms (mobility, colony-type, etc.) or ecological features (pollution sensitivity, etc.).
Bioinformatic analysis
In order to obtain well structured, clean and interpretable data, raw sequencing data must be processed using bioinformatic analysis. The FASTQ file with the sequencing data contains two types of information: the sequences detected in the sample (FASTA file) and a quality file with quality scores (PHRED scores) associated with each nucleotide of each DNA sequence. The PHRED scores indicate the probability with which the associated nucleotide has been correctly scored.
| 10 | 90% |
| 20 | 99% |
| 30 | 99.9% |
| 40 | 99.99% |
| 50 | 99.999% |
In general, the PHRED score decreases towards the end of each DNA sequence. Thus some bioinformatics pipelines simply cut the end of the sequences at a defined threshold.
Some sequencing technologies, like MiSeq, use paired-end sequencing during which sequencing is performed from both directions producing better quality. The overlapping sequences are then aligned into contigs and merged. Usually, several samples are pooled in one run, and each sample is characterized by a short DNA fragment, the tag. In a demultiplexing step, sequences are sorted using these tags to reassemble the separate samples. Before further analysis, tags and other adapters are removed from the barcoding sequence DNA fragment. During trimming, the bad quality sequences (low PHRED scores), or sequences that are much shorter or longer than the targeted DNA barcode, are removed. The following dereplication step is the process where all of the quality-filtered sequences are collapsed into a set of unique reads (individual sequence units ISUs) with the information of their abundance in the samples. After that, chimeras (i.e. compound sequences formed from pieces of mixed origin) are detected and removed. Finally, the sequences are clustered into OTUs (Operational Taxonomic Units), using one of many clustering strategies. The most frequently used bioinformatic software include Mothur, Uparse, Qiime, Galaxy, Obitools, JAMP, Barque, and DADA2.
Comparing the abundance of reads, i.e. sequences, between different samples is still a challenge because both the total number of reads in a sample as well as the relative amount of reads for a species can vary between samples, methods, or other variables. For comparison, one may then reduce the number of reads of each sample to the minimal number of reads of the samples to be compared – a process called rarefaction. Another way is to use the relative abundance of reads.
Species identification and taxonomic assignment
The taxonomic assignment of the OTUs to species is achieved by matching of sequences to reference libraries. The Basic Local Alignment Search Tool (BLAST) is commonly used to identify regions of similarity between sequences by comparing sequence reads from the sample to sequences in reference databases. If the reference database contains sequences of the relevant species, then the sample sequences can be identified to species level. If a sequence cannot be matched to an existing reference library entry, DNA barcoding can be used to create a new entry.
In some cases, due to the incompleteness of reference databases, identification can only be achieved at higher taxonomic levels, such as assignment to a family or class. In some organism groups such as bacteria, taxonomic assignment to species level is often not possible. In such cases, a sample may be assigned to a particular operational taxonomic unit (OTU).
Applications
Applications of DNA barcoding include identification of new species, safety assessment of food, identification and assessment of cryptic species, detection of alien species, identification of endangered and threatened species, linking egg and larval stages to adult species, securing intellectual property rights for bioresources, framing global management plans for conservation strategies and elucidate feeding niches. DNA barcode markers can be applied to address basic questions in systematics, ecology, evolutionary biology and conservation, including community assembly, species interaction networks, taxonomic discovery, and assessing priority areas for environmental protection.
Identification of species
Specific short DNA sequences or markers from a standardized region of the genome can provide a DNA barcode for identifying species. Molecular methods are especially useful when traditional methods are not applicable. DNA barcoding has great applicability in identification of larvae for which there are generally few diagnostic characters available, and in association of different life stages (e.g. larval and adult) in many animals. Identification of species listed in the Convention of the International Trade of Endangered Species (CITES) appendixes using barcoding techniques is used in monitoring of illegal trade.
Detection of invasive species
Alien species can be detected via barcoding. Barcoding can be suitable for detection of species in e.g. border control, where rapid and accurate morphological identification is often not possible due to similarities between different species, lack of sufficient diagnostic characteristics and/or lack of taxonomic expertise. Barcoding and metabarcoding can also be used to screen ecosystems for invasive species, and to distinguish between an invasive species and native, morphologically similar, species.
Delimiting cryptic species
DNA barcoding enables the identification and recognition of cryptic species. The results of DNA barcoding analyses depend however upon the choice of analytical methods, so the process of delimiting cryptic species using DNA barcodes can be as subjective as any other form of taxonomy. Hebert et al. (2004) concluded that the butterfly Astraptes fulgerator in north-western Costa Rica actually consists of 10 different species. These results, however, were subsequently challenged by Brower (2006), who pointed out numerous serious flaws in the analysis, and concluded that the original data could support no more than the possibility of three to seven cryptic taxa rather than ten cryptic species. Smith et al. (2007) used cytochrome c oxidase I DNA barcodes for species identification of the 20 morphospecies of Belvosia parasitoid flies (Diptera: Tachinidae) reared from caterpillars (Lepidoptera) in Area de Conservación Guanacaste (ACG), northwestern Costa Rica. These authors discovered that barcoding raises the species count to 32, by revealing that each of the three parasitoid species, previously considered as generalists, actually are arrays of highly host-specific cryptic species. For 15 morphospecies of polychaetes within the deep Antarctic benthos studied through DNA barcoding, cryptic diversity was found in 50% of the cases. Furthermore, 10 previously overlooked morphospecies were detected, increasing the total species richness in the sample by 233%.
.jpg)
Diet analysis and food web application
DNA barcoding and metabarcoding can be useful in diet analysis studies, and is typically used if prey specimens cannot be identified based on morphological characters. There is a range of sampling approaches in diet analysis: DNA metabarcoding can be conducted on stomach contents, feces, saliva or whole body analysis. In fecal samples or highly digested stomach contents, it is often not possible to distinguish tissue from single species, and therefore metabarcoding can be applied instead. Feces or saliva represent non-invasive sampling approaches, while whole body analysis often means that the individual needs to be killed first. For smaller organisms, sequencing for stomach content is then often done by sequencing the entire animal.
Barcoding for food safety
DNA barcoding represents an essential tool to evaluate the quality of food products. The purpose is to guarantee food traceability, to minimize food piracy, and to valuate local and typical agro-food production. Another purpose is to safeguard public health; for example, metabarcoding offers the possibility to identify groupers causing Ciguatera fish poisoning from meal remnants, or to separate poisonous mushrooms from edible ones (Ref).
Biomonitoring and ecological assessment
DNA barcoding can be used to assess the presence of endangered species for conservation efforts (Ref), or the presence of indicator species reflective to specific ecological conditions (Ref), for example excess nutrients or low oxygen levels.
Potentials and shortcomings
Potentials
Traditional bioassessment methods are well established internationally, and serve biomonitoring well, as for example for aquatic bioassessment within the EU Directives WFD and MSFD. However, DNA barcoding could improve traditional methods for the following reasons; DNA barcoding (i) can increase taxonomic resolution and harmonize the identification of taxa which are difficult to identify or lack experts, (ii) can more accurately/precisely relate environmental factors to specific taxa (iii) can increase comparability among regions, (iv) allows for the inclusion of early life stages and fragmented specimens, (v) allows delimitation of cryptic/rare species (vi) allows for development of new indices e.g. rare/cryptic species which may be sensitive/tolerant to stressors, (vii) increases the number of samples which can be processed and reduces processing time resulting in increased knowledge of species ecology, (viii) is a non-invasive way of monitoring when using eDNA methods.
Time and cost
DNA barcoding is faster than traditional morphological methods all the way from training through to taxonomic assignment. It takes less time to gain expertise in DNA methods than becoming an expert in taxonomy. In addition, the DNA barcoding workflow (i.e. from sample to result) is generally quicker than traditional morphological workflow and allows the processing of more samples.
Taxonomic resolution
DNA barcoding allows the resolution of taxa from higher (e.g. family) to lower (e.g. species) taxonomic levels, that are otherwise too difficult to identify using traditional morphological methods, like e.g. identification via microscopy. For example, Chironomidae (the non-biting midge) are widely distributed in both terrestrial and freshwater ecosystems. Their richness and abundance make them important for ecological processes and networks, and they are one of many invertebrate groups used in biomonitoring. Invertebrate samples can contain as many as 100 species of chironomids which often make up as much as 50% of a sample. Despite this, they are usually not identified below the family level because of the taxonomic expertise and time required. This may result in different chironomid species with different ecological preferences grouped together, resulting in inaccurate assessment of water quality.
DNA barcoding provides the opportunity to resolve taxa, and directly relate stressor effects to specific taxa such as individual chironomid species. For example, Beermann et al. (2018) DNA barcoded Chironomidae to investigate their response to multiple stressors; reduced flow, increased fine-sediment and increased salinity. After barcoding, it was found that the chironomid sample consisted of 183 Operational Taxonomic Units (OTUs), i.e. barcodes (sequences) that are often equivalent to morphological species. These 183 OTUs displayed 15 response types rather than the previously reported two response types recorded when all chironomids were grouped together in the same multiple stressor study. A similar trend was discovered in a study by Macher et al. (2016) which discovered cryptic diversity within the New Zealand mayfly species Deleatidium sp. This study found different response patterns of 12 molecular distinct OTUs to stressors which may change the consensus that this mayfly is sensitive to pollution.
Shortcomings
Despite the advantages offered by DNA barcoding, it has also been suggested that DNA barcoding is best used as a complement to traditional morphological methods. This recommendation is based on multiple perceived challenges.
Physical parameters
It is not completely straightforward to connect DNA barcodes with ecological preferences of the barcoded taxon in question, as is needed if barcoding is to be used for biomonitoring. For example, detecting target DNA in aquatic systems depends on the concentration of DNA molecules at a site, which in turn can be affected by many factors. The presence of DNA molecules also depends on dispersion at a site, e.g. direction or strength of currents. It is not really known how DNA moves around in streams and lakes, which makes sampling difficult. Another factor might be the behavior of the target species, e.g. fish can have seasonal changes of movements, crayfish or mussels will release DNA in larger amounts just at certain times of their life (moulting, spawning). For DNA in soil, even less is known about distribution, quantity or quality.
The major limitation of the barcoding method is that it relies on barcode reference libraries for the taxonomic identification of the sequences. The taxonomic identification is accurate only if a reliable reference is available. However, most databases are still incomplete, especially for smaller organisms e.g. fungi, phytoplankton, nematoda etc. In addition, current databases contain misidentifications, spelling mistakes and other errors. There is massive curation and completion effort around the databases for all organisms necessary, involving large barcoding projects (for example the iBOL project for the Barcode of Life Data Systems (BOLD) reference database). However, completion and curation are difficult and time-consuming. Without vouchered specimens, there can be no certainty about whether the sequence used as a reference is correct.
DNA sequence databases like GenBank contain many sequences that are not tied to vouchered specimens (for example, herbarium specimens, cultured cell lines, or sometimes images). This is problematic in the face of taxonomic issues such as whether several species should be split or combined, or whether past identifications were sound. Reusing sequences, not tied to vouchered specimens, of initially misidentified organism may support incorrect conclusions and must be avoided. Therefore, best practice for DNA barcoding is to sequence vouchered specimens. For many taxa, it can be however difficult to obtain reference specimens, for example with specimens that are difficult to catch, available specimens are poorly conserved, or adequate taxonomic expertise is lacking.
Importantly, DNA barcodes can also be used to create interim taxonomy, in which case OTUs can be used as substitutes for traditional Latin binomials – thus significantly reducing dependency on fully populated reference databases.
Technological bias
DNA barcoding also carries methodological bias, from sampling to bioinformatics data analysis. Beside the risk of contamination of the DNA sample by PCR inhibitors, primer bias is one of the major sources of errors in DNA barcoding. The isolation of an efficient DNA marker and the design of primers is a complex process and considerable effort has been made to develop primers for DNA barcoding in different taxonomic groups. However, primers will often bind preferentially to some sequences, leading to differential primer efficiency and specificity and unrepresentative communities’ assessment and richness inflation. Thus, the composition of the sample's communities sequences is mainly altered at the PCR step. Besides, PCR replication is often required, but leads to an exponential increase in the risk of contamination. Several studies have highlighted the possibility to use mitochondria-enriched samples or PCR-free approaches to avoid these biases, but as of today, the DNA metabarcoding technique is still based on the sequencing of amplicons. Other bias enter the picture during the sequencing and during the bioinformatic processing of the sequences, like the creation of chimeras.
Lack of standardization
Even as DNA barcoding is more widely used and applied, there is no agreement concerning the methods for DNA preservation or extraction, the choices of DNA markers and primers set, or PCR protocols. The parameters of bioinformatics pipelines (for example OTU clustering, taxonomic assignment algorithms or thresholds etc.) are at the origin of much debate among DNA barcoding users. Sequencing technologies are also rapidly evolving, together with the tools for the analysis of the massive amounts of DNA data generated, and standardization of the methods is urgently needed to enable collaboration and data sharing at greater spatial and time-scale. This standardisation of barcoding methods at the European scale is part of the objectives of the European COST Action DNAqua-net and is also addressed by CEN (the European Committee for Standardization).
Another criticism of DNA barcoding is its limited efficiency for accurate discrimination below species level (for example, to distinguish between varieties), for hybrid detection, and that it can be affected by evolutionary rates (Ref needed).
Mismatches between conventional (morphological) and barcode based identification
It is important to know that taxa lists derived by conventional (morphological) identification are not, and maybe never will be, directly comparable to taxa lists derived from barcode based identification because of several reasons. The most important cause is probably the incompleteness and lack of accuracy of the molecular reference databases preventing a correct taxonomic assignment of eDNA sequences. Taxa not present in reference databases will not be found by eDNA, and sequences linked to a wrong name will lead to incorrect identification. Other known causes are a different sampling scale and size between a traditional and a molecular sample, the possible analysis of dead organisms, which can happen in different ways for both methods depending on organism group, and the specific selection of identification in either method, i.e. varying taxonomical expertise or possibility to identify certain organism groups, respectively primer bias leading also to a potential biased analysis of taxa.
Estimates of richness/diversity
DNA Barcoding can result in an over or underestimate of species richness and diversity. Some studies suggest that artifacts (identification of species not present in a community) are a major cause of inflated biodiversity. The most problematic issue are taxa represented by low numbers of sequencing reads. These reads are usually removed during the data filtering process, since different studies suggest that most of these low-frequency reads may be artifacts. However, real rare taxa may exist among these low-abundance reads. Rare sequences can reflect unique lineages in communities which make them informative and valuable sequences. Thus, there is a strong need for more robust bioinformatics algorithms that allow the differentiation between informative reads and artifacts. Complete reference libraries would also allow a better testing of bioinformatics algorithms, by permitting a better filtering of artifacts (i.e. the removal of sequences lacking a counterpart among extant species) and therefore, it would be possible obtain a more accurate species assignment. Cryptic diversity can also result in inflated biodiversity as one morphological species may actually split into many distinct molecular sequences.
Metabarcoding
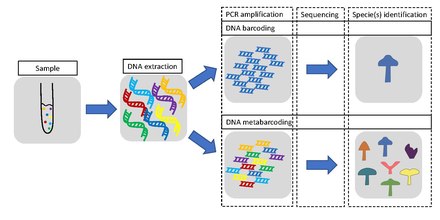
Metabarcoding is defined as the barcoding of DNA or eDNA (environmental DNA) that allows for simultaneous identification of many taxa within the same (environmental) sample, however often within the same organism group. The main difference between the approaches is that metabarcoding, in contrast to barcoding, does not focus on one specific organism, but instead aims to determine species composition within a sample.
Methodology
The metabarcoding procedure, like general barcoding, covers the steps of DNA extraction, PCR amplification, sequencing and data analysis. A barcode consists of a short variable gene region (for example, see different markers/barcodes) which is useful for taxonomic assignment flanked by highly conserved gene regions which can be used for primer design. Different genes are used depending if the aim is to barcode single species or metabarcoding several species. In the latter case, a more universal gene is used. Metabarcoding does not use single species DNA/RNA as a starting point, but DNA/RNA from several different organisms derived from one environmental or bulk sample.
Applications
Metabarcoding has the potential to complement biodiversity measures, and even replace them in some instances, especially as the technology advances and procedures gradually become cheaper, more optimized and widespread.
DNA metabarcoding applications include:
- Biodiversity monitoring in terrestrial and aquatic environments
- Paleontology and ancient ecosystems
- Plant-pollinator interactions
- Diet analysis
- Food safety
Advantages and challenges
The general advantages and shortcomings for barcoding reviewed above are valid also for metabarcoding. One particular drawback for metabarcoding studies is that there is no consensus yet regarding the optimal experimental design and bioinformatics criteria to be applied in eDNA metabarcoding. However, there are current joined attempts, like e.g. the EU COST network DNAqua-Net, to move forward by exchanging experience and knowledge to establish best-practice standards for biomonitoring.