Search This Blog

Wednesday, April 27, 2022

Exploration

From Wikipedia, the free encyclopedia

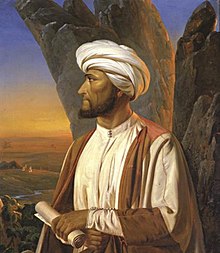
Professor G. A. Wallin (1811–1852), a Finnish explorer and orientalist, who is remembered for his journeys to the Middle East during the 1840s. Portrait of Wallin by R. W. Ekman, 1853.

Exploration is the act of searching for the purpose of discovery of information or resources, especially in the context of geography or space, rather than research and development that is usually not centred on earth sciences or astronomy. Exploration occurs in all non-sessile animal species, including humans. In human history, its most dramatic rise was during the Age of Discovery when European explorers sailed and charted much of the rest of the world for a variety of reasons. Since then, major explorations after the Age of Discovery have occurred for reasons mostly aimed at information discovery.

Concept

Exploration (like science more generally), particularly its understanding and use has been critically discussed as historically being framed and used, at the latest since the Age of Discovery up to the contemporary age of space exploration, for colonialistic ventures, discrimination and exploitation, by reinvigorating concepts such as the "frontier" (as in frontierism) and manifest destiny.

Notable historical periods of human exploration

Phoenician galley sailings

The Phoenicians (1550 BCE–300 BCE) traded throughout the Mediterranean Sea and Asia Minor though many of their routes are still unknown today. The presence of tin in some Phoenician artifacts suggests that they may have traveled to Britain. According to Virgil's Aeneid and other ancient sources, the legendary Queen Dido was a Phoenician from Tyre who sailed to North Africa and founded the city of Carthage.

Carthaginean exploration of Western Africa

Hanno the Navigator (500 BC), a Carthaginean navigator who explored the Western Coast of Africa.

Greek & Roman exploration of Northern Europe and Thule

Roman explorations

Africa Exploration

The Romans organized expeditions to cross the Sahara desert with five different routes:

All these expeditions were supported by legionaries and had mainly a commercial purpose. Only the one done by emperor Nero seemed to be a preparative for the conquest of Ethiopia or Nubia: in 62 AD two legionaries explored the sources of the Nile river.

One of the main reasons of the explorations was to get gold using the camel to transport it.

The explorations near the African western and eastern coasts were supported by Roman ships and deeply related to the naval commerce (mainly toward the Indian Ocean). The Romans also organized several explorations into Northern Europe, and explored as far as China in Asia.

30 BC-640 AD
With the acquisition of Ptolemaic Egypt, the Romans begin trading with India. The Romans now have a direct connection to the spice trade, which the Egyptians had established beginning in 118 BC.
100 AD-166 AD
Sino-Roman relations begin. Ptolemy writes of the Golden Chersonese (i.e. Malay Peninsula) and the trade port of Kattigara, now identified as Óc Eo in northern Vietnam, then part of Jiaozhou, a province of the Chinese Han Empire. The Chinese historical texts describe Roman embassies, from a land they called Daqin.
2nd century
Roman traders reach Siam, Cambodia, Sumatra, and Java.
161
An embassy from Roman Emperor Antoninus Pius or his successor Marcus Aurelius reaches Chinese Emperor Huan of Han at Luoyang.
226
A Roman diplomat or merchant lands in northern Vietnam and visits Nanjing, China and the court of Sun Quan, ruler of Eastern Wu

Chinese exploration of Central Asia

During the 2nd century BC, the Han dynasty explored much of the Eastern Northern Hemisphere. Starting in 139 BC, the Han diplomat Zhang Qian traveled west in an unsuccessful attempt to secure an alliance with the Da Yuezhi against the Xiongnu (the Yuezhi had been evicted from Gansu by the Xiongnu in 177 BC); however, Zhang's travels discovered entire countries which the Chinese were unaware of, including the remnants of the conquests of Alexander the Great (r. 336–323 BC). When Zhang returned to China in 125 BC, he reported on his visits to Dayuan (Fergana), Kangju (Sogdia), and Daxia (Bactria, formerly the Greco-Bactrian Kingdom which had just been subjugated by the Da Yuezhi). Zhang described Dayuan and Daxia as agricultural and urban countries like China, and although he did not venture there, described Shendu (the Indus River valley of Northwestern India) and Anxi (Parthian territories) further west.

Viking Age

Viking settlements and voyages

From about 800 AD to 1040 AD, the Vikings explored Iceland and much of the Western Northern Hemisphere via rivers and oceans. For example, it is known that the Norwegian Viking explorer, Erik the Red (950–1003), sailed to and settled in Greenland after being expelled from Iceland, while his son, the Icelandic explorer Leif Erikson (980–1020), reached Newfoundland and the nearby North American coast, and is believed to be the first European to land in North America.

Polynesian Age

Austronesian expansion map

Polynesians were a maritime people, who populated and explored the central and south Pacific for around 5,000 years, up to about 1280 when they discovered New Zealand. The key invention to their exploration was the outrigger canoe, which provided a swift and stable platform for carrying goods and people. Based on limited evidence, it is thought that the voyage to New Zealand was deliberate. It is unknown if one or more boats went to New Zealand, or the type of boat, or the names of those who migrated. 2011 studies at Wairau Bar in New Zealand show a high probability that one origin was Ruahine Island in the Society Islands. Polynesians may have used the prevailing north easterly trade winds to reach New Zealand in about three weeks. The Cook Islands are in direct line along the migration path and may have been an intermediate stopping point. There are cultural and language similarities between Cook Islanders and New Zealand Māori. Early Māori had different legends of their origins, but the stories were misunderstood and reinterpreted in confused written accounts by early European historians in New Zealand trying to present a coherent pattern of Māori settlement in New Zealand.

Mathematical modelling based on DNA genome studies, using state of the art techniques, have shown that a large number of Polynesian migrants (100–200), including women, arrived in New Zealand around the same time, in about 1280. Otago University studies have tried to link distinctive DNA teeth patterns, which show special dietary influence, with places in or nearby the Society Islands.

Chinese exploration of the Indian Ocean

The Chinese explorer, Wang Dayuan (fl. 1311–1350) made two major trips by ship to the Indian Ocean. During 1328–1333, he sailed along the South China Sea and visited many places in Southeast Asia and reached as far as South Asia, landing in Sri Lanka and India, and he even went to Australia. Then in 1334–1339, he visited North Africa and East Africa. Later, the Chinese admiral Zheng He (1371–1433) made seven voyages to Arabia, East Africa, India, Indonesia and Thailand.

European Age of Discovery

The Age of Discovery, also known as the Age of Exploration, is one of the most important periods of geographical exploration in human history. It started in the early 15th century and lasted until the 17th century. In that period, Europeans discovered and/or explored vast areas of the Americas, Africa, Asia and Oceania. Portugal and Spain dominated the first stages of exploration, while other European nations followed, such as England, Netherlands, and France.

Outward and return voyages of the Portuguese India run in the Atlantic and the Indian oceans, with the North Atlantic Gyre (volta do mar) picked up by Henry's navigators, and the outward route of the South Atlantic westerlies that Bartolomeu Dias discovered in 1488, followed and explored by the expeditions of Vasco da Gama and Pedro Alvares Cabral.

Important explorations during this period went to a number of continents and regions around the globe. In Africa, important explorers of this period include Diogo Cão (1452-1486) who discovered and ascended the Congo River and reached the coasts of present-day Angola and Namibia; and Bartolomeu Dias (1450–1500), the first European to reach the Cape of Good Hope and other parts of the South African coast.

Explorers of routes from Europe towards Asia, the Indian Ocean, and the Pacific Ocean, include Vasco da Gama (1460–1524), a navigator who made the first trip from Europe to India and back by the Cape of Good Hope, discovering the ocean route to the East; Pedro Álvares Cabral (c. 1467/1468 – c. 1520) who, following the path of Vasco da Gama, claimed Brazil and led the first expedition that linked Europe, Africa, America, and Asia; Diogo Dias, who discovered the eastern coast of Madagascar and rounded the corner of Africa; explorers such as Diogo Fernandes Pereira and Pedro Mascarenhas (1470–1555), among others, who discovered and mapped the Mascarene Islands and other archipelagos.

António de Abreu (1480-1514) and Francisco Serrão (14?–1521) led the first direct European fleet into the Pacific Ocean (on its western edges) and through the Sunda Islands, reaching the Moluccas. Andrés de Urdaneta (1498–1568) discovered the maritime route from Asia to the Americas.

In the Pacific Ocean, Jorge de Menezes (1498–1537) reached New Guinea while García Jofre de Loaísa (1490–1526) reached the Marshall Islands.

Discovery of America

Explorations of the Americas began with the initial discovery of America by Christopher Columbus (1451–1506), who led a Castilian (Spanish) expedition across the Atlantic, discovering America. After the discovery of America by Columbus, a number of important expeditions were sent out to explore the Western Hemisphere. This included Juan Ponce de León (1474–1521), who discovered and mapped the coast of Florida; Vasco Núñez de Balboa (c. 1475–1519), who was the first European to view the Pacific Ocean from American shores (after crossing the Isthmus of Panama) confirming that America was a separate continent from Asia; Aleixo Garcia (14?–1527), who explored the territories of present-day southern Brazil, Paraguay and Bolivia, crossing the Chaco and reaching the Andes (near Sucre).

Álvar Núñez Cabeza de Vaca (1490–1558) discovered the Mississippi River and was the first European to sail the Gulf of Mexico and cross Texas. Jacques Cartier (1491–1557) drew the first maps of part of central and maritime Canada; Francisco Vázquez de Coronado (1510–1554) discovered the Grand Canyon and the Colorado River; Francisco de Orellana (1511–1546) was the first European to navigate the length of the Amazon River.

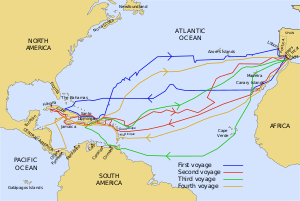
The routes of Captain James Cook's voyages. The first voyage is shown in red, second voyage in green, and third voyage in blue.
Further explorations

Ferdinand Magellan (1480–1521), was the first navigator to cross the Pacific Ocean, discovering the Strait of Magellan, the Tuamotus and Mariana Islands, and achieving a nearly complete circumnavigation of the Earth, in multiple voyages, for the first time. Juan Sebastián Elcano (1476–1526), completed the first global circumnavigation.

In the second half of the 16th century and the 17th century exploration of Asia and the Pacific Ocean continued with explorers such as Andrés de Urdaneta (1498–1568), who discovered the maritime route from Asia to the Americas; Pedro Fernandes de Queirós (1565–1614), who discovered the Pitcairn Islands and the Vanuatu archipelago; Álvaro de Mendaña de Neira (1542–1595), who discovered the Tuvalu archipelago, the Marquesas, the Solomon Islands and Wake Island.

Explorers of Australia included Willem Janszoon (1570–1630), who made the first recorded European landing in Australia; Yñigo Ortiz de Retez, who discovered and reached eastern and northern New Guinea; Luis Váez de Torres (1565–1613), who discovered the Torres Strait between Australia and New Guinea; Abel Tasman (1603–1659), who explored North Australia, discovered Tasmania, New Zealand and Tongatapu.

In North America, major explorers included Henry Hudson (156?–1611), who explored the Hudson Bay in Canada; Samuel de Champlain (1574–1635), who explored St. Lawrence River and the Great Lakes (in Canada and northern United States); and René-Robert Cavelier, Sieur de La Salle (1643–1687), who explored the Great Lakes region of the United States and Canada, and the entire length of the Mississippi River.

The Modern Age

Long after the golden age of discovery, other explorers completed the world map, such as various Russians explorers, reaching the Siberian Pacific coast and the Bering Strait, at the extreme edge of Asia and Alaska (North America); Vitus Bering (1681–1741) who in the service of the Russian Navy, explored the Bering Strait, the Bering Sea, the North American coast of Alaska, and some other northern areas of the Pacific Ocean; and James Cook, who explored the east coast of Australia, the Hawaiian Islands, and circumnavigated Antarctica.

There were still significant explorations which occurred well into the modern age. This includes the Lewis and Clark Expedition (1804-1806), an overland expedition dispatched by President Thomas Jefferson to explore the newly acquired Louisiana Purchase and to find an interior aquatic route to the Pacific Ocean, along with other objectives to examine the flora and fauna of the continent. In 1818, the British researcher Sir John Ross was the first to find that the deep sea is inhabited by life when catching jellyfish and worms in about 2,000 m (6,562 ft) depth with a special device. The United States Exploring Expedition (1838-1842) was an expedition sent by President Andrew Jackson, in order to survey the Pacific Ocean and surrounding lands.

The extreme conditions in the deep sea require elaborate methods and technologies to endure them. In the 20th century, deep-sea exploration advanced considerably through a series of technological inventions, ranging from the sonar system, which can detect the presence of objects underwater through the use of sound, to manned deep-diving submersibles. In 1960, Jacques Piccard and United States Navy Lieutenant Donald Walsh descended in the bathyscaphe Trieste into the deepest part of the world's oceans, the Mariana Trench. In 2018, DSV Limiting Factor, piloted by Victor Vescovo, completed the first mission to the deepest point of the Atlantic Ocean, diving 8,375 m (27,477 ft) below the ocean surface to the base of the Puerto Rico Trench. With the advent of satellite imagery and aviation, exploration of the surface of Earth has largely ceased, however the culture of many disconnected tribes still remain undocumented and left to be explored. Urban exploration is the exploration of manmade structures, usually abandoned ruins or hidden components of the manmade environment.

Space exploration

Space exploration started in the 20th century with the invention of exo-atmospheric rockets. This has given humans the opportunity to travel to the Moon, and to send robotic explorers to other planets and far beyond.

Both of the Voyager probes have left the Solar System, bearing imprinted gold discs with multiple data types.

Behavioral trait

A 2015 study, performed on mobile phone data and on GPS tracks of private vehicles in Italy, demonstrated that individuals naturally split into two well-defined categories according to their mobility habits, dubbed "returners" and "explorers". "Explorers" showed a star-like mobility pattern: they have a central core of locations (composed by home and work places) around which distant core of locations gravitates.
Evidence-based policy

From Wikipedia, the free encyclopedia

Evidence-based policy is an idea in public policy proposing that policy decisions should be based on, or informed by, rigorously established objective evidence. The implied contrast is with policymaking based on ideology, 'common sense,' anecdotes, and intuitions. It is the government equivalent of the effective altruism movement. Evidence-based policy uses a thorough research method, such as randomized controlled trials (RCT). Good data, analytical skills, and political support to the use of scientific information are typically seen as the crucial elements of an evidence-based approach.

Some have promoted particular types of evidence as 'best' for policymakers to consider, including scientifically rigorous evaluation studies such as randomized controlled trials to identify programs and practices capable of improving policy-relevant outcomes. However, some areas of policy-relevant knowledge may not be well served by quantitative research. This has led to a debate about the type of evidence to use. For instance, policies concerned with human rights, public acceptability, or social justice may require proof other than randomized trials provide. Also, policy evaluation may require moral philosophical reasoning in addition to considerations of evidence of intervention effect (which randomized trials are principally designed to provide). The purpose of evidence-based policy is to use scientific evidence in rigorously and comprehensively to inform decisions rather than to allow political processes to use them in a piecemeal, manipulated, or cherry-picked manner.

Some policy scholars now avoid using the term evidence-based policy, using others such as evidence-informed. This language shift allows continued thinking about the underlying desire to improve evidence use in terms of its rigor or quality while avoiding some of the key limitations or reductionist ideas at times seen with the evidence-based language. Still, the language of evidence-based policy is widely used and, as such, can be interpreted to reflect a desire for evidence to be used well or appropriately in one way or another – such as by ensuring systematic consideration of rigorous and high-quality policy-relevant evidence, or by avoiding biased and erroneous applications of evidence for political ends.

A related group is the rationalist community.

History

The move towards modern evidence-based policy has its roots in the larger movement towards evidence-based practice, which was prompted by the rise of evidence-based medicine in the 1980s. However, the term 'Evidence-based policy' didn't see use in medicine until the 1990s. The term wasn't used in social policy until the early 2000s. The earliest example of evidence-based policy was tariff-making in Australia. The legislation required tariffs to be educated by a public report issued by the Tariff Board. These reported on the tariff, industrial, and economic impacts.

History of Evidence-Based Medicine

The phrase evidence-based medicine (EBM) was coined by Gordon Guyatt. However earlier example of EBM trace to the early 1900s. Some argue that the earliest form of EBM occurred in the 11th century, when Ben Cao Tu Jing from Song Dynasty said, "In order to evaluate the efficacy of ginseng, find two people and let one eat ginseng and run, the other run without ginseng. The one that did not eat ginseng will develop shortness of breath sooner." Many scholars see the term evidence-based policy as evolving from "evidence-based medicine", in which research findings are used as the support for clinical decisions and evidence is gathered by randomized controlled trials (RCTs), which is comparing a treatment group with a placebo group to measure results. Even though the earliest published RCTs in medicine were during WWII and post-war era: 1940s and 1905s, the term 'evidence-based medicine' did not appear in published medical research until 1993. In 1993, the Cochrane Collaboration was established in the UK, and works to keep all RCTs up-to-date and provides "Cochrane reviews" which provides primary research in human health and health policy. The evolution of the appearance of the keyword EBM has increased since the 2000s and the effect of EBM has seen significant expansion to the field of medicine.

History of Evidence-Based Policy Making

Randomized Controlled Trials were late to appear in the social policy compared to the medical field. Although evidence-based approach can be traced as far back as the fourteenth century, it was more recently popularized by the Blair Government in the United Kingdom. The Blair Government said they wanted to end the ideological led-based decision-making for policy making. For example, a UK Government white paper published in 1999 ("Modernising Government") noted that Government must "produce policies that really deal with problems, that are forward-looking and shaped by evidence rather than a response to short-term pressures; that tackle causes not symptoms". There was then an increase in research and policy activists pushing for more evidence-based policy-making which led to the formation of the sister organization to Cochrane Collaboration, the Campbell Collaboration in 1999. The Campbell Collaboration conducts reviews on the best evidence that analyzes the effects of social and educational policies and practices.

The Economic and Social Research Council (ESRC) became involved in the push for more evidence-based policymaking with its 1.3 million pound grant to the Evidence Network in 1999. The Evidence Network is a center for evidence-based policy and practice and is similar to both the Campbell and Cochrane Collaboration. More recently the Alliance for Useful Evidence has been established, with funding from ESRC, Big Lottery and Nesta, to champion the use of evidence in social policy and practice. The Alliance is a UK-wide network that promotes the use of high-quality evidence to inform decisions on strategy, policy and practice through advocacy, publishing research, sharing ideas and advice, and holding events and training.

People practice Evidence-based policy in different ways. For example, Michael Kremer and Rachel Glennerster had many theories about what would work best to improve students' test scores. Therefore, they conducted randomized controlled trials in Kenya. They tried new textbooks and flip charts, as well as smaller class sizes. However, they found that the only intervention that raised school attendance was treating intestinal worms in children. Based on their findings, they started the Deworm the World Initiative, which is rated by GiveWell as one of the best charities in the world for cost-effectiveness.

Recently questions have been raised about the conflicts of interest inherent to evidence-based decision-making used in public policy development. In a study of vocational education in prisons operated by the California Department of Corrections, Andrew J. Dick, William Rich, and Tony Waters found that political considerations inevitably intruded into “evidence-based decisions” which were ostensibly technocratic. They point out that this is particularly true where evidence is paid for by policymakers who have a vested interest in having past political judgments confirmed, evidence-based research is likely to be corrupted, leading to policy-based evidence making.

Methodology

There are many methodologies for evidence-based policy, however they all share the following characteristics:

  • Tests a theory as to why the policy will be effective and what the impacts of the policy will be if it is successful
  • Includes a counterfactual: what would have occurred if the policy had not been implemented
  • Incorporates some measurement of the impact
  • Examines both direct and indirect effects that occur because of the policy
  • Separates the uncertainties and controls for other influences outside of the policy that may affect the outcome
  • Should be able to be tested and replicated by a third party

The form of the methodology used with evidence-based policy fits under the cost-benefit framework. It is created to estimate a net payoff if the policy is implemented. Because there is a difficulty quantifying some effects and outcomes of the policy, it is mostly focused on whether benefits will outweigh costs, instead of using specific values.

Types of Evidence for Evidence-Based Policy Making

All kinds of data can be considered a piece of evidence. The Scientific Method effectively organizes this data into tests to strengthen or weaken specific beliefs or hypotheses. For example, the results of different tests can be more or less convincing to the scientific community, based on blind experiment type (i.e., blind vs. double-blind), sample size, and replication. However, supports of evidence-based policy attempt to combine what citizens want (within Maslow's Hierarchy of needs) with what the scientific method has shown will be the most likely produce it.

Quantitative Evidence

Numerical quantities from peer-reviewed journals, data from public surveillance systems, or individual programs are considered quantitative evidence for policymaking. Quantitative data can also be collected by the government or policymakers themselves through surveys. Qualitative evidence is widely used in EBM and evidence-based public health policy constructions.

Qualitative Evidence

Qualitative evidence includes nonnumerical data collected by methods that include observations, interviews, or focus groups. Qualitative evidence is widely used to create compelling stories to impact those in decision-making authority. Although the evidence can be divided according to their type, there is no hierarchical weight over qualitative vs. quantitative data. They are both efficient in acting as evidence in certain areas than others. Often, qualitative and quantitative evidence are combined in the process of policymaking.

Cause priorities

Some approach Evidence-based policy with cause neutrality: they first define the goal or human interest and use Evidence-based processes to identify the most effective method.cause neutrality. Examples of causes include providing food for the hungry, protecting endangered species, mitigating climate change, reforming immigration policy, researching cures for illnesses, preventing sexual violence, alleviating poverty, eliminating factory farming, or averting nuclear warfare. Many people in the effective policy movement have prioritized global health and development, animal welfare, and mitigating risks that threaten the future of humanity.

Global health and development

A poor family near Dadaab, Kenya

The alleviation of global poverty and neglected tropical diseases has been a focus of some of the earliest and most prominent organizations associated with the movement to use evidence to make decisions.

Charity evaluator GiveWell was founded by Holden Karnofsky and Elie Hassenfeld in 2007 to address poverty. GiveWell has argued that the marginal impact of donations is greatest for attacking global poverty and health. Its leading recommendations have been in these domains: malaria prevention charities Against Malaria Foundation and Malaria Consortium, deworming charities Schistosomiasis Control Initiative and Deworm the World Initiative, and GiveDirectly for direct unconditional cash transfers.

The Life You Can Save, which originated from Singer's book of the same name, works to alleviate global poverty by promoting evidence-backed charities, conducting philanthropy education, and changing the culture of giving in affluent countries.

While much of the initial focus has been on direct strategies such as health interventions and cash transfers, more systematic social, economic, and political reforms meant to facilitate larger long-term poverty reduction have also attracted attention. In 2011, GiveWell announced the creation of GiveWell Labs, which was later renamed the Open Philanthropy Project, for the purpose of research and philanthropic funding of more speculative and diverse causes such as policy reform, global catastrophic risk reduction and scientific research. It is a collaboration between GiveWell and Good Ventures.

Long-term future and global catastrophic risks

Global catastrophic risks, such as those arising from pandemics, are a priority.

Focusing on the long-term future, some believe that the total value of any meaningful metric (wealth, potential for suffering, potential for happiness, etc.) summed up over future generations, far exceeds the value for people living today. Some researchers have found it psychologically difficult to contemplate the trade-off; Toby Ord stated, "Since there is so much work to be done to fix the needless suffering in our present, I was slow to turn to the future." Reasons Ord gave for working on long-term issues include a belief that preventing long-term suffering is "even more neglected" than causes related to current suffering, and that the residents of the future are even more powerless to affect risks caused by current events than are current dispossessed populations".

Philosophically, assessing the suffering of future populations involves multiple considerations. First, humanity (and other animals) may not exist at all, in which cases there is no suffering to alleviate (presuming that the process of eliminating the population does not itself involve suffering). Second, the cost of an incremental reduction in suffering in the future may be higher (e.g., because of increasing healthcare costs) or lower (brought down, e.g., by the ever-crashing cost of computing or renewable energy). Third, the value of a benefit or cost is affected by the time preferences of the recipient and the payer. Fourth, future suffering may be alleviated by current spending, potentially at a lower cost. Fifth, alleviating suffering sooner may have a knock-on effect of reducing/increasing future suffering. Sixth, if investing money produces outsized returns, that may provide the ability to reduce total suffering by more than if the money is instead donated before it can accumulate. Seventh, future populations may be so much wealthier than the current population that, even if a particular reduction in suffering costs more than it does today, the population might still be better off by waiting. Singer argued that existential risk should not be "the dominant public face of the effective altruism movement" because he claimed that doing so would drastically limit the movement's reach.

In particular, the importance of addressing existential risks such as dangers associated with biotechnology and advanced artificial intelligence is often highlighted and the subject of active research. Because it is generally infeasible to use traditional research techniques such as randomized controlled trials to analyze existential risks, researchers such as Nick Bostrom have used methods such as expert opinion elicitation to estimate their importance. Ord offered probability estimates for a number of existential risks in his 2020 book The Precipice.

Organizations that work actively on research and advocacy for improving the long-term future are the Future of Humanity Institute at the University of Oxford, the Centre for the Study of Existential Risk at the University of Cambridge, and the Future of Life Institute. In addition, the Machine Intelligence Research Institute is focused on the more narrow mission of managing advanced artificial intelligence.

Evidence-based policy from Non-Government Organizations

The Overseas Development Institute

The Overseas Development Institute claims that research-based evidence can contribute to policies that dramatically impact lives. Success stories quoted in the UK's Department for International Development's (DFID) new research strategy include a 22% reduction in neonatal mortality in Ghana as a result of helping women begin breastfeeding within one hour of giving birth and a 43% reduction in deaths among HIV positive children using a widely available antibiotic.

After many policy initiatives, the Overseas Development Institute evaluated their evidence-based policy efforts. They identified specific reasons that policy is weakly informed by research-based evidence. Policy processes are complex and rarely linear or logical. Therefore, simply presenting information to policy-makers and expecting them to act upon it is very unlikely to work. These reasons include information gaps, secrecy, the need for speedy responses and slow data, political expediency (what is popular), and the fact that policy-makers are not interested in making the policy more scientific. When a gap is identified between the scientific and political process, those interested in shrinking the gap must choose between making their politicians use scientific techniques or their scientists use more political methods.

The Overseas Development Institute concluded that, with the lack of evidence-based policy progress, those with the data should move into the political and advertising world of emotion and storytelling to influence those in power. They replaced simple tools such as cost–benefit analysis and logical frameworks, with identifying the key players, being good storytellers, synthesizing complex data from their research into simple, compelling stories. The Overseas Development Institute did not advocate for re-making the system to support evidence-based policy but encouraged those with data to jump into the political process.

Further, they concluded that turning someone who 'finds' data into someone who 'uses' data in our current system involves a fundamental reorientation towards policy engagement rather than academic achievement. This focus requires engaging much more with the policy community, developing a research agenda focusing on policy issues rather than academic interests, acquiring new skills or building multidisciplinary teams, establishing new internal systems and incentives, spending much more on communications, producing a different range of outputs, and working more in partnerships and networks.

Based on research conducted in six Asian and African countries, the Future Health Systems consortium has identified a set of critical strategies for improving uptake of evidence into policy, including improving the technical capacity of policy-makers; better packaging of research findings; use of social networks; establishment of fora to assist in linking evidence with policy outcomes.

The Pew Charitable Trust

The Pew Charitable Trust is a non-governmental organization that has attempts to use data, science, and facts to serve the public good. Pew has a Results First initiative that works with the different US states to implement evidence-based policymaking in the development of their laws. This initiative has developed a framework may be seen as an example of how to implement evidence based policy.

Pew's 5 key components of Evidence-based policy are:

  • Program assessment. Systematically review available evidence on the effectiveness of public programs.
    • Develop an inventory of funded programs.
    • Categorize programs by their evidence of effectiveness.
    • Identify programs’ potential return on investment.
  • Budget development. Incorporate evidence of program effectiveness into budget and policy decisions, giving funding priority to those that deliver a high return on investment of public funds.
    • Integrate program performance information into the budget development process.
    • Present information to policymakers in user-friendly formats that facilitate decision-making.
    • Include relevant studies in budget hearings and committee meetings.
    • Establish incentives for implementing evidence-based programs and practices.
    • Build performance requirements into grants and contracts.
  • Implementation oversight. Ensure that programs are effectively delivered and are faithful to their intended design.
    • Establish quality standards to govern program implementation.
    • Build and maintain capacity for ongoing quality improvement and monitoring of fidelity to program design.
    • Balance program fidelity requirements with local needs.
    • Conduct data-driven reviews to improve program performance.
  • Outcome monitoring. Routinely measure and report outcome data to determine whether programs are achieving desired results.
    • Develop meaningful outcome measures for programs, agencies, and the community.
    • Conduct regular audits of systems for collecting and reporting performance data.
    • Regularly report performance data to policymakers.
  • Targeted evaluation. Conduct rigorous evaluations of new and untested programs to ensure that they warrant continued funding.
    • Leverage available resources to conduct evaluations.
    • Target evaluations to high-priority programs.
    • Make better use of administrative data—information typically collected for operational and compliance purposes—to enhance program evaluations.
    • Require evaluations as a condition for continued funding for new initiatives.
    • Develop a centralized repository for program evaluations.

The Coalition for Evidence-Based Policy

The Coalition for Evidence-Based Policy was a nonprofit, nonpartisan organization, whose mission was to increase government effectiveness through the use of rigorous evidence about "what works." Since 2001, the Coalition worked with U.S. Congressional and Executive Branch officials and advanced evidence-based reforms in U.S. social programs, which have been enacted into law and policy. The Coalition claimed to have no affiliation with any programs or program models, and no financial interest in the policy ideas it supported, enabling it to serve as an independent, objective source of expertise to government officials on evidence-based policy.

Major new policy initiatives that were enacted into law with the work of Coalition with congressional and executive branch officials.

  • Evidence-Based Home Visitation Program for at-risk families with young children (Department of Health and Human Services – HHS, $1.5 billion over 2010-2014
  • Evidence-Based Teen Pregnancy Prevention Program (HHS, $109 million in FY14)
  • Investing in Innovation Fund, to fund development and scale-up of evidence-based K-12 educational interventions (Department of Education, $142 million in FY14)
  • First in the World Initiative, to fund development and scale-up of evidence-based interventions in postsecondary education (Department of Education, $75 million in FY14)
  • Social Innovation Fund, to support public/private investment in evidence-based programs in low-income communities (Corporation for National and Community Service, $70 million in FY14)
  • Trade Adjustment Assistance Community College and Career Training Grants Program, to fund development and scale-up of evidence-based education and career training programs for dislocated workers (Department of Labor – DOL, $2 billion over 2011-2014)
  • Workforce Innovation Fund, to fund development and scale-up of evidence-based strategies to improve education/employment outcomes for U.S. workers (DOL, $47 million in FY14).

Their website now says "The Coalition wound down its operations in the spring of 2015, and the Coalition’s leadership and core elements of the group’s work have been integrated into the Laura and John Arnold Foundation". In 2003 the Coalition published a guide on educational evidenced-based practices.

Critiques

Several critiques have emerged. Paul Cairney, professor of politics and public policy at the University of Stirling in Scotland, argues that supporters of the idea underestimate the complexity of policy-making and misconstrue the way that policy decisions are usually made. Cartwright and Hardie oppose emphasizing randomized controlled trials (RCTs). They show that the evidence from RCTs is not always sufficient for undertaking decisions. In particular, they argue that extrapolating experimental evidence into policy context requires understanding what necessary conditions were present within the experimental setting and asserting that these factors also operate in the target of considered intervention. Furthermore, considering the prioritization of RCTs, the evidence-based policy can be accused of being preoccupied with narrowly understood ‘interventions’ denoting surgical actions on one causal factor to influence its effect.

The definition of intervention presupposed by the movement of evidence-based policy overlaps with James Woodward’s interventionist theory of causality. However, policy-making encompasses also other types of decisions such as institutional reforms and actions based on predictions. The other types of evidence-based decision-making do not require having at hand evidence for the causal relation to be invariant under intervention. Therefore, mechanistic evidence and observational studies suffice for introducing institutional reforms and undertaking actions that do not modify the causes of a causal claim.

Moreover, evidence has emerged of front-line public servants, like hospital managers, making decisions that actually worsen patients' care in order to hit pre-ordained targets. This argument was put forward by Professor Jerry Muller of the Catholic University of America in a book called The Tyranny of Metrics. According to articles published in Futures, evidence based policy - in the form of cost-based or risk analyses, may entail forms of compression and exclusion of the issues under analysis, also in relation to power asymmetries among different actors in their capacity to produce evidence. A comprehensive list of critiques, including the fact that policies shown to be successful in one place often fail in others, despite reaching a gold standard of evidence, has been compiled by the policy platform Apolitical.

Poverty threshold

From Wikipedia, the free encyclopedia
 
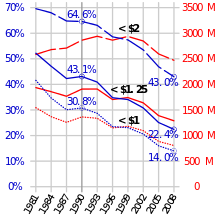
Graph of global population living on under 1, 1.25 and 2 equivalent of 2005 US dollars daily (red) and as a proportion of world population (blue) based on 1981–2008 World Bank data
 
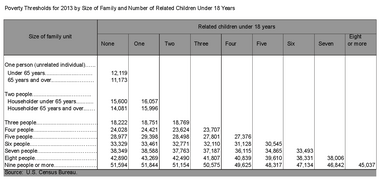
Poverty Thresholds for 2013

The poverty threshold, poverty limit, poverty line or breadline is the minimum level of income deemed adequate in a particular country. The poverty line is usually calculated by finding the total cost of all the essential resources that an average human adult consumes in one year. The largest of these expenses is typically the rent required for accommodation, so historically, economists have paid particular attention to the real estate market and housing prices as a strong poverty line affect. Individual factors are often used to account for various circumstances, such as whether one is a parent, elderly, a child, married, etc. The poverty threshold may be adjusted annually. In practice, like the definition of poverty, the official or common understanding of the poverty line is significantly higher in developed countries than in developing countries.

In October 2015, the World Bank updated the International Poverty Line (IPL), a global absolute minimum, to $1.90 per day (in PPP), where it current stands (as of 2022), and also as of 2022, $3.20 per day in PPP for lower-middle income countries, and $5.50 per day in PPP for upper-middle income countries. Per the $1.90/day standard, the percentage of the global population living in absolute poverty fell from over 80% in 1800 to 10% by 2015, according to United Nations estimates, which found roughly 734 million people remained in absolute poverty.

History

The poverty threshold was first developed by Mollie Orshansky between 1963 and 1964. She attributed the poverty threshold as a measure of income inadequacy by taking the cost of food plan per family of three or four and multiplying it by a factor of three. In 1969 the inter agency poverty level review committee adjusted the threshold for only price changes.

Charles Booth, a pioneering investigator of poverty in London at the turn of the 20th century, popularised the idea of a poverty line, a concept originally conceived by the London School Board. Booth set the line at 10 (50p) to 20 shillings (£1) per week, which he considered to be the minimum amount necessary for a family of four or five people to subsist on. Benjamin Seebohm Rowntree (1871–1954), a British sociological researcher, social reformer and industrialist, surveyed rich families in York, and drew a poverty line in terms of a minimum weekly sum of money "necessary to enable families … to secure the necessaries of a healthy life", which included fuel and light, rent, food, clothing, and household and personal items. Based on data from leading nutritionists of the period, he calculated the cheapest price for the minimum calorific intake and nutritional balance necessary, before people get ill or lose weight. He considered this amount to set his poverty line and concluded that 27.84% of the total population of York lived below this poverty line. This result corresponded with that from Booth's study of poverty in London and so challenged the view, commonly held at the time, that abject poverty was a problem particular to London and was not widespread in the rest of Britain. Rowntree distinguished between primary poverty, those lacking in income and secondary poverty, those who had enough income, but spent it elsewhere (1901:295–96).

Absolute poverty and the International Poverty Line

The term "absolute poverty" is also sometimes used as a synonym for extreme poverty. Absolute poverty is the absence of enough resources to secure basic life necessities.

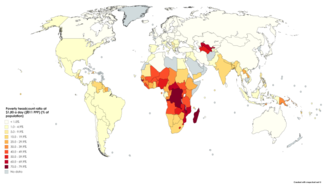
Poverty headcount ratio at $1.90 a day (2011 PPP) (% of population). Based on World Bank data ranging from 1998 to 2018.

To assist in measuring this, the World Bank has a daily per capita international poverty line (IPL), a global absolute minimum, of $1.90 a day as of October 2015.

The new IPL replaces the $1.25 per day figure, which used 2005 data. In 2008, the World Bank came out with a figure (revised largely due to inflation) of $1.25 a day at 2005 purchasing power parity (PPP). The new figure of $1.90 is based on ICP PPP calculations and represents the international equivalent of what $1.90 could buy in the US in 2011. Most scholars agree that it better reflects today's reality, particularly new price levels in developing countries. The common IPL has in the past been roughly $1 a day.

These figures are artificially low according to Peter Edward of Newcastle University. He believes the real number as of 2015 was $7.40 per day.

Using a single monetary poverty threshold is problematic when applied worldwide, due to the difficulty of comparing prices between countries. Prices of the same goods vary dramatically from country to country; while this is typically corrected for by using PPP exchange rates, the basket of goods used to determine such rates is usually unrepresentative of the poor, most of whose expenditure is on basic foodstuffs rather than the relatively luxurious items (washing machines, air travel, healthcare) often included in PPP baskets. The economist Robert C. Allen has attempted to solve this by using standardized baskets of goods typical of those bought by the poor across countries and historical time, for example including a fixed calorific quantity of the cheapest local grain (such as corn, rice, or oats).

Basic needs

The basic needs approach is one of the major approaches to the measurement of absolute poverty in developing countries. It attempts to define the absolute minimum resources necessary for long-term physical well-being, usually in terms of consumption goods. The poverty line is then defined as the amount of income required to satisfy those needs. The 'basic needs' approach was introduced by the International Labour Organization's World Employment Conference in 1976. "Perhaps the high point of the WEP was the World Employment Conference of 1976, which proposed the satisfaction of basic human needs as the overriding objective of national and international development policy. The basic needs approach to development was endorsed by governments and workers' and employers' organizations from all over the world. It influenced the programs and policies of major multilateral and bilateral development agencies, and was the precursor to the human development approach."

A traditional list of immediate "basic needs" is food (including water), shelter, and clothing. Many modern lists emphasize the minimum level of consumption of 'basic needs' of not just food, water, and shelter, but also sanitation, education, and health care. Different agencies use different lists. According to a UN declaration that resulted from the World Summit on Social Development in Copenhagen in 1995, absolute poverty is "a condition characterized by severe deprivation of basic human needs, including food, safe drinking water, sanitation facilities, health, shelter, education, and information. It depends not only on income, but also on access to services."

David Gordon's paper, "Indicators of Poverty and Hunger", for the United Nations, further defines absolute poverty as the absence of any two of the following eight basic needs:

A homeless man seeks shelter under a public bench
  • Food: Body mass index must be above 16.
  • Safe drinking water: Water must not come solely from rivers and ponds, and must be available nearby (fewer than 15 minutes' walk each way).
  • Sanitation facilities: Toilets or latrines must be accessible in or near the home.
  • Health: Treatment must be received for serious illnesses and pregnancy.
  • Shelter: Homes must have fewer than four people living in each room. Floors must not be made of soil, mud, or clay.
  • Education: Everyone must attend school or otherwise learn to read.
  • Information: Everyone must have access to newspapers, radios, televisions, computers, or telephones at home.
  • Access to services: This item is undefined by Gordon, but normally is used to indicate the complete panoply of education, health, legal, social, and financial (credit) services.

In 1978, Ghai investigated the literature that criticized the basic needs approach. Critics argued that the basic needs approach lacked scientific rigour; it was consumption-oriented and antigrowth. Some considered it to be "a recipe for perpetuating economic backwardness" and for giving the impression "that poverty elimination is all too easy". Amartya Sen focused on 'capabilities' rather than consumption.

In the development discourse, the basic needs model focuses on the measurement of what is believed to be an eradicable level of poverty.

Relative poverty

Relative poverty means low income relative to others in a country: for example, below 60% of the median income of people in that country.

Relative poverty measurements unlike absolute poverty measurements take the social economic environment of the people observed into consideration. It is based on the assumption that whether a person is considered poor depends on her/his income share relative to the income shares of other people who are living in the same economy. The threshold for relative poverty is considered to be at 50% of a country's median equivalised disposable income after social transfers. Thus, it can vary greatly from country to country even after adjusting for purchasing power standards (PPS).

A person can be poor in a relative terms but not in absolute terms as the person might be able to meet her/his basic needs, but not be able to enjoy the same standards of living that other people in the same economy are enjoying. Relative poverty is thus a form of social exclusion that can for example affect peoples access to decent housing, education or job opportunities.

The relative poverty measure is used by the United Nations Development Program (UNDP), the United Nations Children's Fund (UNICEF), the Organisation for Economic Co-operation and Development (OECD) and Canadian poverty researchers. In the European Union, the "relative poverty measure is the most prominent and most–quoted of the EU social inclusion indicators."

"Relative poverty reflects better the cost of social inclusion and equality of opportunity in a specific time and space."

"Once economic development has progressed beyond a certain minimum level, the rub of the poverty problem – from the point of view of both the poor individual and of the societies in which they live – is not so much the effects of poverty in any absolute form but the effects of the contrast, daily perceived, between the lives of the poor and the lives of those around them. For practical purposes, the problem of poverty in the industrialized nations today is a problem of relative poverty (page 9)."

However, some have argued that as relative poverty is merely a measure of inequality, using the term 'poverty' for it is misleading. For example, if everyone in a country's income doubled, it would not reduce the amount of 'relative poverty' at all.

History of the concept of relative poverty

In 1776, Adam Smith argued that poverty is the inability to afford "not only the commodities which are indispensably necessary for the support of life, but whatever the custom of the country renders it indecent for creditable people, even of the lowest order, to be without."

In 1958, John Kenneth Galbraith argued, "People are poverty stricken when their income, even if adequate for survival, falls markedly behind that of their community."

In 1964, in a joint committee economic President's report in the United States, Republicans endorsed the concept of relative poverty: "No objective definition of poverty exists. ... The definition varies from place to place and time to time. In America as our standard of living rises, so does our idea of what is substandard."

In 1965, Rose Friedman argued for the use of relative poverty claiming that the definition of poverty changes with general living standards. Those labelled as poor in 1995, would have had "a higher standard of living than many labelled not poor" in 1965.

In 1967, American economist Victor Fuchs proposed that "we define as poor any family whose income is less than one-half the median family income." This was the first introduction of the relative poverty rate as typically computed today. 

In 1979, British sociologist, Peter Townsend published his famous definition: "individuals... can be said to be in poverty when they lack the resources to obtain the types of diet, participate in the activities and have the living conditions and amenities which are customary, or are at least widely encouraged or approved, in the societies to which they belong (page 31)."

Brian Nolan and Christopher T. Whelan of the Economic and Social Research Institute (ESRI) in Ireland explained that "poverty has to be seen in terms of the standard of living of the society in question."

Relative poverty measures are used as official poverty rates by the European Union, UNICEF and the OECD. The main poverty line used in the OECD and the European Union is based on "economic distance", a level of income set at 60% of the median household income.

Relative poverty compared with other standards

A measure of relative poverty defines "poverty" as being below some relative poverty threshold. For example, the statement that "those individuals who are employed and whose household equivalised disposable income is below 60% of national median equivalised income are poor" uses a relative measure to define poverty.

The term relative poverty can also be used in a different sense to mean "moderate poverty" – for example, a standard of living or level of income that is high enough to satisfy basic needs (like water, food, clothing, housing, and basic health care), but still significantly lower than that of the majority of the population under consideration. An example of this could be a person living in poor conditions or squalid housing in a high crime area of a developed country and struggling to pay their bills every month due to low wages, debt or unemployment. While this person still benefits from the infrastructure of the developed country, they still endure a less than ideal lifestyle compared to their more affluent countrymen or even the more affluent individuals in less developed countries who have lower living costs.

Living Income Concept

Living Income refers to the income needed to afford a decent standard of living in the place one lives. The distinguishing feature between a living income and the poverty line is the concept of decency, wherein people thrive, not only survive. Based on years of stakeholder dialogue and expert consultations, the Living Income Community of Practice, an open learning community, established the formal definition of living income drawing on the work of Richard and Martha Anker, who co-authored "Living Wages Around the World: Manual for Measurement". They define a living income as:

The net annual income required for a household in a particular place to afford a decent standard of living for all members of that household. Elements of a decent standard of living include food, water, housing, education, healthcare, transport, clothing, and other essential needs including provision for unexpected events.

Like the poverty line calculation, using a single global monetary calculation for Living Income is problematic when applied worldwide. Additionally, the Living Income should be adjusted quarterly due to inflation and other significant changes such as currency adjustments. The actual income or proxy income can be used when measuring the gap between initial income and the living income benchmarks. The World Bank notes that poverty and standard of living can be measured by social perception as well, and found that in 2015, roughly one-third of the world's population was considered poor in relation to their particular society.

The Living Income Community of Practice (LICOP) was founded by The Sustainable Food Lab, GIZ and ISEAL Alliance to measure the gap between what people around the world earn versus what they need to have a decent standard of living, and find ways to bridge this gap.

A variation on the LICOP's Living Income is the Massachusetts Institute of Technology's Living Wage Calculator, which compares the local minimum wage to the amount of money needed to cover expenses beyond what is needed to merely survive across the United States. The cost of living varies greatly if there are children or other dependents in the household.

Why poverty threshold matters

An outdated or flawed poverty measure is an obstacle for policymakers, researchers and academics trying to find solutions to the problem of poverty. This has implications for people. The federal poverty line is used by dozens of federal, state, and local agencies, as well as several private organizations and charities, to decide who needs assistance. The assistance can take many forms, but it is often difficult to put in place any type of aid without measurements which provide data. In a rapidly evolving economic climate, poverty assessment often aids developed countries in determining the efficacy of their programs and guiding their development strategy. In addition, by measuring poverty one receives knowledge of which poverty reduction strategies work and which do not, helping to evaluate different projects, policies and institutions. To a large extent, measuring the poor and having strategies to do so keep the poor on the agenda, making the problem of political and moral concern.

Threshold limitations

It is hard to have exact number for poverty, as much data is collected through interviews, meaning income that is reported to the interviewer must be taken at face value. As a result, data could not rightly represent the situations true nature, nor fully represent the income earned illegally. In addition, if the data were correct and accurate, it would still not mean serving as an adequate measure of the living standards, the well-being or economic position of a given family or household. Research done by Haughton and Khandker finds that there is no ideal measure of well-being, arguing that all measures of poverty are imperfect. That is not to say that measuring poverty should be avoided; rather, all indicators of poverty should be approached with caution, and questions about how they are formulated should be raised.

As a result, depending on the indicator of economic status used, an estimate of who is disadvantaged, which groups have the highest poverty rates, and the nation's progress against poverty varies significantly. Hence, this can mean that defining poverty is not just a matter of measuring things accurately, but it also necessitates fundamental social judgments, many of which have moral implications.

National poverty lines

2008 CIA World Factbook-based map showing the percentage of population by country living below that country's official poverty line

National estimates are based on population-weighted subgroup estimates from household surveys. Definitions of the poverty line do vary considerably among nations. For example, rich nations generally employ more generous standards of poverty than poor nations. Even among rich nations, the standards differ greatly. Thus, the numbers are not comparable among countries. Even when nations do use the same method, some issues may remain.

United Kingdom

In the UK in 2006, "more than five million people – over a fifth (23 percent) of all employees – were paid less than £6.67 an hour". This value is based on a low pay rate of 60 percent of full-time median earnings, equivalent to a little over £12,000 a year for a 35-hour working week. In April 2006, a 35-hour week would have earned someone £9,191 a year – before tax or National Insurance".

In 2019, the Low Pay Commission estimated that about 7% of people employed in the UK were earning at or below the National Minimum Wage. In 2021, the Office for National Statistics found that 3.8% of jobs were paid below the National Minimum Wage, a decrease from 7.4% in 2020 but an increase from 1.4% in 2019. They note that this increase from 2019 to 2021 is connected to the COVID-19 pandemic in the United Kingdom. The Guardian reported in 2021 that "almost 5m jobs, or one in six nationally, pay below the real living wage".

India

India's official poverty level as of 2005 is split according to rural versus urban thresholds. For urban dwellers, the poverty line is defined as living on less than 538.60 rupees (approximately US$12) per month, whereas for rural dwellers, it is defined as living on less than 356.35 rupees per month (approximately US$7.50). In 2019, the Indian government stated that 6.7% of its population is below its official poverty limit. As India is one of the fastest-growing economies in 2018, poverty is on the decline in the country, with close to 44 Indians escaping extreme poverty every minute, as per the World Poverty Clock. India lifted 271 million people out of poverty in a 10-year time period from 2005/06 to 2015/16.

Singapore

Singapore has experienced strong economic growth over the last ten years and has consistently ranked among the world's top countries in terms of GDP per capita.

Inequality has however increased dramatically over the same time span, yet there is no official poverty line in the country. Given Singapore's high level of growth and prosperity, many believe that poverty does not exist in the country, or that domestic poverty is not comparable to global absolute poverty. Such a view persists for a selection of reasons, and since there is no official poverty line, there is no strong acknowledgement that it exists.

Yet, Singapore is not considering establishing an official poverty line, with Minister for Social and Family Development Chan Chun Sing claiming it would fail to represent the magnitude and scope of problems faced by the poor. As a result, social benefits and aids aimed at the poor would be a missed opportunity for those living right above such a line.

India
Poverty rate map of India by prevalence in 2012, among its states and union territories
 
A comparative map of poverty in the world in 2012, at national poverty line, according to the World Bank

United States

In the United States, the poverty thresholds are updated every year by Census Bureau. The threshold in the United States is updated and used for statistical purposes. In 2020, in the United States, the poverty threshold for a single person under 65 was an annual income of US$12,760, or about $35 per day. The threshold for a family group of four, including two children, was US$26,200, about $72 per day. According to the US Census Bureau's American Community Survey 2018 One-year Estimates, 13.1% of Americans lived below the poverty line.

Women and children

Street children in Cebu, Philippines

Women and children find themselves impacted by poverty more often when a part of single mother families. The poverty rate of women has increasingly exceeded that of men's. While the overall poverty rate is 12.3%, women poverty rate is 13.8% which is above the average and men are below the overall rate at 11.1%. Women and children (as single mother families) find themselves as a part of low class communities because they are 21.6% more likely to fall into poverty. However, extreme poverty, such as homelessness, disproportionately affects males to a high degree.

Racial minorities

A minority group is defined as "a category of people who experience relative disadvantage as compared to members of a dominant social group." Minorities are traditionally separated into the following groups: African Americans, American Indians, Alaska Natives, Asians, Pacific Islanders, and Hispanics. According to the current US Poverty statistics, Black Americans – 21%, Foreign born non-citizens – 19%, Hispanic Americans – 18%, and adults with a disability – 25%. This does not include all minority groups, but these groups alone account for 85% of people under the poverty line in the United States. Whites have a poverty rate of 8.7%; the poverty rate is more than double for Black and Hispanic Americans.

Impacts on education

Living below the poverty threshold can have a major impact on a child's education. The psychological stresses induced by poverty may affect a student's ability to perform well academically. In addition, the risk of poor health is more prevalent for those living in poverty. Health issues commonly affect the extent to which one can continue and fully take advantage of his or her education. Poor students in the United States are more likely to dropout of school at some point in their education. Research has also found that children living in poverty perform poorly academically and have lower graduation rates. Impoverished children also experience more disciplinary issues in school than others.

Schools in impoverished communities usually do not receive much funding, which can also set their students apart from those living in more affluent neighborhoods. There is much dispute over whether upward mobility that brings a child out of poverty may or may not have a significant positive impact on his or her education; inadequate academic habits that form as early as preschool typically are unknown to improve despite changes in socioeconomic status.

Impacts on healthcare

The nation's poverty threshold is issued by the Census Bureau. According to the Office of Assistant Secretary for Planning and Evaluation the threshold is statistically relevant and can be a solid predictor of people in poverty. The reasoning for using Federal Poverty Level (FPL) is due to its action for distributive purposes under the direction of Health and Human Services. So FPL is a tool derived from the threshold but can be used to show eligibility for certain federal programs. Federal poverty levels have direct effects on individuals' healthcare. In the past years and into the present government, the use of the poverty threshold has consequences for such programs like Medicaid and the Children's Health Insurance Program.  The benefits which different families are eligible for are contingent on FPL. The FPL, in turn, is calculated based on federal numbers from the previous year.

The benefits and qualifications for federal programs are dependent on number of people on a plan and the income of the total group. For 2019, the U.S Department of health & Human Services enumerate what the line is for different families. For a single person, the line is $12,490 and up to $43,430 for a family of 8, in the lower 48 states. Another issue is reduced-cost coverage. These reductions are based on income relative to FPL, and work in connection with public health services such as Medicaid. The divisions of FPL percentages are nominally, above 400%, below 138% and below 100% of the FPL. After the advent of the American Care Act, Medicaid was expanded on states bases. For example, enrolling in the ACA kept the benefits of Medicaid when the income was up to 138% of the FPL.

Department of Health & Human Services Seal

Poverty mobility and healthcare

Health Affairs along with analysis by Georgetown found that public assistance does counteract poverty threats between 2010 and 2015. In regards to Medicaid, child poverty is decreased by 5.3%, and Hispanic and Black poverty by 6.1% and 4.9% respectively. The reduction of family poverty also has the highest decrease with Medicaid over other public assistance programs. Expanding state Medicaid decreased the amount individuals paid by an average of $42, while it increased the costs to $326 for people not in expanded states. The same study analyzed showed 2.6 million people were kept out of poverty by the effects of Medicaid. From a 2013–2015 study, expansion states showed a smaller gap in health insurance between households making below $25,000 and above $75,000. Expansion also significantly reduced the gap of having a primary care physician between impoverished and higher income individuals. In terms of education level and employment, health insurance differences were also reduced. Non-expansion also showed poor residents went from a 22% chance of being uninsured to 66% from 2013 to 2015.

Poverty dynamics

Living above or below the poverty threshold is not necessarily a position in which an individual remains static. As many as one in three impoverished people were not poor at birth; rather, they descended into poverty over the course of their life. Additionally, a study which analyzed data from the Panel Study of Income Dynamics (PSID) found that nearly 40% of 20-year-olds received food stamps at some point before they turned 65. This indicates that many Americans will dip below the poverty line sometime during adulthood, but will not necessarily remain there for the rest of their life. Furthermore, 44% of individuals who are given transfer benefits (other than Social Security) in one year do not receive them the next. Over 90% of Americans who receive transfers from the government stop receiving them within 10 years, indicating that the population living below the poverty threshold is in flux and does not remain constant.

Cutoff issues

Most experts and the public agree that the official poverty line in the United States is substantially lower than the actual cost of basic needs. In particular, a 2017 Urban Institute study found that 61% of non-elderly adults earning between 100 and 200% of the poverty line reported at least one material hardship, not significantly different from those below the poverty line. The cause of the discrepancy is believed to be an outdated model of spending patterns based on actual spending in the year 1955; the number and proportion of material needs has risen substantially since then.

Variability

The US Census Bureau calculates the poverty line the same throughout the US regardless of the cost-of-living in a state or urban area. For instance, the cost-of-living in California, the most populous state, was 42% greater than the US average in 2010, while the cost-of-living in Texas, the second-most populous state, was 10% less than the US average. In 2017, California had the highest poverty rate in the country when housing costs are factored in, a measure calculated by the Census Bureau known as "the supplemental poverty measure".

Government transfers to alleviate poverty

In addition to wage and salary income, investment income and government transfers such as SNAP (Supplemental Nutrition Assistance Program, also known as food stamps) and housing subsidies are included in a household's income. Studies measuring the differences between income before and after taxes and government transfers, have found that without social support programs, poverty would be roughly 30% to 40% higher than the official poverty line indicates.

Inhalant

From Wikipedia, the free encyclopedia https://en.wikipedia.org/w...