Search This Blog

Monday, August 28, 2023

LED lamp

From Wikipedia, the free encyclopedia
 
LED light bulb
A 230-volt LED light bulb with an E27 base (10 watts, 806 lumens, 3000 Kelvins)
TypeLight-emitting diode, light bulb
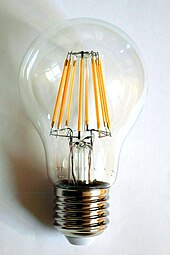
A 230-volt LED filament light bulb, with an E27 base. The filaments are visible as the eight yellow vertical lines.
An assortment of LED lamps commercially available in 2010: floodlight fixtures (left), reading light (center), household lamps (center right and bottom), and low-power accent light (right) applications
An 80W Chips on board (COB) LED module from an industrial light luminaire, thermally bonded to the heat sink

An LED lamp or LED light is an electric light that produces light using light-emitting diodes (LEDs). LED lamps are significantly more energy-efficient than equivalent incandescent lamps and can be significantly more than most fluorescent lamps. The most efficient commercially available LED lamps have efficiencies exceeding 200 lumens per watt (lm/W) and convert more than half the input power into light. Commercial LED lamps have a lifespan several times longer than both incandescent and fluorescent lamps.

LED lamps require an electronic LED circuit to operate from mains power lines, and losses from this circuit means that the efficiency of the lamp is lower than the efficiency of the LED chips it uses. The driver circuit may require special features to be compatible with lamp dimmers intended for use on incandescent lamps. Generally the current waveform contains some amount of distortion, depending on the luminaires’ technology.

The LED lamp market is projected to grow from US$75.8 billion in 2020 and increasing to US$160 billion in 2026.

LEDs come to full brightness immediately with no warm-up delay. Frequent switching on and off does not reduce life expectancy as with fluorescent lighting. Light output decreases gradually over the lifetime of the LED.

Some LED lamps are drop-in replacements for incandescent or fluorescent lamps. LED lamps may use multiple LED packages for improved light dispersal, heat dissipation, and overall cost. The text on retail LED lamp packaging may show the light output in lumens, the power consumption in watts, the color temperature in kelvins or a color description such as "warm white", "cool white" or "daylight", the operating temperature range, whether the lamp is dimmer compatible, whether the lamp is suitable for humid/damp/wet conditions, and sometimes the equivalent wattage of an incandescent lamp delivering the same output in lumens.

History
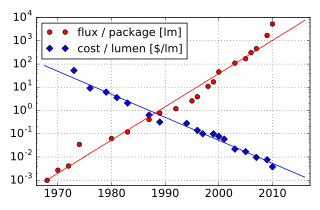
Illustration of Haitz's law, showing improvement in light output per LED over time, with a logarithmic scale on the vertical axis

Before the introduction of LED lamps, three types of lamps were used for the bulk of general (white) lighting:

  • Incandescent lights produce light with a glowing filament heated by electric current. These are very inefficient, having a luminous efficacy of 10–17 lm/W, and also have a short lifetime, typically 1000 hours. They are being phased out of general lighting applications. Incandescent lamps produce a continuous black body spectrum of light similar to sunlight, and so produce high Color rendering index (CRI).
  • Fluorescent lamps produce ultraviolet light by a glow discharge between two electrodes in a low pressure tube of mercury vapor, which is converted to visible light by a fluorescent coating (phosphor) on the inside of the tube. These are more efficient than incandescent lights, having a luminous efficacy from 50 to 100 lm/W (depending on the structure, type of phosphor and type of ballast used), have a longer lifetime of 6,000–15,000 hours, and are widely used for residential and office lighting. However, their mercury content makes them a hazard to the environment, and they have to be disposed of as hazardous waste.
  • Metal-halide lamps, which produce light by an arc between two electrodes in an atmosphere of argon, mercury and other metals, and iodine or bromine. These were among the most efficient white electric lights before LEDs, having a luminous efficacy of 75–100 lm/W and a relatively long bulb lifetime of 6,000–15,000 hours; because they require a 5–7-minute warmup period before they reach full output, metal-halides are not used for residential lighting, but for commercial and industrial wide area lighting and, outdoors, for security lights and streetlights. Like fluorescents, they also contain hazardous mercury.

Considered as energy converters, all these existing lamps are inefficient, emitting more of their input energy as waste heat than as visible light. Global electric lighting in 1997 consumed 2016 terawatthours of energy. Lighting consumes roughly 12 % of electrical energy produced by industrialized countries.

The increasing scarcity of energy resources, and the environmental costs of producing electricity, particularly the discovery of global warming due to carbon dioxide emitted by the burning of fossil fuels, which are the largest source of energy for electric power generation, created an increased incentive to develop more energy-efficient electric lights.

The first low-powered LEDs were developed in the early 1960s, and only produced light in the low, red frequencies of the spectrum. In 1968, the first commercial LED lamps were introduced: Hewlett-Packard's LED display, which was developed under Howard C. Borden and Gerald P. Pighini, and Monsanto Company's LED indicator lamp. However, early LED lamps were inefficient and could only display deep red colors, making them unsuitable for general lighting and restricting their usage to numeric displays and indicator lights.

The first high-brightness blue LED was demonstrated by Shuji Nakamura of Nichia Corporation in 1994. The existence of blue LEDs and high-efficiency LEDs led to the development of the first 'white LED', which employed a phosphor coating to partially convert the emitted blue light to red and green frequencies, creating a light that appears white. Isamu Akasaki, Hiroshi Amano and Nakamura were later awarded the 2014 Nobel Prize in Physics for the invention of the blue LED.

China further boosted LED research and development in 1995 and demonstrated its first LED Christmas tree in 1998. The new LED technology application then became prevalent at the start of the 21st century by US (Cree) and Japan (Nichia, Panasonic, and Toshiba) and then starting 2004 by Korea and China (Samsung, Kingsun, Solstice, Hoyol, and others.)

In the US, the Energy Independence and Security Act (EISA) of 2007 authorized the Department of Energy (DOE) to establish the Bright Tomorrow Lighting Prize competition, known as the "L Prize", the first government-sponsored technology competition designed to challenge industry to develop replacements for 60 W incandescent lamps and PAR 38 halogen lamps. The EISA legislation established basic requirements and prize amounts for each of the two competition categories, and authorized up to $20 million in cash prizes.

The competition also allowed winners to obtain federal purchasing agreements, utility programs, and other incentives. In May 2008, they announced details of the competition and technical requirements for each category. Lighting products meeting the competition requirements could use just 17 % of the energy used by most incandescent lamps in use today. That same year the DOE also launched the Energy Star program for solid-state lighting products. The EISA legislation also authorized an additional L Prize program for developing a new "21st Century Lamp".

Philips Lighting ceased research on compact fluorescents in 2008 and began devoting the bulk of its research and development budget to solid-state lighting. On 24 September 2009, Philips Lighting North America became the first to submit lamps in the category to replace the standard 60 W A-19 "Edison screw fixture" light bulb, with a design based on their earlier "AmbientLED" consumer product. On 3 August 2011, DOE awarded the prize in the 60 W replacement category to a Philips LED lamp after 18 months of extensive testing.

Early LED lamps varied greatly in chromaticity from the incandescent lamps they were replacing. A standard was developed, ANSI C78.377-2008, that specified the recommended color ranges for solid-state lighting products using cool to warm white LEDs with various correlated color temperatures. In June 2008, NIST announced the first two standards for solid-state lighting in the United States. These standards detail performance specifications for LED light sources and prescribe test methods for solid-state lighting products.

Also in 2008 in the United States and Canada, the Energy Star program began to label lamps that meet a set of standards for starting time, life expectancy, color, and consistency of performance. The intent of the program is to reduce consumer concerns due to variable quality of products, by providing transparency and standards for the labeling and usability of products available in the market. Energy Star Certified Light Bulbs is a resource for finding and comparing Energy Star qualified lamps.

A similar program in the United Kingdom (run by the Energy Saving Trust) was launched to identify lighting products that meet energy conservation and performance guidelines. Ushio released the first LED filament lamp in 2008. Philips released its first LED lamp in 2009, followed by the world's first 60 W equivalent LED lamp in 2010, and a 75 watt equivalent version in 2011.

The Illuminating Engineering Society of North America (IESNA) in 2008 published a documentary standard LM-79, which describes the methods for testing solid-state lighting products for their light output (lumens), efficacy (lumens per watt) and chromaticity.

As of 2016, in the opinion of Noah Horowitz of the Natural Resources Defense Council, new standards proposed by the United States Department of Energy would likely mean most light bulbs used in the future would be LED.

By 2019 electricity usage in the United States had decreased for at least five straight years, due in part to U.S. electricity consumers replacing incandescent light bulbs with LEDs due to their energy efficiency and high performance.

Examples of early adoption

LEDs as Christmas illumination in Viborg, Denmark

In 2008 Sentry Equipment Corporation in Oconomowoc, Wisconsin, US, was able to light its new factory interior and exterior almost solely with LEDs. Initial cost was three times that of a traditional mix of incandescent and fluorescent lamps, but the extra cost was recovered within two years via electricity savings, and the lamps should not need replacing for 20 years. In 2009 the Manapakkam, Chennai office of the Indian IT company, iGate, spent 3,700,000 (US$80,000) to light 57,000 sq ft (5,300 m2) of office space with LEDs. The firm expected the new lighting to pay for itself within 5 years.

In 2009 the exceptionally large Christmas tree standing in front of the Turku Cathedral in Finland was hung with 710 LED lamps, each using 2 watts. It has been calculated that these LED lamps paid for themselves in three and a half years, even though the lights run for only 48 days per year.

In 2009 a new highway (A29) was inaugurated in Aveiro, Portugal; it included the first European public LED-based lighting highway.

By 2010 mass installations of LED lighting for commercial and public uses were becoming common. LED lamps were used for a number of demonstration projects for outdoor lighting and LED street lights. The United States Department of Energy made several reports available on the results of many pilot projects for municipal outdoor lighting, and many additional streetlight and municipal outdoor lighting projects soon followed.

In 2016 Government of India launched 'Ujala LED bulb scheme' to lower India's carbon footprint and save electricity, it distributed 37 crore LED bulbs free, by doing so as of March 2022, which resulted in saving of 20,000 Cr of middle class and poor household power bill. The scheme is intended to replace all the incandescent and CFL light bulbs to more efficient LED lights in the nation. To lower the price of LED bulbs government encouraged light bulb production in the nation.

Technology

LED lamps are often made with arrays of surface mount LED modules.

A significant difference from other light sources is that the light is more directional. An LED is a "Lambertian" emitter, producing a cone of light with half-power points about 60° from the axis. A laser diode is another form of LED emitter, but produces light by a different mechanism.

White light LEDs

LED lamp used in photography

General-purpose lighting requires a white light, emulating a black body at a specified temperature, from "warm white" (like an incandescent bulb) at 2700K, to "daylight" at around 6500K. The first LEDs emitted light in a very narrow band of wavelengths, of a color characteristic of the energy band gap of the semiconductor material used to make the LED. LEDs that emit white light are made using two principal methods: either mixing light from multiple LEDs of various colors, or using a phosphor to convert some of the light to other colors. The light is not the same as a true black body, giving a different appearance to colors than an incandescent bulb. Color rendering quality is specified by the color rendering index (CRI), and as of 2019 is about 80 for many LED bulbs, and over 95 for more expensive high-CRI LED lighting (100 is the ideal value).

RGB or trichromatic white LEDs use multiple LED chips emitting red, green, and blue wavelengths. These three colors combine to produce white light. The CRI is poor, typically 25 – 65, due to the narrow range of wavelengths emitted. Higher CRI values can be obtained using more than three LED colors to cover a greater range of wavelengths.

The second method, the basis of most commercially available LED lamps, uses LEDs in conjunction with a phosphor to produce complementary colors from a single LED. Some of the light from the LED is absorbed by the molecules of the phosphor, causing them to fluoresce, emitting light of another color via the Stokes shift. The most common method is to combine a blue LED emitter with a yellow phosphor, producing a narrow range of blue wavelengths and a broad band of "yellow" wavelengths actually covering the spectrum from green to red. The CRI value can range from less than 70 to over 90, although a wide range of commercial LEDs of this type have a color rendering index around 82. Following successive increases in efficacy, which had reached 210 lm/W on a production basis as of 2021, this type has surpassed the performance of trichromatic LEDs. The phosphors used in white light LEDs can give correlated color temperatures in the range of 2,200 K (dimmed incandescent) up to 7,000 K or more.

Color changing LED lighting

Tunable lighting systems employ banks of colored LEDs that can be individually controlled, either using separate banks of each color, or multi-chip LEDs with the colors combined and controlled at the chip level. For example, white LEDs of different color temperatures can be combined to construct an LED bulb that decreases its color temperature when dimmed.

LED drivers
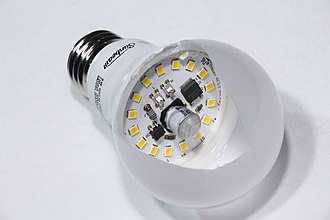
Household LED lamp with its internal LED elements and LED driver circuitry exposed.

LED chips require controlled direct current (DC) electrical power and an appropriate circuit as an LED driver is required to convert the alternating current from the power supply to the regulated voltage direct current used by the LEDs.

LED drivers are essential components of LED lamps to ensure acceptable lifetime and performance of the lamp. A driver can provide features such as dimming and remote control. LED drivers may be in the same lamp enclosure as the diode array, or remotely mounted from the light-emitting diodes. LED drivers may require additional components to meet regulations for acceptable AC line harmonic current.

Thermal management

LED lamps run cooler than their predecessors since there is no electric arc or tungsten filament, but they can still cause burns. Thermal management of high-power LEDs is required to keep the junction temperature of the LED device close to ambient temperature, since increased temperature reduces light output and can cause catastrophic failure. LEDs use much less power for a given light output, but they do produce some heat, and it is concentrated in a very small semiconductor die. Because of their low operating temperature, LED lamps cannot lose much heat via radiation; instead, heat is conducted through the back of the die to a suitably designed heat sink or cooling fin, from where it is dissipated via convection. Very high power lamps for industrial uses are frequently equipped with cooling fans. Some manufacturers place the LEDs and all circuitry in a glass bulb just like conventional incandescent bulbs, but with a helium gas filling to conduct heat and thus cool the LEDs. Others place the LEDs on a circuit board with an aluminum backing; the aluminum back is connected thermally to the aluminum base of the lamp using thermal paste, and the base is embedded in a melamine plastic shell. Because of the need for convection cooling around an LED lamp, careful consideration is necessary when placing the lamp in an enclosed or poorly vented luminaire or close to thermal insulation.

Efficiency droop
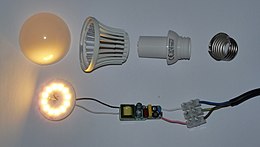
Disassembled LED-light bulb with switched-mode power supply circuit board and Edison screw

The term "efficiency droop" refers to the decrease in luminous efficacy of LEDs as the electric current increases above tens of milliamps (mA). Instead of increasing current levels, light output is usually increased by connecting multiple LED emitters in parallel and/or series in one lamp. Solving the problem of efficiency droop would mean that household LED lamps would require fewer LEDs, which would significantly reduce costs.

Early suspicions were that the LED droop was caused by elevated temperatures. Scientists showed that temperature was not the root cause of efficiency droop. The mechanism causing efficiency droop was identified in 2007 as Auger recombination, which was taken with mixed reaction. A 2013 study conclusively identified Auger recombination as the cause.

Applications

LED lamps are used for both general and special-purpose lighting. Where colored light is needed, LEDs that inherently emit light of a single color require no energy-absorbing filters. LED lamps are commonly available as drop-in replacements for either bulbs or fixtures, replacing either an entire fixture (such as LED light panels replacing fluorescent troffers or LED spotlight fixtures replacing similar halogen fixtures) or bulbs (such as LED tubes replacing fluorescent tubes inside troffers or LED HID replacement lamps replacing HID bulbs inside HID fixtures) The differences between replacing a fixture and replacing a bulb are that, when a fixture (like a troffer) is replaced with something like an LED panel, the panel must be replaced in its entirety if the LEDs or the driver it contains fail since it is impossible to replace them individually in a practical fashion (although the driver is often separate and so it may be replaced), where as, if only the bulb is replaced with an LED replacement lamp, the lamp can be replaced independently of the fixture should the lamp fail. Some LED replacement lamps require the fixture to be modified such as by electrically removing the fixture's ballast, thus connecting the LED lamp directly to the mains supply; others can work without any modifications to the fixture.
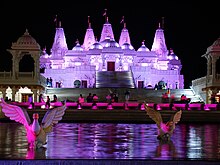
BAPS Shri Swaminarayan Mandir Atlanta Illumination with color mixing LED fixtures
Computer-led LED lighting allows enhancement of unique qualities of paintings in the National Museum in Warsaw.

White-light LED lamps have longer life expectancy and higher efficiency (more light for the same electricity) than most other lighting when used at the proper temperature. LED sources are compact, which gives flexibility in designing lighting fixtures and good control over the distribution of light with small reflectors or lenses. Because of the small size of LEDs, control of the spatial distribution of illumination is extremely flexible, and the light output and spatial distribution of an LED array can be controlled with no efficiency loss.

LEDs using the color-mixing principle can emit a wide range of colors by changing the proportions of light generated in each primary color. This allows full color mixing in lamps with LEDs of different colors. Unlike other lighting technologies, LED emission tends to be directional (or at least Lambertian), which can be either advantageous or disadvantageous, depending on requirements. For applications where non-directional light is required, either a diffuser is used, or multiple individual LED emitters are used to emit in different directions.

Household LED lamps

Sizes and bases

A selection of consumer LED bulbs available in 2012 as drop-in replacements for incandescent bulbs in screw-type sockets

LED lamps are made with standard lamp connections and shapes, such as an Edison screw base, an MR16 shape with a bi-pin base, or a GU5.3 (bi-pin cap) or GU10 (bayonet fitting) and are made compatible with the voltage supplied to the sockets. They include driver circuitry to rectify the AC power and convert the voltage to an appropriate value, usually a switched-mode power supply.

As of 2010 some LED lamps replaced higher wattage bulbs; for example, one manufacturer claimed a 16-watt LED lamp was as bright as a 150 W halogen lamp. A standard general-purpose incandescent bulb emits light at an efficacy of about 14 to 17 lm/W depending on its size and voltage. (Efficacy of incandescent lamps designed for 230 V supplies is less, because the lower supply voltage in north America is more favorable to efficacy.) According to the European Union standard, an energy-efficient lamp that claims to be the equivalent of a 60 W tungsten lamp must have a minimum light output of 806 lumens.

High-power LED "corn cob" light bulb

Some models of LED lamps are compatible with dimmers. LED lamps often have directional light characteristics. The best of these lamps, as of 2022, are more power-efficient than compact fluorescent lamps and offer lifespans of 30,000 or more hours, reduced if operated at a higher temperature than specified. Incandescent lamps have a typical life of 1,000 hours, and compact fluorescents about 8,000 hours. LED and fluorescent lamps both use phosphors, whose light output declines over their lifetimes. Energy Star specifications requires LED lamps to typically drop less than 10% after 6,000 or more hours of operation, and in the worst case not more than 15%. LED lamps are available with a variety of color properties. The purchase price is higher than most other lamps – although dropping – but the higher efficiency usually makes total cost of ownership (purchase price plus cost of electricity and changing bulbs) lower.

Several companies offer LED lamps for general lighting purposes. The technology is improving rapidly and new energy-efficient consumer LED lamps are available. As of 2016, in the United States, LED lamps are close to being adopted as the mainstream light source because of the falling prices and because incandescent lamps are being phased out. In the U.S. the Energy Independence and Security Act of 2007 effectively bans the manufacturing and importing of most current incandescent lamps. LED lamps have decreased substantially in price, and many varieties are sold with subsidized prices from local utilities. However, in September 2019 the Trump administration rolled back requirements for new, energy-efficient light bulbs.

LED tube lamps

A 17 W tube of LEDs which has the same intensity as a 45 W fluorescent tube

LED tube lights are designed to physically fit in fixtures intended for fluorescent tubes. Some LED tubular lamps are intended to be a drop-in replacement into existing fixtures if appropriate ballast is used. Others require rewiring of the fixtures to remove the ballast. An LED tube lamp generally uses many individual Surface-Mounted LEDs which are directional and require proper orientation during installation as opposed to Fluorescent tube lamps which emit light in all directions around the tube. Most LED tube lights available can be used in place of T5, T8, T10, or T12 tube designations, T8 is D26mm, T10 is D30mm, in lengths of 590 mm (23 in), 1,200 mm (47 in) and 1,500 mm (59 in).

Lighting designed for LEDs

LED-wall lamp

Newer light fittings with long-lived LEDs built-in, or designed for LED lamps, have been coming into use as the need for compatibility with existing fittings diminishes. Such lighting does not require each bulb to contain circuitry to operate from mains voltage.

Plants

Experiments revealed surprising performance and production of vegetables and ornamental plants under LED light sources. Many plant species have been assessed in greenhouse trials to make sure that the quality of biomass and biochemical ingredients of such plants is at least comparable with those grown in field conditions. Plant performance of mint, basil, lentil, lettuce, cabbage, parsley and carrot was measured by assessing both the health and vigor of the plants and the success of the LEDs in promoting growth. Also noticed was profuse flowering of select ornamentals including primula, marigold and stock.

Light emitting diodes (LEDs) offer efficient electric lighting in desired wavelengths (red + blue) which support greenhouse production in minimum time and with high quality and quantity. As LEDs are cool, plants can be placed very close to light sources without overheating or scorching, requiring much less space for intense cultivation than with hot-running lighting.

Specialty

LED Flashlight replacement bulb (left), with tungsten equivalent (right)

White LED lamps have achieved market dominance in applications where high efficiency is important at low power levels. Some of these applications include flashlights, solar-powered garden or walkway lights, and bicycle lights. Colored LED lamps are now commercially used for traffic signal lamps, where the ability to emit bright light of the required color is essential, and in strings of holiday lights. LED automotive lamps are widely used for their long life and small size. Multiple LEDs are used in applications where more light output than available from a single LED is required.

Outdoor lighting

LED floodlights

By about 2010 LED technology came to dominate the outdoor lighting industry; earlier LEDs were not bright enough for outdoor lighting. A study completed in 2014 concluded that color temperature and accuracy of LED lights was easily recognised by consumers, with preference towards LEDs at natural color temperatures. LEDs are now able to match the brightness and warmer color temperature that consumers desire from their outdoor lighting system.

LEDs are increasingly used for street lighting in place of mercury and sodium lamps due to their lower running and lamp replacement costs. However, there have been concerns that the use of LED street lighting with predominantly blue light can cause eye damage, and that some LEDs switch on and off at twice mains frequency, causing malaise in some people, and possibly being misleading with rotating machinery due to stroboscopic effects. These concerns can be addressed by use of appropriate lighting, rather than simple concern with cost.

Comparison with other lighting technologies

See luminous efficacy for an efficiency chart comparing various technologies.

Comparison table

Cost comparison for 60 watt incandescent equivalent light bulb (U.S. residential electricity prices)

LED CFL Halogen Incan­descent
Philips ultra
efficient (2023)
EcoSmart
clear (2018)
V-TAC
(2018)
Philips
(2017)
Cree
(2019)
Purchase price $7.19 $3.29 $1.79 $2.54 $3.93 $1.54 $1.17 $0.41
Watts 4 6.5 9 8.5 9.5 14 43 60
lumens (mean) 840 800 806 800 815 775 750 860
lumens/watt 210 123.1 89.6 94.1 85.8 55.4 17.4 14.3
Color temperature kelvin 3000 2700 2700 2700 2700 2700 2920 2700
CRI 80 80 80+ 80 85 82 100 100
Lifespan (hours) 50,000 15,000 20,000 10,000 25,000 10,000 1,000 1,000
Bulb lifetime (years) @ 6 hours/day 22.8 6.8 9.1 4.6 11.4 4.6 0.46 0.46
Energy cost over 20 years @ 16.1 cents/kWh $28 $46 $63 $60 $67 $99 $303 $423
Cost of bulbs over 20 years $7 $10 $5 $13 $8 $8 $51 $18
Total cost over 20 years $35 $56 $69 $73 $75 $106 $355 $441
Total cost per 860 lumens $36 $60 $73 $78 $79 $118 $407 $441
Comparison based on 6 hours use per day (43,800 hours over 20 yrs)

In keeping with the long life claimed for LED lamps, long warranties are offered. However, currently there are no standardized testing procedures set by the Department of Energy in the United States to prove these assertions by each manufacturer. A typical domestic LED lamp is stated to have an "average life" of 15,000 hours (15 years at 3 hours/day), and to support 50,000 switch cycles.

Incandescent and halogen lamps naturally have a power factor of 1, but Compact fluorescent and LED lamps use input rectifiers and this causes lower power factors. Low power factors can result in surcharges for commercial energy users; CFL and LED lamps are available with driver circuits to provide any desired power factor, or site-wide power factor correction can be performed. EU standards requires a power factor better than 0.4 for lamp powers between 2 and 5 watts, better than 0.5 for lamp powers between 5 and 25 watts and above 0.9 for higher power lamps.

Energy Star qualification

Energy Star is an international standard for energy efficient consumer products. Devices carrying the Energy Star service mark generally use 20–30% less energy than required by US standards.

Energy Star LED qualifications:

  • Reduces energy costs – uses at least 75% less energy than incandescent lighting, saving on operating expenses.
  • Reduces maintenance costs – lasts 35 to 50 times longer than incandescent lighting and about 2 to 5 times longer than fluorescent lighting. No lamp-replacements, no ladders, no ongoing disposal program.
  • Reduces cooling costs – LEDs produce very little heat.
  • Is guaranteed – comes with a minimum three-year warranty – far beyond the industry standard.
  • Offers convenient features – available with dimming on some indoor models and automatic daylight shut-off and motion sensors on some outdoor models.
  • Is durable – will not break like a glass bulb.

To qualify for Energy Star certification, LED lighting products must pass a variety of tests to prove that the products will display the following characteristics:

  • Brightness is equal to or greater than existing lighting technologies (incandescent or fluorescent) and light is well distributed over the area lit by the fixture.
  • Light output remains constant over time, only decreasing towards the end of the rated lifetime (at least 35,000 hours or 12 annums based on use of 8 hours per day).
  • Excellent color quality. The shade of white light appears clear and consistent over time.
  • Efficiency is as good as or better than fluorescent lighting.
  • Light comes on instantly when turned on.
  • No flicker when dimmed.
  • No off-state power draw. The fixture does not use power when it is turned off, with the exception of external controls, whose power should not exceed 0.5 watts in the off state.
  • Power factor of at least 0.7 for all lamps of 5W or greater.

Limitations

LED emitters are inherently suitable for dimming, because they can operate over a wide range of currents without significant change of color. However, the circuits in LED lamps must be explicitly designed to be dimmable and compatible with particular types of dimmer switch. Otherwise damage to the lamp and/or the dimmer may result.

Variable color temperature LED array in a floodlight

Color rendering is not identical to that of incandescent lamps, which emit close to perfect black-body radiation, as does the sun. A measurement unit called CRI is used to record how a light source renders eight color sample chips, on a scale from 0 to 100. LEDs with CRI below 75 are not recommended for use in indoor lighting.

Badly designed LED lamps may flicker. The effect can be seen on a slow motion video of such a lamp. The extent of flicker is based on the quality of the DC power supply built into the lamp structure, usually located in the lamp base. Longer exposures to flickering light contribute to headaches and eye strain.

LED life span as a function of lumen maintenance drops at higher temperatures. Thermal management of high-power LEDs is a significant factor in design of solid state lighting equipment. LED lamps are sensitive to excessive heat, like most solid state electronic components. Also, the presence of incompatible volatile organic compounds can impair the performance and reduce lifetime.

The long life of LEDs, expected to be about 50 times that of the most common incandescent lamps and significantly longer than fluorescent types, is advantageous for users but will affect manufacturers as it reduces the market for replacements in the distant future.

The human circadian rhythm can be affected by light sources. The effective color temperature of daylight is ~5,700K (bluish white) while tungsten lamps are ~2,700K (yellow). People who have circadian rhythm sleep disorders are sometimes treated with light therapy (exposure to intense bluish white light during the day) and dark therapy (wearing amber-tinted goggles at night to reduce bluish light).

Some organizations recommend that people should not use bluish-white lamps at night. The American Medical Association argues against using bluish-white LEDs for municipal street lighting.

Research suggests that the shift to LED street lighting attracts 48% more flying insects than HPS lamps, which could cause direct ecological impacts as well as indirect impacts such as attracting more gypsy moths to port areas.

Phylogeography

From Wikipedia, the free encyclopedia

Phylogeography is the study of the historical processes that may be responsible for the past to present geographic distributions of genealogical lineages. This is accomplished by considering the geographic distribution of individuals in light of genetics, particularly population genetics.

This term was introduced to describe geographically structured genetic signals within and among species. An explicit focus on a species' biogeography/biogeographical past sets phylogeography apart from classical population genetics and phylogenetics.

Past events that can be inferred include population expansion, population bottlenecks, vicariance, dispersal, and migration. Recently developed approaches integrating coalescent theory or the genealogical history of alleles and distributional information can more accurately address the relative roles of these different historical forces in shaping current patterns.

Development

The term phylogeography was first used by John Avise in his 1987 work Intraspecific Phylogeography: The Mitochondrial DNA Bridge Between Population Genetics and Systematics. Historical biogeography is a synthetic discipline that addresses how historical, geological, climatic and ecological conditions influenced the past and current distribution of species. As part of historical biogeography, researchers had been evaluating the geographical and evolutionary relationships of organisms years before. Two developments during the 1960s and 1970s were particularly important in laying the groundwork for modern phylogeography; the first was the spread of cladistic thought, and the second was the development of plate tectonics theory.

The resulting school of thought was vicariance biogeography, which explained the origin of new lineages through geological events like the drifting apart of continents or the formation of rivers. When a continuous population (or species) is divided by a new river or a new mountain range (i.e., a vicariance event), two populations (or species) are created. Paleogeography, geology and paleoecology are all important fields that supply information that is integrated into phylogeographic analyses.

Phylogeography takes a population genetics and phylogenetic perspective on biogeography. In the mid-1970s, population genetic analyses turned to mitochondrial markers. The advent of the polymerase chain reaction (PCR), the process where millions of copies of a DNA segment can be replicated, was crucial in the development of phylogeography.

Thanks to this breakthrough, the information contained in mitochondrial DNA sequences was much more accessible. Advances in both laboratory methods (e.g. capillary DNA sequencing technology) that allowed easier sequencing of DNA and computational methods that make better use of the data (e.g. employing coalescent theory) have helped improve phylogeographic inference. By 2000, Avise generated a seminal review of the topic in book form, in which he defined phylogeography as the study of the "principles and processes governing the geographic distributions of genealogical lineages... within and among closely related species."

Early phylogeographic work has recently been criticized for its narrative nature and lack of statistical rigor (i.e. it did not statistically test alternative hypotheses). The only real method was Alan Templeton's Nested Clade Analysis, which made use of an inference key to determine the validity of a given process in explaining the concordance between geographic distance and genetic relatedness. Recent approaches have taken a stronger statistical approach to phylogeography than was done initially.

Example

Climate change, such as the glaciation cycles of the past 2.4 million years, has periodically restricted some species into disjunct refugia. These restricted ranges may result in population bottlenecks that reduce genetic variation. Once a reversal in climate change allows for rapid migration out of refugial areas, these species spread rapidly into newly available habitat. A number of empirical studies find genetic signatures of both animal and plant species that support this scenario of refugia and postglacial expansion. This has occurred both in the tropics (where the main effect of glaciation is increasing aridity, i.e. the expansion of savanna and retraction of tropical rainforest) as well as temperate regions that were directly influenced by glaciers.

Phylogeography and conservation

Phylogeography can help in the prioritization of areas of high value for conservation. Phylogeographic analyses have also played an important role in defining evolutionary significant units (ESU), a unit of conservation below the species level that is often defined on unique geographic distribution and mitochondrial genetic patterns.

A recent study on imperiled cave crayfish in the Appalachian Mountains of eastern North America demonstrates how phylogenetic analyses along with geographic distribution can aid in recognizing conservation priorities. Using phylogeographical approaches, the authors found that hidden within what was thought to be a single, widely distributed species, an ancient and previously undetected species was also present. Conservation decisions can now be made to ensure that both lineages received protection. Results like this are not an uncommon outcome from phylogeographic studies.

An analysis of salamanders of the genus Eurycea, also in the Appalachians, found that the current taxonomy of the group greatly underestimated species level diversity. The authors of this study also found that patterns of phylogeographic diversity were more associated with historical (rather than modern) drainage connections, indicating that major shifts in the drainage patterns of the region played an important role in the generation of diversity of these salamanders. A thorough understanding of phylogeographic structure will thus allow informed choices in prioritizing areas for conservation.

Comparative phylogeography

These figures map out the phylogeographic history of poison frogs in South America.

The field of comparative phylogeography seeks to explain the mechanisms responsible for the phylogenetic relationships and distribution of different species. For example, comparisons across multiple taxa can clarify the histories of biogeographical regions. For example, phylogeographic analyses of terrestrial vertebrates on the Baja California peninsula and marine fish on both the Pacific and gulf sides of the peninsula display genetic signatures that suggest a vicariance event affected multiple taxa during the Pleistocene or Pliocene.

Phylogeography also gives an important historical perspective on community composition. History is relevant to regional and local diversity in two ways. One, the size and makeup of the regional species pool results from the balance of speciation and extinction. Two, at a local level community composition is influenced by the interaction between local extinction of species’ populations and recolonization. A comparative phylogenetic approach in the Australian Wet Tropics indicates that regional patterns of species distribution and diversity are largely determined by local extinctions and subsequent recolonizations corresponding to climatic cycles.

Phylogeography integrates biogeography and genetics to study in greater detail the lineal history of a species in context of the geoclimatic history of the planet. An example study of poison frogs living in the South American neotropics (illustrated to the left) is used to demonstrate how phylogeographers combine genetics and paleogeography to piece together the ecological history of organisms in their environments. Several major geoclimatic events have greatly influenced the biogeographic distribution of organisms in this area, including the isolation and reconnection of South America, the uplift of the Andes, an extensive Amazonian floodbasin system during the Miocene, the formation of Orinoco and Amazon drainages, and dry−wet climate cycles throughout the Pliocene to Pleistocene epochs.

Using this contextual paleogeographic information (paleogeographic time series is shown in panels A-D) the authors of this study proposed a null-hypothesis that assumes no spatial structure and two alternative hypothesis involving dispersal and other biogeographic constraints (hypothesis are shown in panels E-G, listed as SMO, SM1, and SM2). The phylogeographers visited the ranges of each frog species to obtain tissue samples for genetic analysis; researchers can also obtain tissue samples from museum collections.

The evolutionary history and relations among different poison frog species is reconstructed using phylogenetic trees derived from molecular data. The molecular trees are mapped in relation to paleogeographic history of the region for a complete phylogeographic study. The tree shown in the center of the figure has its branch lengths calibrated to a molecular clock, with the geological time bar shown at the bottom. The same phylogenetic tree is duplicated four more times to show where each lineage is distributed and is found (illustrated in the inset maps below, including Amazon basin, Andes, Guiana-Venezuela, Central America-Chocó).

The combination of techniques used in this study exemplifies more generally how phylogeographic studies proceed and test for patterns of common influence. Paleogeographic data establishes geological time records for historical events that explain the branching patterns in the molecular trees. This study rejected the null model and found that the origin for all extant Amazonian poison frog species primarily stem from fourteen lineages that dispersed into their respective areas after the Miocene floodbasin receded. Regionally based phylogeographic studies of this type are repeated for different species as a means of independent testing. Phylogeographers find broadly concordant and repeated patterns among species in most regions of the planet that is due to a common influence of paleoclimatic history.

Human phylogeography

Phylogeography has also proven to be useful in understanding the origin and dispersal patterns of our own species, Homo sapiens. Based primarily on observations of skeletal remains of ancient human remains and estimations of their age, anthropologists proposed two competing hypotheses about human origins.

The first hypothesis is referred to as the Out-of-Africa with replacement model, which contends that the last expansion out of Africa around 100,000 years ago resulted in the modern humans displacing all previous Homo spp. populations in Eurasia that were the result of an earlier wave of emigration out of Africa. The multiregional scenario claims that individuals from the recent expansion out of Africa intermingled genetically with those human populations of more ancient African emigrations. A phylogeographic study that uncovered a Mitochondrial Eve that lived in Africa 150,000 years ago provided early support for the Out-of-Africa model.

While this study had its shortcomings, it received significant attention both within scientific circles and a wider audience. A more thorough phylogeographic analysis that used ten different genes instead of a single mitochondrial marker indicates that at least two major expansions out of Africa after the initial range extension of Homo erectus played an important role shaping the modern human gene pool and that recurrent genetic exchange is pervasive. These findings strongly demonstrated Africa's central role in the evolution of modern humans, but also indicated that the multiregional model had some validity. These studies have largely been supplanted by population genomic studies that use orders of magnitude more data.

In light of these recent data from the 1000 genomes project, genomic-scale SNP databases sampling thousands of individuals globally and samples taken from two non-Homo sapiens hominins (Neanderthals and Denisovans), the picture of human evolutionary has become more resolved and complex involving possible Neanderthal and Denisovan admixture, admixture with archaic African hominins, and Eurasian expansion into the Australasian region that predates the standard out of African expansion.

Phylogeography of viruses

Viruses are informative in understanding the dynamics of evolutionary change due to their rapid mutation rate and fast generation time. Phylogeography is a useful tool in understanding the origins and distributions of different viral strains. A phylogeographic approach has been taken for many diseases that threaten human health, including dengue fever, rabies, influenza and HIV. Similarly, a phylogeographic approach will likely play a key role in understanding the vectors and spread of avian influenza (HPAI H5N1), demonstrating the relevance of phylogeography to the general public.

Phylogeography of languages

Phylogeographic analysis of ancient and modern languages has been used to test whether Indo-European languages originated in Anatolia or in the steppes of Central Asia. Language evolution was modeled in terms of the gain and loss of cognate words in each language over time, to produce a cladogram of related languages. Combining those data with known geographic ranges of each language produced strong support for an Anatolian origin approximately 8000–9500 years ago.

Water scarcity in Africa

From Wikipedia, the free encyclopedia
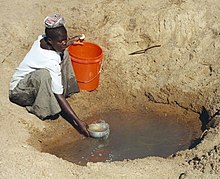
Mwamanogu Village water source, Tanzania. In Meatu District, Shinyanga Region, water most often comes from open holes dug in the sand of dry riverbeds, and it is invariably contaminated

Water scarcity in Africa is predicted to reach dangerously high levels by 2025 when it is estimated that about two-thirds of the world's population may suffer from fresh water shortage. The main causes of water scarcity in Africa are physical and economic scarcity, rapid population growth, and climate change. Water scarcity is the lack of fresh water resources to meet the standard water demand. Although Sub-Saharan Africa has a plentiful supply of rainwater, it is seasonal and unevenly distributed, leading to frequent floods and droughts. Additionally, prevalent economic development and poverty issues, compounded with rapid population growth and rural-urban migration have rendered Sub-Saharan Africa as the world's poorest and least developed region.

Water challenges in Africa

The 2012 Report by the Food and Agriculture Organization of the United Nations indicates that growing water scarcity is now one of the leading challenges for sustainable development. This is because an increasing number of the river basins have reached conditions of water scarcity through the combined demands of agriculture and other sectors. Impacts of water scarcity in Africa range from health (women and children are particularly affected) to education, agricultural productivity, sustainable development as well as the potential for more water conflicts.

To adequately address the issue of water scarcity in Africa, the United Nations Economic Commission for Africa emphasizes the need to invest in the development of Africa's potential water resources. This would improve food security and water security, and protect economic gains by effectively managing droughts, floods, and desertification.

Background

Local girls from Babile (Ethiopia) fill plastic water containers at the area's main water source.

Sub-Saharan Africa has the largest number of water-stressed countries of any other place on the planet and of an estimated 800 million people who live in Africa, 300 million live in a water stressed environment. According to findings presented at the 2012 Conference on "Water Scarcity in Africa: Issues and Challenges", it is estimated that by 2030, 75 million to 250 million people in Africa will be living in areas of high water stress, which will likely displace anywhere between 24 million and 700 million people as conditions become increasingly unlivable.

Water scarcity (closely related to water stress or water crisis) is the lack of fresh water resources to meet the standard water demand. There are two types of water scarcity namely physical and economic water scarcity. Physical water scarcity is where there is not enough water to meet all demands, including that needed for ecosystems to function. Arid areas for example Central and West Asia, and North Africa often experience physical water scarcity. Economic water scarcity on the other hand, is the result of lack of investment in infrastructure or technology to draw water from rivers, aquifers, or other water sources. It also results from weak human capacity to meet water demand. Much of Sub-Saharan Africa experience economic water scarcity.

There is enough freshwater available globally and averaged over the year to meet demand. As such, water scarcity is caused by a mismatch between when and where people need water, and when and where it is available. The main drivers of the increase in global water demand are the increasing world population, rise in living conditions, changing diets (to more animal products), and expansion of irrigated agriculture. Climate change (including droughts or floods), deforestation, water pollution and wasteful use of water can also cause insufficient water supply. Scarcity varies over time as a result of natural changes in hydrology. These variations in scarcity may also be a function of prevailing economic policy and planning approaches.

Regional variance

Northern Africa and Sub-Saharan Africa are progressing towards the Millennium Development Goal on water at different paces. While Northern Africa has 92% safe water coverage, Sub-Saharan Africa remains at a low 60% of coverage – leaving 40% of the 783 million people in that region without access to clean drinking water.

Some of these differences in clean water availability can be attributed to Africa's extreme climates. Although Sub-Saharan Africa has a plentiful supply of rainwater, it is seasonal and unevenly distributed, leading to frequent floods and droughts. Additionally, prevalent economic development and poverty issues, compounded with rapid population growth and rural-urban migration have rendered Sub-Saharan Africa as the world's poorest and least developed region. Thus, this poverty constrains many cities in this region from providing clean water and sanitation services and preventing the further deterioration of water quality even when opportunities exist to address these water issues. Additionally, the rapid population growth leads to an increased number of African settlements on flood-prone, high-risk land.

The latest report of the SDG goal 6 has mentioned various facts about water status in sub-Saharan Africa including the lack of hygiene and its impact on the nutritional status especially among children due to increased rate of infectious diseases. Also, almost 1/3 of the sub-Saharan population are in danger of hunger due to lack of access to food. Furthermore, sub-Saharan Africa lacks access to safe drinking water by 76% percent while only 6% of Europe and Northern America is not covered.

Causes

Physical and economic scarcity

Water scarcity is both a natural and human-made phenomenon. It is thus essential to break it down into two general types: Economic scarcity and physical scarcity. Economic scarcity refers to the fact that finding a reliable source of safe water is time-consuming and expensive. Alternatively, physical scarcity is when there simply is not enough water within a given region.

The 2006 United Nations Economic Commission for Africa estimates that 300 million out of the 800 million who live on the African continent live in a water-scarce environment. Specifically in the very north of Africa, as well the very south of Africa, the rising global temperatures accompanying climate change have intensified the hydrological cycle that leads to drier dry seasons, thus increasing the risk of more extreme and frequent droughts. This significantly impacts the availability, quality and quantity of water due to reduced river flows and reservoir storage, lowering of water tables and drying up of aquifers in the northern and southern regions of Africa.

The severity of African drought explained in different geographical areas.

Included in the category of physical scarcity is the issue of overexploitation. This is contributing to the shrinking of many of Africa's great lakes, including the Nakivale, Nakuru, and Lake Chad, which has shrunk to 10% of its former volume. In terms of policy, the incentives for overuse are among the most damaging, especially concerning ground water extraction. For ground water, once the pump is installed, the policy of many countries is to only constrain removal based on the cost of electricity, and in many cases subsidize electricity costs for agricultural uses, which damages incentives to conserve such resources. Additionally, many countries within Africa set the cost of water well below cost-recovery levels, thus discouraging efficient usage and threatening sustainability.

Population growth

Over the past century, the global population has more than doubled. Africa's population is notably the fastest growing in the world. It is expected to increase by roughly 50% over the next 18 years, growing from 1.2 billion people today to over 1.8 billion in 2035. In fact, Africa will account for nearly half of global population growth over the next two decades. There is also a simple but appreciable equation that, as population increases, so does water demand. At the same time, the water resources in African region are gradually diminishing due to the habitation in places that were previously water sources. As the population increases rapidly, there is urgent demands for improved health, quality of life, food security, and 'lubrication' of industrial growth, which also place severe constraints on the water available to achieve these goals.

The growing population will only exacerbate the water scarcity crisis as more pressure is placed on the availability and access of water resources. "Today, 41% of the world's population lives in river basins that are under water stress". This raises a major concern as many regions are reaching the limit at which water services can be sustainably delivered. Globally, about 55 percent of the world's population live in urban areas, and by 2030, there might be a 5 percent increase in this ratio. This is the same experience in Africa. Big cities like Lagos, Kinshasa and Nairobi have doubled their population within a fifteen years period. Although people are migrating into these urban cities, the availability of fresh water has stayed the same, or in some cases reduced, since water is a finite substance. The rising population in African cities creates a link to the imbalance between the supply of water and the demands in those cities.

Aside urbanization contributing to the imbalance between the demand and supply of water, urbanization also causes an increase in water pollution. As a result of more people moving into cities, there is increased deposit of sewage and waste into water bodies. In developing countries, over 90 percent of the sewage generated are disposed into water bodies and left untreated. Also, sewage system are inefficiently run, such that leaks from sewage pipes are left unattended to, which eventually leak into the soil and causes further pollution of underground water.

Climate change

According to the Africa Partnership Forum, "Although Africa is continent least responsible for climate change, it is particularly vulnerable to the effects," and the long-term impacts include, "changing rainfall patterns affecting agriculture and reducing food security; worsening water security; decreasing fish resources in large lakes due to rising temperature; shifting vector-borne diseases; rising sea level affecting low-lying coastal areas with large populations; and rising water stress". Such impacts can drastically affect the quantity and quality of water that children need to survive.

Studies predict that by the year 2050 the rainfall in Sub-Saharan Africa could drop by 10%, which will cause a major water shortage. This 10% decrease in precipitation would reduce drainage by 17% and the regions which are receiving 500–600 mm/year rainfall will experience a reduction by 50–30% respectively in the surface drainage. Additionally, the Human Development Report predicts warming paired with 10% less rainfall in interior regions of Africa, which will be amplified by water loss due to water loss increase from rising temperature. Droughts and floods are considered to be the most dangerous threat to physical water scarcity. This warming will be greatest over the semi-arid regions of the Sahara, along the Sahel, and interior areas of southern Africa.

The Intergovernmental Panel on Climate Change reports that climate change in Africa has manifested itself in more intense and longer droughts in the subtropics and tropics, while arid or semi-arid areas in northern, western, eastern, and parts of southern Africa are becoming drier and more susceptible to variability of precipitation and storms. Climate change has contributed immensely to the already exacerbating water crisis situation in Africa and globally, making the World Health organization declare climate change as the greatest threat to global health in the 21st century.

The Human Development Report goes on to explain that because of Africa's dependence on rain-fed agriculture, widespread poverty, and weak capacity, the water issues caused by climate change impact the continent much more violently compared to developed nations that have the resources and economic diversity to deal with such global changes. This heightened potential for drought and falling crop yields will most likely lead to increased poverty, lower incomes, less secure livelihoods, and an increased threat of chronic hunger for the poorest people in sub-Saharan Africa. Overall this means that water stress caused by changing amounts of precipitation is particularly damaging to Africa and thus climate change is one of the major obstacles the continent must face when trying to secure reliable and clean sources of water.

Impacts

Health

People living in water deprived regions turn to unsafe water resources, which contributes to the spread of waterborne diseases including typhoid fever, cholera, dysentery and diarrhea. Additionally, water scarcity causes many people to store water within the household, which increases the risk of household water contamination and incidents of malaria and dengue fever spread by mosquitoes. These waterborne diseases are not usually found in developed countries because of sophisticated water treatment systems that filter and chlorinate water, but for those living with less developed or non-existent water infrastructure, natural, untreated water sources often contain tiny disease-carrying worms and bacteria. Although many of these waterborne sicknesses are treatable and preventable, they are nonetheless one of the leading causes of disease and death in the world. Globally, 2.2 million people die each year from diarrhea-related disease, and at any given time fifty percent of all hospital beds in the world are occupied by patients with water-related diseases. Infants and children are especially susceptible to these diseases because of their young immune systems, which lends to elevated infant mortality rates in many regions of Africa.

When infected with these waterborne diseases, those living in African communities suffering from water scarcity cannot contribute to the community's productivity and development because of a simple lack of strength. Additionally, individual, community and governmental economic resources are sapped by the cost of medicine to treat waterborne diseases, which takes away from resources that might have potentially been allocated in support of food supply or school fees.

Women and girls

African women and men's divergent social positions lead to differences in water responsibilities, rights, and access, and so African women are disproportionally burdened by the scarcity of clean drinking water. In most African societies, women are seen as the collectors, managers, and guardians of water, especially within the domestic sphere that includes household chores, cooking, washing, and child rearing. Because of these traditional gender labor roles, women are forced to spend around sixty percent of each day collecting water, which translates to approximately 200 million collective work hours by women globally per day and a decrease in the amount of time available for education.

Also, due to natural biological differences, when schools do not have the resources to provide proper toilet facilities, girls typically drop out before reaching puberty. Water scarcity exacerbates this issue, as indicated by the correlation of decrease in access to water with a decrease in combined primary, secondary, and tertiary enrollment of women.

For African women, their daily role in clean water retrieval often means carrying the typical jerrycan that can weigh over 40 pounds when full for an average of six kilometers each day. This has health consequences such as permanent skeletal damage from carrying heavy loads of water over long distances each day, which translates to a physical strain that contributes to increased stress, increased time spent in health recovery, and decreased ability to not only physically attend educational facilities, but also mentally absorb education due to the effect of stress on decision-making and memory skills. Also, in terms of health, access to safe and clean drinking water leads to greater protection from water-borne illnesses and diseases which increases all students' capabilities to attend school.

Agriculture

Ethiopia's move to fill the Grand Ethiopian Renaissance Dam's reservoir could reduce Nile flows by as much as 25% and devastate Egyptian farmlands.

Because the majority of Africa remains dependent on an agricultural lifestyle and 80% to 90% of all families in rural Africa rely upon producing their own food, water scarcity translates to a loss of food security. More than 70% of agriculture practiced in Sub-Saharan Africa is rainfed agriculture. With the increasing variability of current weather patterns the crops and harvests are more prone to being affected by droughts and floods.

According to the UN Economic Commission for Africa and New Partnership for Africa's Development, "irrigation is key to achieving increased agricultural production that is important for economic development and for attaining food security". Most of the rural African communities are currently not tapping into their irrigation potential. Irrigation agriculture only accounts for 20% of agriculture types globally. In Sub-Saharan Africa the governments have historically played a large part in irrigation development. Starting in the 1960s donors like the World Bank supported these African governments in the development of irrigations systems. However, in the years since, irrigation agriculture has produced a lower than expected crop yield. According to the World Bank the agriculture production in Sub-Saharan Africa could nearly triple by 2050.

The Sustainable Development Goal 2 aims to end hunger and promote sustainable agriculture to achieve food and nutrition security. There needs to be a shift from high-yield crop production to a more diversified cropping system, including underutilized nutritious crops that will contribute to dietary diversity and achieve daily nutrient goals.

But for many regions, there is a lack of financial and human resources to support infrastructure and technology required for proper crop irrigation. Because of this, the impact of droughts, floods, and desertification is greater in terms of both African economic loss and human life loss due to crop failure and starvation. In a study conducted by the World Bank, they found that, on average, individuals who suffer from malnutrition lose 10% of their potential lifetime earnings. They also found that countries lose 2%-3% of their GDP due to undernutrition.

Additionally, lack of water causes many Africans to use wastewater for crop growth, causing a large number of people to consume foods that can contain chemicals or disease-causing organisms transferred by the wastewater. Greywater constructed wetlands and modified sand filters are two methods of greywater filtration that have been proposed. These methods allow for greywater to be purified or filtered to remove biological hazards from the water that would not be safe to use in agriculture. Thus, for the extremely high number of African areas suffering from water scarcity issues, investing in development means sustainably withdrawing from clean freshwater sources, ensuring food security by expanding irrigation areas, and effectively managing the effects of climate change. The sustainable development goal report aims at increasing safe wastewater use to contribute to increasing food production and improved nutrition.

Productivity and development

Poverty is directly related to the accessibility of clean drinking water- without it, the chances of breaking out of the poverty trap are extremely slim. This concept of a "water poverty trap" was developed by economists specifically observing sub-Saharan Africa and refers to a cycle of financial poverty, low agricultural production, and increasing environmental degradation. In this negative feedback loop, this creates a link between the lack of water resources with the lack of financial resources that affect all societal levels including individual, household, and community. Within this poverty trap, people are subjected to low incomes, high fixed costs of water supply facilities, and lack of credit for water investments, which results in a low level of investment in water and land resources, lack of investment in profit-generating activities, resource degradation, and chronic poverty. Compounding on this, in the slums of developing countries, poor people typically pay five to ten times more per unit of water than do people with access to piped water because of issues – including the lack of infrastructure and government corruption – which is estimated to raise the prices of water services by 10% to 30%.

So, the social and economic consequences of a lack of clean water penetrate into realms of education, opportunities for gainful employment, physical strength and health, agricultural and industrial development, and thus the overall productive potential of a community, nation, and/or region. Because of this, the UN estimates that Sub-Saharan Africa alone loses 40 billion potential work hours per year collecting water.

Conflict

The population growth across the world and the climate change are two factors that together could give rise to water conflicts in many parts of the world. Already, the explosion of populations in developing nations within Africa combined with climate change is causing extreme strain within and between nations. In the past, countries have worked to resolve water tensions through negotiation, but there is predicted to be an escalation in aggression over water accessibility.

Africa's susceptibility to potential water-induced conflict can be separated into four regions: the Nile, Niger, Zambezi, and Volta basins. Running through Egypt, Ethiopia, and Sudan, the Nile's water has the potential to spark conflict and unrest. In the region of the Niger, the river basin extends from Guinea through Mali and down to Nigeria. Especially for Mali – one of the world's poorest countries – the river is vital for food, water and transportation, and its over usage is contributing to an increasingly polluted and unusable water source. In southern Africa, the Zambezi river basin is one of the world's most over-used river systems, and so Zambia and Zimbabwe compete fiercely over it. Additionally, in 2000, Zimbabwe caused the region to experience the worst flooding in recent history when the country opened the Kariba Dam gates. Finally, within the Volta river basin, Ghana is dependent on its hydroelectric output but plagued by regular droughts which affect the production of electricity from the Akosombo Dam and limit Ghana's ability to sustain economic growth. Paired with the constraints this also puts on Ghana's ability to provide power for the area, this could potentially contribute to regional instability.

At this point, federal intelligence agencies have issued the joint judgment that in the next ten years, water issues are not likely to cause internal and external tensions that lead to the intensification war. But if current rates of consumption paired with climatic stress continue, levels of water scarcity in Africa are predicted by UNECA to reach dangerously high levels by 2025. This means that by 2022 there is the potential for a shift in water scarcity's potential to contribute to armed conflict. Based on the classified National Intelligence Estimate on water security, requested by Secretary of State Hillary Clinton and completed in Fall 2011, after 2022 water will be more likely to be used as a weapon of war and potential tool for terrorism, especially in North Africa. On World Water Day, the State Department stated that water stress, "will likely increase the risk of instability and state failure, exacerbate regional tensions and distract countries from working with the United States on important policy objectives." Specifically referring to the Nile in Egypt, Sudan, and nations further south, the report predicts that upstream nations will limit access to water for political reasons and that terrorists may target water-related infrastructures, such as reservoirs and dams, more frequently. Because of this, the World Economic Forum's 2011 Global Risk Report has included water scarcity as one of the world's top five risks for the first time.

Approaches

Water permit systems

Some regions in African countries, like Tanzania, have attempted to address issues with water scarcity by instituting a water permit system. Under such a system, local rules are used to grant users access to a certain amount of water at certain locations. However, such systems often result in additional conflict, as water rights can be monopolized by large-scale irrigators at the expense of smallholder farmers in the region.

International and non-governmental organizations' efforts

To adequately address the issue of water scarcity in Africa, the United Nations Economic Commission for Africa emphasizes the need to invest in the development of Africa's potential water resources to reduce unnecessary suffering, ensure food security, and protect economic gains by effectively managing droughts, floods, and desertification. Some suggested and ongoing efforts to achieve this include an emphasis on infrastructural implementations and improvements of wells, rainwater catchment systems, and clean-water storage tanks.

Efforts made by the United Nations in compliance with the Millennium Development Goals have targeted water scarcity not just for Africa, but globally. The compiled list includes eight international development goals, seven of which are directly impacted by water scarcity. Access to water affects poverty, food scarcity, educational attainment, social and economic capital of women, livelihood security, disease, and human and environmental health. Because addressing the issue of water is so integral to reaching the MDGs, one of the sub-goals includes halving the proportion of the globe's population without sustainable access to safe drinking water by 2015. In March 2012, the UN announced that this goal has been met almost four years in advance, suggesting that global efforts to reduce water scarcity are on a successful trend.

As one of the five permanent members of the United Nations Security Council, the United States plays an integral role in promoting solutions to aid with clean water scarcity. One of many efforts include USAID's WASH- the WASH for Life partnership with the Gates Foundation- that works to promote water, sanitation, and hygiene. With this, the U.S. "will identify, test, and scale up evidence-based approaches for delivering these services to people in some of the poorest regions". Additionally, in March 2012, Hillary Clinton announced the U.S. Water Partnership, which will bring together people from the private sector, the philanthropic community, non-governmental organizations, academics, experts, and the government in an attempt to look for system-wide solutions. The technologies and ability to tackle the issue of water scarcity and cleanliness are present, but it is highly a matter of accessibility. Thus, the partnership will aim at making these solutions available and obtainable at a local level.

In addition to the role the United States, the United Nations, and other international governmental bodies, a number of charitable organizations work to provide clean water in Africa and elsewhere around the world. These charities are based on individual and group donations, which are then invested in a variety of methods and technologies to provide clean water.

In 2015, safe drinking water and sanitation sources have been provided to 90% of the world's inhabitants because of the efforts that had been made to achieve the MDGs. In continuation of this progress the UN have been recognized to include "Clean water and Sanitation" as the goal number six to "Ensure access to water and sanitation for all". The goal depends on the availability of enough fresh water of the world to achieve universal access to drinking and clean water for sanitation, but the lack of planning and shortage of investment is what the world needs to focus on. The main targets of the six SDG is that by 2030, the world will ensure water access for all, provide sanitary resources especially for people at risk, increase waste treatment and decrease the rate of water pollution. In addition to establishing new collaborative efforts on the international and local levels to improve water management systems.

Limitations

Africa is home to both the largest number of water-scarce countries out of any region, as well as home to the most difficult countries to reach in terms of water aid. The prevalence of rural villages traps many areas in what the UN Economic Commission for Africa refers to as the "Harvesting Stage", which makes water-scarce regions difficult to aid because of a lack of industrial technology to make solutions sustainable. In addition to the geographic and developmental limiting factors, a number of political, economic reasons also stand in the way of ensuring adequate aid for Africa. Politically, tensions between local governments versus foreign non-governmental organizations impact the ability to successfully bring in money and aid-workers. Economically, urban areas suffer from extreme wealth gaps in which the overwhelming poor often pay four to ten times more for sanitary water than the elite, hindering the poor from gaining access to clean water technologies and efforts. As a result of all these factors, it is estimated that fifty percent of all water projects fail, less than five percent of projects are visited, and less than one percent have any long term monitoring.

Country or city examples

Cape Town, South Africa

A city facing a water crisis is Cape Town, South Africa. The government and scientists in the area were preparing for "day zero", meaning that the area was almost completely out of water. The government was hopeful that voluntary conservation efforts and environmental factors would increase the water supply in the reservoirs, but these things did not happen which increased the likelihood of the city running out of potable water. Scientists at the University of Cape Town are concerned because without a water source they are not able to conduct valuable medical research or clinical studies. Day Zero was avoided and restrictions were lifted for residents, but conservation efforts are still in place with uncertainty in rainfall amounts.

Madagascar

On Madagascar's highland plateau, a massive transformation occurred that eliminated virtually all the heavily forested vegetation in the period 1970 to 2000. The slash and burn agriculture eliminated about ten percent of the total country's native biomass and converted it to a barren wasteland. These effects were from overpopulation and the necessity to feed poor indigenous peoples, but the adverse effects included widespread gully erosion that in turn produced heavily silted rivers that "run red" decades after the deforestation. This eliminated a large amount of usable fresh water and also destroyed much of the riverine ecosystems of several large west-flowing rivers. Several fish species have been driven to the edge of extinction and some, such as the disturbed coral reef formations in the Indian Ocean, are effectively lost.

Two children drinking sachet water

Nigeria

With approximately 199 million people, 86% of Nigerians don't have access to a safe source of drinking water. UNICEF reports that over half of the basic water services for 70% of Nigerians are contaminated. Lack of infrastructure throughout Nigeria prevents most communities from having clean water; a typical Nigerian gets only 9 liters of water on average each day. Because of this, many Nigerians depend on commercially available water such as sachet water (see picture) or bottled water. Polluted and contaminated groundwater supplies contribute to water scarcity in Nigeria. Some major categories of pollutants include fertilizer and agricultural runoff, poor sewage management systems, industrial waste, oil and gas contaminants, mineral mining by-products, and abattoir effluent.

Structured programming

From Wikipedia, the free encyclopedia ...