
Lightning is a natural phenomenon formed by electrostatic discharges through the atmosphere between two electrically charged regions, either both in the atmosphere or one in the atmosphere and one on the ground, temporarily neutralizing these in a near-instantaneous release of an average of between 200 megajoules and 7 gigajoules of energy, depending on the type. This discharge may produce a wide range of electromagnetic radiation, from heat created by the rapid movement of electrons, to brilliant flashes of visible light in the form of black-body radiation. Lightning causes thunder, a sound from the shock wave which develops as gases in the vicinity of the discharge experience a sudden increase in pressure. Lightning occurs commonly during thunderstorms as well as other types of energetic weather systems, but volcanic lightning can also occur during volcanic eruptions. Lightning is an atmospheric electrical phenomenon and contributes to the global atmospheric electrical circuit.
The three main kinds of lightning are distinguished by where they occur: either inside a single thundercloud (intra-cloud), between two clouds (cloud-to-cloud), or between a cloud and the ground (cloud-to-ground), in which case it is referred to as a lightning strike. Many other observational variants are recognized, including "heat lightning", which can be seen from a great distance but not heard; dry lightning, which can cause forest fires; and ball lightning, which is rarely observed scientifically.
Humans have deified lightning for millennia. Idiomatic expressions derived from lightning, such as the English expression "bolt from the blue", are common across languages. At all times people have been fascinated by the sight and difference of lightning. The fear of lightning is called astraphobia.
The first known photograph of lightning is from 1847, by Thomas Martin Easterly. The first surviving photograph is from 1882, by William Nicholson Jennings, a photographer who spent half his life capturing pictures of lightning and proving its diversity.
There is growing evidence that lightning activity is increased by particulate emissions (a form of air pollution). However, lightning may also improve air quality and clean greenhouse gases such as methane from the atmosphere, while creating nitrogen oxide and ozone at the same time. Lightning is also the major cause of wildfire, and wildfire can contribute to climate change as well. More studies are warranted to clarify their relationship.
Electrification


The details of the charging process are still being studied by scientists, but there is general agreement on some of the basic concepts of thunderstorm electrification. Electrification can be by the triboelectric effect leading to electron or ion transfer between colliding bodies. Uncharged, colliding water-drops can become charged because of charge transfer between them (as aqueous ions) in an electric field as would exist in a thunder cloud. The main charging area in a thunderstorm occurs in the central part of the storm where air is moving upward rapidly (updraft) and temperatures range from −15 to −25 °C (5 to −13 °F); see Figure 1. In that area, the combination of temperature and rapid upward air movement produces a mixture of super-cooled cloud droplets (small water droplets below freezing), small ice crystals, and graupel (soft hail). The updraft carries the super-cooled cloud droplets and very small ice crystals upward.
At the same time, the graupel, which is considerably larger and denser, tends to fall or be suspended in the rising air.
The differences in the movement of the precipitation cause collisions to occur. When the rising ice crystals collide with graupel, the ice crystals become positively charged and the graupel becomes negatively charged; see Figure 2. The updraft carries the positively charged ice crystals upward toward the top of the storm cloud. The larger and denser graupel is either suspended in the middle of the thunderstorm cloud or falls toward the lower part of the storm.
The result is that the upper part of the thunderstorm cloud becomes positively charged while the middle to lower part of the thunderstorm cloud becomes negatively charged.
The upward motions within the storm and winds at higher levels in the atmosphere tend to cause the small ice crystals (and positive charge) in the upper part of the thunderstorm cloud to spread out horizontally some distance from the thunderstorm cloud base. This part of the thunderstorm cloud is called the anvil. While this is the main charging process for the thunderstorm cloud, some of these charges can be redistributed by air movements within the storm (updrafts and downdrafts). In addition, there is a small but important positive charge buildup near the bottom of the thunderstorm cloud due to the precipitation and warmer temperatures.
The induced separation of charge in pure liquid water has been known since the 1840s as has the electrification of pure liquid water by the triboelectric effect.
William Thomson (Lord Kelvin) demonstrated that charge separation in water occurs in the usual electric fields at the earth's surface and developed a continuous electric field measuring device using that knowledge.
The physical separation of charge into different regions using liquid water was demonstrated by Kelvin with the Kelvin water dropper. The most likely charge-carrying species were considered to be the aqueous hydrogen ion and the aqueous hydroxide ion.
The electrical charging of solid water ice has also been considered. The charged species were again considered to be the hydrogen ion and the hydroxide ion.
An electron is not stable in liquid water with respect to a hydroxide ion plus dissolved hydrogen for the time scales involved in thunder storms.
The charge carrier in lightning is mainly electrons in a plasma. The process of going from charge as ions (positive hydrogen ion and negative hydroxide ion) associated with liquid water or solid water to charge as electrons associated with lightning must involve some form of electro-chemistry, that is, the oxidation and/or the reduction of chemical species. As hydroxide functions as a base and carbon dioxide is an acidic gas, it is possible that charged water clouds in which the negative charge is in the form of the aqueous hydroxide ion, interact with atmospheric carbon dioxide to form aqueous carbonate ions and aqueous hydrogen carbonate ions.
General considerations
The typical cloud-to-ground lightning flash culminates in the formation of an electrically conducting plasma channel through the air in excess of 5 km (3.1 mi) tall, from within the cloud to the ground's surface. The actual discharge is the final stage of a very complex process. At its peak, a typical thunderstorm produces three or more strikes to the Earth per minute.
Lightning primarily occurs when warm air is mixed with colder air masses, resulting in atmospheric disturbances necessary for polarizing the atmosphere.
Lightning can also occur during dust storms, forest fires, tornadoes, volcanic eruptions, and even in the cold of winter, where the lightning is known as thundersnow. Hurricanes typically generate some lightning, mainly in the rainbands as much as 160 km (99 mi) from the center.
Distribution, frequency and extent


Lightning is not distributed evenly around Earth. On Earth, the lightning frequency is approximately 44 (± 5) times per second, or nearly 1.4 billion flashes per year and the median duration is 0.52 seconds made up from a number of much shorter flashes (strokes) of around 60 to 70 microseconds.
Many factors affect the frequency, distribution, strength and physical properties of a typical lightning flash in a particular region of the world. These factors include ground elevation, latitude, prevailing wind currents, relative humidity, and proximity to warm and cold bodies of water. To a certain degree, the proportions of intra-cloud, cloud-to-cloud, and cloud-to-ground lightning may also vary by season in middle latitudes.
Because human beings are terrestrial and most of their possessions are on the Earth where lightning can damage or destroy them, cloud-to-ground (CG) lightning is the most studied and best understood of the three types, even though in-cloud (IC) and cloud-to-cloud (CC) are more common types of lightning. Lightning's relative unpredictability limits a complete explanation of how or why it occurs, even after hundreds of years of scientific investigation. About 70% of lightning occurs over land in the tropics where atmospheric convection is the greatest.
This occurs from both the mixture of warmer and colder air masses, as well as differences in moisture concentrations, and it generally happens at the boundaries between them. The flow of warm ocean currents past drier land masses, such as the Gulf Stream, partially explains the elevated frequency of lightning in the Southeast United States. Because large bodies of water lack the topographic variation that would result in atmospheric mixing, lightning is notably less frequent over the world's oceans than over land. The North and South Poles are limited in their coverage of thunderstorms and therefore result in areas with the least lightning.
In general, CG lightning flashes account for only 25% of all total lightning flashes worldwide. Since the base of a thunderstorm is usually negatively charged, this is where most CG lightning originates. This region is typically at the elevation where freezing occurs within the cloud. Freezing, combined with collisions between ice and water, appears to be a critical part of the initial charge development and separation process. During wind-driven collisions, ice crystals tend to develop a positive charge, while a heavier, slushy mixture of ice and water (called graupel) develops a negative charge. Updrafts within a storm cloud separate the lighter ice crystals from the heavier graupel, causing the top region of the cloud to accumulate a positive space charge while the lower level accumulates a negative space charge.
Because the concentrated charge within the cloud must exceed the insulating properties of air, and this increases proportionally to the distance between the cloud and the ground, the proportion of CG strikes (versus CC or IC discharges) becomes greater when the cloud is closer to the ground. In the tropics, where the freezing level is generally higher in the atmosphere, only 10% of lightning flashes are CG. At the latitude of Norway (around 60° North latitude), where the freezing elevation is lower, 50% of lightning is CG.
Lightning is usually produced by cumulonimbus clouds, which have bases that are typically 1–2 km (0.62–1.24 mi) above the ground and tops up to 15 km (9.3 mi) in height.
The place on Earth where lightning occurs most often is over Lake Maracaibo, wherein the Catatumbo lightning phenomenon produces 250 bolts of lightning a day. This activity occurs on average, 297 days a year. The second most lightning density is near the village of Kifuka in the mountains of the eastern Democratic Republic of the Congo, where the elevation is around 975 m (3,200 ft). On average, this region receives 158 lightning strikes per square kilometre per year (410/sq mi/yr). Other lightning hotspots include Singapore and Lightning Alley in Central Florida.
According to the World Meteorological Organization, on April 29, 2020, a bolt 768 km (477.2 mi) long was observed in the southern U.S.—sixty km (37 mi) longer than the previous distance record (southern Brazil, October 31, 2018). A single flash in Uruguay and northern Argentina on June 18, 2020, lasted for 17.1 seconds—0.37 seconds longer than the previous record (March 4, 2019, also in northern Argentina).
Necessary conditions
In order for an electrostatic discharge to occur, two preconditions are necessary: first, a sufficiently high potential difference between two regions of space must exist, and second, a high-resistance medium must obstruct the free, unimpeded equalization of the opposite charges. The atmosphere provides the electrical insulation, or barrier, that prevents free equalization between charged regions of opposite polarity.
It is well understood that during a thunderstorm there is charge separation and aggregation in certain regions of the cloud; however, the exact processes by which this occurs are not fully understood.
Electrical field generation
As a thundercloud moves over the surface of the Earth, an equal electric charge, but of opposite polarity, is induced on the Earth's surface underneath the cloud. The induced positive surface charge, when measured against a fixed point, will be small as the thundercloud approaches, increasing as the center of the storm arrives and dropping as the thundercloud passes. The referential value of the induced surface charge could be roughly represented as a bell curve.
The oppositely charged regions create an electric field within the air between them. This electric field varies in relation to the strength of the surface charge on the base of the thundercloud – the greater the accumulated charge, the higher the electrical field.
Flashes and strikes
The best-studied and understood form of lightning is cloud to ground (CG) lightning. Although more common, intra-cloud (IC) and cloud-to-cloud (CC) flashes are very difficult to study given there are no "physical" points to monitor inside the clouds. Also, given the very low probability of lightning striking the same point repeatedly and consistently, scientific inquiry is difficult even in areas of high CG frequency.
Lightning leaders


In a process not well understood, a bidirectional channel of ionized air, called a "leader", is initiated between oppositely-charged regions in a thundercloud. Leaders are electrically conductive channels of ionized gas that propagate through, or are otherwise attracted to, regions with a charge opposite of that of the leader tip. The negative end of the bidirectional leader fills a positive charge region, also called a well, inside the cloud while the positive end fills a negative charge well. Leaders often split, forming branches in a tree-like pattern. In addition, negative and some positive leaders travel in a discontinuous fashion, in a process called "stepping". The resulting jerky movement of the leaders can be readily observed in slow-motion videos of lightning flashes.
It is possible for one end of the leader to fill the oppositely-charged well entirely while the other end is still active. When this happens, the leader end which filled the well may propagate outside of the thundercloud and result in either a cloud-to-air flash or a cloud-to-ground flash. In a typical cloud-to-ground flash, a bidirectional leader initiates between the main negative and lower positive charge regions in a thundercloud. The weaker positive charge region is filled quickly by the negative leader which then propagates toward the inductively-charged ground.
The positively and negatively charged leaders proceed in opposite directions, positive upwards within the cloud and negative towards the earth. Both ionic channels proceed, in their respective directions, in a number of successive spurts. Each leader "pools" ions at the leading tips, shooting out one or more new leaders, momentarily pooling again to concentrate charged ions, then shooting out another leader. The negative leader continues to propagate and split as it heads downward, often speeding up as it gets closer to the Earth's surface.
About 90% of ionic channel lengths between "pools" are approximately 45 m (148 ft) in length. The establishment of the ionic channel takes a comparatively long amount of time (hundreds of milliseconds) in comparison to the resulting discharge, which occurs within a few dozen microseconds. The electric current needed to establish the channel, measured in the tens or hundreds of amperes, is dwarfed by subsequent currents during the actual discharge.
Initiation of the lightning leader is not well understood. The electric field strength within the thundercloud is not typically large enough to initiate this process by itself. Many hypotheses have been proposed. One hypothesis postulates that showers of relativistic electrons are created by cosmic rays and are then accelerated to higher velocities via a process called runaway breakdown. As these relativistic electrons collide and ionize neutral air molecules, they initiate leader formation. Another hypothesis involves locally enhanced electric fields being formed near elongated water droplets or ice crystals. Percolation theory, especially for the case of biased percolation, describes random connectivity phenomena, which produce an evolution of connected structures similar to that of lightning strikes. A streamer avalanche model has recently been favored by observational data taken by LOFAR during storms.
Upward streamers

When a stepped leader approaches the ground, the presence of opposite charges on the ground enhances the strength of the electric field. The electric field is strongest on grounded objects whose tops are closest to the base of the thundercloud, such as trees and tall buildings. If the electric field is strong enough, a positively charged ionic channel, called a positive or upward streamer, can develop from these points. This was first theorized by Heinz Kasemir.[57][58][59]
As negatively charged leaders approach, increasing the localized electric field strength, grounded objects already experiencing corona discharge will exceed a threshold and form upward streamers.
Attachment
Once a downward leader connects to an available upward leader, a process referred to as attachment, a low-resistance path is formed and discharge may occur. Photographs have been taken in which unattached streamers are clearly visible. The unattached downward leaders are also visible in branched lightning, none of which are connected to the earth, although it may appear they are. High-speed videos can show the attachment process in progress.
Discharge
Return stroke

Once a conductive channel bridges the air gap between the negative charge excess in the cloud and the positive surface charge excess below, there is a large drop in resistance across the lightning channel. Electrons accelerate rapidly as a result in a zone beginning at the point of attachment, which expands across the entire leader network at up to one third of the speed of light. This is the "return stroke" and it is the most luminous and noticeable part of the lightning discharge.
A large electric charge flows along the plasma channel, from the cloud to the ground, neutralising the positive ground charge as electrons flow away from the strike point to the surrounding area. This huge surge of current creates large radial voltage differences along the surface of the ground. Called step potentials, they are responsible for more injuries and deaths in groups of people or of other animals than the strike itself. Electricity takes every path available to it. Such step potentials will often cause current to flow through one leg and out another, electrocuting an unlucky human or animal standing near the point where the lightning strikes.
The electric current of the return stroke averages 30 kiloamperes for a typical negative CG flash, often referred to as "negative CG" lightning. In some cases, a ground-to-cloud (GC) lightning flash may originate from a positively charged region on the ground below a storm. These discharges normally originate from the tops of very tall structures, such as communications antennas. The rate at which the return stroke current travels has been found to be around 100,000 km/s (one-third of the speed of light).
The massive flow of electric current occurring during the return stroke combined with the rate at which it occurs (measured in microseconds) rapidly superheats the completed leader channel, forming a highly electrically conductive plasma channel. The core temperature of the plasma during the return stroke may exceed 50,000 °F (27,800 °C), causing it to radiate with a brilliant, blue-white color. Once the electric current stops flowing, the channel cools and dissipates over tens or hundreds of milliseconds, often disappearing as fragmented patches of glowing gas. The nearly instantaneous heating during the return stroke causes the air to expand explosively, producing a powerful shock wave which is heard as thunder.
Re-strike
High-speed videos (examined frame-by-frame) show that most negative CG lightning flashes are made up of 3 or 4 individual strokes, though there may be as many as 30.
Each re-strike is separated by a relatively large amount of time, typically 40 to 50 milliseconds, as other charged regions in the cloud are discharged in subsequent strokes. Re-strikes often cause a noticeable "strobe light" effect.
To understand why multiple return strokes utilize the same lightning channel, one needs to understand the behavior of positive leaders, which a typical ground flash effectively becomes following the negative leader's connection with the ground. Positive leaders decay more rapidly than negative leaders do. For reasons not well understood, bidirectional leaders tend to initiate on the tips of the decayed positive leaders in which the negative end attempts to re-ionize the leader network. These leaders, also called recoil leaders, usually decay shortly after their formation. When they do manage to make contact with a conductive portion of the main leader network, a return stroke-like process occurs and a dart leader travels across all or a portion of the length of the original leader. The dart leaders making connections with the ground are what cause a majority of subsequent return strokes.
Each successive stroke is preceded by intermediate dart leader strokes that have a faster rise time but lower amplitude than the initial return stroke. Each subsequent stroke usually re-uses the discharge channel taken by the previous one, but the channel may be offset from its previous position as wind displaces the hot channel.
Since recoil and dart leader processes do not occur on negative leaders, subsequent return strokes very seldom utilize the same channel on positive ground flashes which are explained later in the article.
Transient currents during flash
The electric current within a typical negative CG lightning discharge rises very quickly to its peak value in 1–10 microseconds, then decays more slowly over 50–200 microseconds. The transient nature of the current within a lightning flash results in several phenomena that need to be addressed in the effective protection of ground-based structures. Rapidly changing currents tend to travel on the surface of a conductor, in what is called the skin effect, unlike direct currents, which "flow-through" the entire conductor like water through a hose. Hence, conductors used in the protection of facilities tend to be multi-stranded, with small wires woven together. This increases the total bundle surface area in inverse proportion to the individual strand radius, for a fixed total cross-sectional area.
The rapidly changing currents also create electromagnetic pulses (EMPs) that radiate outward from the ionic channel. This is a characteristic of all electrical discharges. The radiated pulses rapidly weaken as their distance from the origin increases. However, if they pass over conductive elements such as power lines, communication lines, or metallic pipes, they may induce a current which travels outward to its termination. The surge current is inversely related to the surge impedance: the higher in impedance, the lower the current. This is the surge that, more often than not, results in the destruction of delicate electronics, electrical appliances, or electric motors. Devices known as surge protectors (SPD) or transient voltage surge suppressors (TVSS) attached in parallel with these lines can detect the lightning flash's transient irregular current, and, through alteration of its physical properties, route the spike to an attached earthing ground, thereby protecting the equipment from damage.
Types
Three primary types of lightning are defined by the "starting" and "ending" points of a flash channel.
- Intra-cloud (IC) or in-cloud lightning occurs within a single thundercloud unit.
- Cloud-to-cloud (CC) or inter-cloud lightning starts and ends between two different "functional" thundercloud units.
- Cloud-to-ground (CG) lightning primarily originates in the thundercloud and terminates on an Earth surface, but may also occur in the reverse direction, that is ground to cloud.
There are variations of each type, such as "positive" versus "negative" CG flashes, that have different physical characteristics common to each which can be measured. Different common names used to describe a particular lightning event may be attributed to the same or to different events.
Cloud to ground (CG)
Cloud-to-ground (CG) lightning is a lightning discharge between a thundercloud and the ground. It is initiated by a stepped leader moving down from the cloud, which is met by a streamer moving up from the ground.
CG is the least common, but best understood of all types of lightning. It is easier to study scientifically because it terminates on a physical object, namely the Earth, and lends itself to being measured by instruments on the ground. Of the three primary types of lightning, it poses the greatest threat to life and property since it terminates on the Earth or "strikes".
The overall discharge, termed a flash, is composed of a number of processes such as preliminary breakdown, stepped leaders, connecting leaders, return strokes, dart leaders, and subsequent return strokes. The conductivity of the electrical ground, be it soil, fresh water, or salt water, may affect the lightning discharge rate and thus visible characteristics.
Positive and negative lightning
Cloud-to-ground (CG) lightning is either positive or negative, as defined by the direction of the conventional electric current between cloud and ground. Most CG lightning is negative, meaning that a negative charge is transferred to ground and electrons travel downward along the lightning channel (conventionally the current flows from the ground to the cloud). The reverse happens in a positive CG flash, where electrons travel upward along the lightning channel and a positive charge is transferred to the ground (conventionally the current flows from the cloud to the ground). Positive lightning is less common than negative lightning, and on average makes up less than 5% of all lightning strikes.

There are six different mechanisms theorized to result in the formation of positive lightning.
- Vertical wind shear displacing the upper positive charge region of a thundercloud, exposing it to the ground below.
- The loss of lower charge regions in the dissipating stage of a thunderstorm, leaving the primary positive charge region.
- A complex arrangement of charge regions in a thundercloud, effectively resulting in an inverted dipole or inverted tripole in which the main negative charge region is above the main positive charge region instead of beneath it.
- An unusually large lower positive charge region in the thundercloud.
- Cutoff of an extended negative leader from its origin which creates a new bidirectional leader in which the positive end strikes the ground, commonly seen in anvil-crawler spider flashes.
- The initiation of a downward positive branch from an IC lightning flash.
Contrary to popular belief, positive lightning flashes do not necessarily originate from the anvil or the upper positive charge region and strike a rain-free area outside of the thunderstorm. This belief is based on the outdated idea that lightning leaders are unipolar and originate from their respective charge region.
Positive lightning strikes tend to be much more intense than their negative counterparts. An average bolt of negative lightning carries an electric current of 30,000 amperes (30 kA), and transfers 15 C (coulombs) of electric charge and 1 gigajoule of energy. Large bolts of positive lightning can carry up to 120 kA and 350 C. The average positive ground flash has roughly double the peak current of a typical negative flash, and can produce peak currents up to 400 kA and charges of several hundred coulombs. Furthermore, positive ground flashes with high peak currents are commonly followed by long continuing currents, a correlation not seen in negative ground flashes.
As a result of their greater power, positive lightning strikes are considerably more dangerous than negative strikes. Positive lightning produces both higher peak currents and longer continuing currents, making them capable of heating surfaces to much higher levels which increases the likelihood of a fire being ignited. The long distances positive lightning can propagate through clear air explains why they are known as "bolts from the blue", giving no warning to observers.
Despite the popular misconception that these are positive lightning strikes due to them seemingly originating from the positive charge region, observations have shown that these are in fact negative flashes. They begin as IC flashes within the cloud, the negative leader then exits the cloud from the positive charge region before propagating through clear air and striking the ground some distance away.
Positive lightning has also been shown to trigger the occurrence of upward lightning flashes from the tops of tall structures and is largely responsible for the initiation of sprites several tens of km above ground level. Positive lightning tends to occur more frequently in winter storms, as with thundersnow, during intense tornadoes and in the dissipation stage of a thunderstorm. Huge quantities of extremely low frequency (ELF) and very low frequency (VLF) radio waves are also generated.
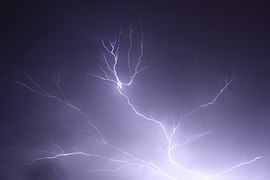
Cloud to cloud (CC) and intra-cloud (IC)
Lightning discharges may occur between areas of cloud without contacting the ground. When it occurs between two separate clouds, it is known as cloud-to-cloud (CC) or inter-cloud lightning; when it occurs between areas of differing electric potential within a single cloud, it is known as intra-cloud (IC) lightning. IC lightning is the most frequently occurring type.
IC lightning most commonly occurs between the upper anvil portion and lower reaches of a given thunderstorm. This lightning can sometimes be observed at great distances at night as so-called "sheet lightning". In such instances, the observer may see only a flash of light without hearing any thunder.
Another term used for cloud–cloud or cloud–cloud–ground lightning is "Anvil Crawler", due to the habit of charge, typically originating beneath or within the anvil and scrambling through the upper cloud layers of a thunderstorm, often generating dramatic multiple branch strokes. These are usually seen as a thunderstorm passes over the observer or begins to decay. The most vivid crawler behavior occurs in well developed thunderstorms that feature extensive rear anvil shearing.
-
 Branching of cloud to cloud lightning, New Delhi, India.
 -
 Multiple paths of cloud-to-cloud lightning, Swifts Creek, Australia.
 -
 Intra-clouds lightning over the Baltic Sea.
 -
 Cloud-to-cloud lightning, Albury, Australia


Effects
Lightning strike
Effects on objects


Objects struck by lightning experience heat and magnetic forces of great magnitude. The heat created by lightning currents travelling through a tree may vaporize its sap, causing a steam explosion that bursts the trunk. As lightning travels through sandy soil, the soil surrounding the plasma channel may melt, forming tubular structures called fulgurites.
Effects on buildings and vehicles
Buildings or tall structures hit by lightning may be damaged as the lightning seeks unimpeded paths to the ground. By safely conducting a lightning strike to the ground, a lightning protection system, usually incorporating at least one lightning rod, can greatly reduce the probability of severe property damage.
Aircraft are highly susceptible to being struck due to their metallic fuselages, but lightning strikes are generally not dangerous to them. Due to the conductive properties of aluminium alloy, the fuselage acts as a Faraday cage. Present day aircraft are built to be safe from a lightning strike and passengers will generally not even know that it has happened.
Effects on animals
Although 90 percent of people struck by lightning survive, animals – including humans – struck by lightning may suffer severe injury due to internal organ and nervous system damage.
Other effects
Lightning serves an important role in the nitrogen cycle by oxidizing diatomic nitrogen in the air into nitrates which are deposited by rain and can fertilize the growth of plants and other organisms.
Thunder
Because the electrostatic discharge of terrestrial lightning superheats the air to plasma temperatures along the length of the discharge channel in a short duration, kinetic theory dictates gaseous molecules undergo a rapid increase in pressure and thus expand outward from the lightning creating a shock wave audible as thunder. Since the sound waves propagate not from a single point source but along the length of the lightning's path, the sound origin's varying distances from the observer can generate a rolling or rumbling effect. Perception of the sonic characteristics is further complicated by factors such as the irregular and possibly branching geometry of the lightning channel, by acoustic echoing from terrain, and by the usually multiple-stroke characteristic of the lightning strike.
Light travels at about 300,000,000 m/s (980,000,000 ft/s), and sound travels through air at about 343 m/s (1,130 ft/s). An observer can approximate the distance to the strike by timing the interval between the visible lightning and the audible thunder it generates. A lightning flash preceding its thunder by one second would be approximately 343 m (1,125 ft) in distance; a delay of three seconds would indicate a distance of about 1 km or 0.62 mi (3 × 343 m). A flash preceding thunder by five seconds would indicate a distance of approximately 1.7 km or 1.1 mi (5 × 343 m). Consequently, a lightning strike observed at a very close distance will be accompanied by a sudden clap of thunder, with almost no perceptible time lapse, possibly accompanied by the smell of ozone (O3).
Lightning at a sufficient distance may be seen and not heard; there is data that a lightning storm can be seen at over 160 km (100 mi) whereas the thunder travels about 32 km (20 mi). Anecdotally, there are many examples of people saying 'the storm was directly overhead or all-around and yet there was no thunder'. Since thunderclouds can be up to 20 km high, lightning occurring high up in the cloud may appear close but is actually too far away to produce noticeable thunder.
Radio

Lightning discharges generate radio-frequency pulses which can be received thousands of kilometres from their source as radio atmospheric signals and whistlers.
High-energy radiation
The production of X-rays by a bolt of lightning was predicted as early as 1925 by C.T.R. Wilson, but no evidence was found until 2001/2002, when researchers at the New Mexico Institute of Mining and Technology detected X-ray emissions from an induced lightning strike along a grounded wire trailed behind a rocket shot into a storm cloud. In the same year University of Florida and Florida Tech researchers used an array of electric field and X-ray detectors at a lightning research facility in North Florida to confirm that natural lightning makes X-rays in large quantities during the propagation of stepped leaders. The cause of the X-ray emissions is still a matter for research, as the temperature of lightning is too low to account for the X-rays observed.
A number of observations by space-based telescopes have revealed even higher energy gamma ray emissions, the so-called terrestrial gamma-ray flashes (TGFs). These observations pose a challenge to current theories of lightning, especially with the recent discovery of the clear signatures of antimatter produced in lightning. Recent research has shown that secondary species, produced by these TGFs, such as electrons, positrons, neutrons or protons, can gain energies of up to several tens of MeV.
Ozone and nitrogen oxides
The very high temperatures generated by lightning lead to significant local increases in ozone and oxides of nitrogen. Each lightning flash in temperate and sub-tropical areas produces 7 kg of NOx on average. In the troposphere the effect of lightning can increase NOx by 90% and ozone by 30%.
Volcanic

Volcanic activity produces lightning-friendly conditions in multiple ways. The enormous quantity of pulverized material and gases explosively ejected into the atmosphere creates a dense plume of particles. The ash density and constant motion within the volcanic plume produces charge by frictional interactions (triboelectrification), resulting in very powerful and very frequent flashes as the cloud attempts to neutralize itself. Due to the extensive solid material (ash) content, unlike the water rich charge generating zones of a normal thundercloud, it is often called a dirty thunderstorm.
- Powerful and frequent flashes have been witnessed in the volcanic plume as far back as the eruption of Mount Vesuvius in AD 79 by Pliny The Younger.
- Likewise, vapors and ash originating from vents on the volcano's flanks may produce more localized and smaller flashes upwards of 2.9 km long.
- Small, short duration sparks, recently documented near newly extruded magma, attest to the material being highly charged prior to even entering the atmosphere.
If the volcanic ash plume rises to freezing temperatures, ice particles form and collide with ash particles to cause electrification. Lightning can be detected in any explosion but the causation of additional electrification from ice particles in ash can lead to a stronger electrical field and a higher rate of detectable lightning. Lightning is also used as a volcano monitoring tool for detecting hazardous eruptions.
Fire lightning
Intense forest fires, such as those seen in the 2019–20 Australian bushfire season, can create their own weather systems that can produce lightning and other weather phenomena. Intense heat from a fire causes air to rapidly rise within the smoke plume, causing the formation of pyrocumulonimbus clouds. Cooler air is drawn in by this turbulent, rising air, helping to cool the plume. The rising plume is further cooled by the lower atmospheric pressure at high altitude, allowing the moisture in it to condense into cloud. Pyrocumulonimbus clouds form in an unstable atmosphere. These weather systems can produce dry lightning, fire tornadoes, intense winds, and dirty hail.
Extraterrestrial
Lightning has been observed within the atmospheres of other planets, such as Jupiter, Saturn, and probably Uranus and Neptune. Lightning on Jupiter is far more energetic than on Earth, despite seeming to be generated via the same mechanism. Recently, a new type of lightning was detected on Jupiter, thought to originate from "mushballs" including ammonia.
Lightning on Venus has been a controversial subject after decades of study. During the Soviet Venera and U.S. Pioneer missions of the 1970s and 1980s, signals suggesting lightning may be present in the upper atmosphere were detected. The short Cassini–Huygens mission fly-by of Venus in 1999 detected no signs of lightning, but radio pulses recorded by the spacecraft Venus Express (which began orbiting Venus in April 2006) may originate from lightning on Venus.
- Airplane contrails have also been observed to influence lightning to a small degree. The water vapor-dense contrails of airplanes may provide a lower resistance pathway through the atmosphere having some influence upon the establishment of an ionic pathway for a lightning flash to follow.
- Rocket exhaust plumes provided a pathway for lightning when it was witnessed striking the Apollo 12 rocket shortly after takeoff.
- Thermonuclear explosions, by providing extra material for electrical conduction and a very turbulent localized atmosphere, have been seen triggering lightning flashes within the mushroom cloud. In addition, intense gamma radiation from large nuclear explosions may develop intensely charged regions in the surrounding air through Compton scattering. The intensely charged space charge regions create multiple clear-air lightning discharges shortly after the device detonates.
Scientific study
The science of lightning is called fulminology.
Properties
Lightning causes thunder, a sound from the shock wave which develops as gases in the vicinity of the discharge heat suddenly to very high temperatures. It is often heard a few seconds after the lightning itself. Thunder is heard as a rolling, gradually dissipating rumble because the sound from different portions of a long stroke arrives at slightly different times.
When the local electric field exceeds the dielectric strength of damp air (about 3 MV/m), electrical discharge results in a strike, often followed by commensurate discharges branching from the same path. Mechanisms that cause the charges to build up to lightning are still a matter of scientific investigation. A 2016 study confirmed dielectric breakdown is involved. Lightning may be caused by the circulation of warm moisture-filled air through electric fields. Ice or water particles then accumulate charge as in a Van de Graaff generator.
Researchers at the University of Florida found that the final one-dimensional speeds of 10 flashes observed were between 1.0×10⁵ and 1.4×10⁶ m/s, with an average of 4.4×10⁵ m/s.
Detection and monitoring

The earliest detector invented to warn of the approach of a thunderstorm was the lightning bell. Benjamin Franklin installed one such device in his house. The detector was based on an electrostatic device called the 'electric chimes' invented by Andrew Gordon in 1742.
Lightning discharges generate a wide range of electromagnetic radiations, including radio-frequency pulses. The times at which a pulse from a given lightning discharge arrives at several receivers can be used to locate the source of the discharge with a precision on the order of metres. The United States federal government has constructed a nationwide grid of such lightning detectors, allowing lightning discharges to be tracked in real time throughout the continental U.S.
In addition, Blitzortung (a private global detection system that consists of over 500 detection stations owned and operated by hobbyists/volunteers) provides near real-time lightning maps at https://en.blitzortung.org.
The Earth-ionosphere waveguide traps electromagnetic VLF- and ELF waves. Electromagnetic pulses transmitted by lightning strikes propagate within that waveguide. The waveguide is dispersive, which means that their group velocity depends on frequency. The difference of the group time delay of a lightning pulse at adjacent frequencies is proportional to the distance between transmitter and receiver. Together with direction-finding methods, this allows locating lightning strikes up to distances of 10,000 km from their origin. Moreover, the eigenfrequencies of the Earth-ionospheric waveguide, the Schumann resonances at about 7.5 Hz, are used to determine the global thunderstorm activity.[122]
In addition to ground-based lightning detection, several instruments aboard satellites have been constructed to observe lightning distribution. These include the Optical Transient Detector (OTD), aboard the OrbView-1 satellite launched on April 3, 1995, and the subsequent Lightning Imaging Sensor (LIS) aboard TRMM launched on November 28, 1997.
Starting in 2016, the National Oceanic and Atmospheric Administration launched Geostationary Operational Environmental Satellite–R Series (GOES-R) weather satellites outfitted with Geostationary Lightning Mapper (GLM) instruments which are near-infrared optical transient detectors that can detect the momentary changes in an optical scene, indicating the presence of lightning. The lightning detection data can be converted into a real-time map of lightning activity across the Western Hemisphere; this mapping technique has been implemented by the United States National Weather Service.
In 2022 EUMETSAT plan to launch the Lightning Imager (MTG-I LI) on board Meteosat Third Generation. This will complement NOAA's GLM. MTG-I LI will cover Europe and Africa and will include products on events, groups and flashes.
Artificially triggered
- Rocket-triggered lightning can be "triggered" by launching specially designed rockets
trailing spools of wire into thunderstorms. The wire unwinds as the
rocket ascends, creating an elevated ground that can attract descending
leaders. If a leader attaches, the wire provides a low-resistance
pathway for a lightning flash to occur. The wire is vaporized by the
return current flow, creating a straight lightning plasma channel in its
place. This method allows for scientific research of lightning to occur
under a more controlled and predictable manner.
- The International Center for Lightning Research and Testing (ICLRT) at Camp Blanding, Florida typically uses rocket triggered lightning in their research studies.
- Laser-triggered
- Since the 1970s, researchers have attempted to trigger lightning strikes by means of infrared or ultraviolet lasers, which create a channel of ionized gas through which the lightning would be conducted to ground. Such triggering of lightning is intended to protect rocket launching pads, electric power facilities, and other sensitive targets.
- In New Mexico, U.S., scientists tested a new terawatt laser which provoked lightning. Scientists fired ultra-fast pulses from an extremely powerful laser thus sending several terawatts into the clouds to call down electrical discharges in storm clouds over the region. The laser beams sent from the laser make channels of ionized molecules known as filaments. Before the lightning strikes earth, the filaments lead electricity through the clouds, playing the role of lightning rods. Researchers generated filaments that lived a period too short to trigger a real lightning strike. Nevertheless, a boost in electrical activity within the clouds was registered. According to the French and German scientists who ran the experiment, the fast pulses sent from the laser will be able to provoke lightning strikes on demand. Statistical analysis showed that their laser pulses indeed enhanced the electrical activity in the thundercloud where it was aimed—in effect they generated small local discharges located at the position of the plasma channels.
Physical manifestations

Magnetism
The movement of electrical charges produces a magnetic field (see electromagnetism). The intense currents of a lightning discharge create a fleeting but very strong magnetic field. Where the lightning current path passes through rock, soil, or metal these materials can become permanently magnetized. This effect is known as lightning-induced remanent magnetism, or LIRM. These currents follow the least resistive path, often horizontally near the surface but sometimes vertically, where faults, ore bodies, or ground water offers a less resistive path. One theory suggests that lodestones, natural magnets encountered in ancient times, were created in this manner.
Lightning-induced magnetic anomalies can be mapped in the ground, and analysis of magnetized materials can confirm lightning was the source of the magnetization and provide an estimate of the peak current of the lightning discharge.
Research at the University of Innsbruck has calculated that magnetic fields generated by plasma may induce hallucinations in subjects located within 200 m (660 ft) of a severe lightning storm, like what happened in Transcranial magnetic stimulation (TMS).
Solar wind and cosmic rays
Some high energy cosmic rays produced by supernovas as well as solar particles from the solar wind, enter the atmosphere and electrify the air, which may create pathways for lightning bolts.
Lightning and climate change
Due to the low resolution of global climate models, accurately representing lightning in these climate models is difficult, largely due to their inability to simulate the convection and cloud ice imperative which are fundamental to lightning formation. Research from the Future Climate for Africa programme demonstrates that using a convection-permitting model over Africa can more accurately capture convective thunderstorms and the distribution of ice particles. This research indicates climate change may increase the total amount of lightning only slightly: the total number of lightning days per year decreases, while more cloud ice and stronger convection leads to more lightning strikes occurring on days when lightning does occur.
A study from the University of Washington looked at lightning activity in the Arctic from 2010 to 2020. The ratio of Arctic summertime strokes was compared to total global strokes and was observed to be increasing with time, indicating that the region is becoming more influenced by lightning. The fraction of strokes above 65 degrees north was found to be increasing linearly with the NOAA global temperature anomaly and grew by a factor of 3 as the anomaly increased from 0.65 to 0.95 °C
Paleolightning
Paleolightning refers to the remnants of ancient lightning activity studied in fields such as historical geology, geoarchaeology, and fulminology. Paleolightning provides tangible evidence for the study lightning activity in Earth's past and the roles lightning may have played in Earth's history. Some studies have speculated that lightning activity played a crucial role in the development of not only Earth's early atmosphere but also early life. Lightning, a non-biological process, has been found to produce biologically useful material through the oxidation and reduction of inorganic matter. Research on the impact of lightning on Earth's atmosphere continues today, especially with regard to feedback mechanisms of lightning-produced nitrate compounds on atmospheric composition and global average temperatures.
Detecting lightning activity in the geologic record can be difficult, given the instantaneous nature of lightning strikes in general. However, fulgurite, a glassy tube-like, crust-like, or irregular mineraloid that forms when lightning fuses soil, quartz sands, clay, rock, biomass, or caliche is prevalent in electrically active regions around the globe and provides evidence of not only past lightning activity, but also patterns of convection. Since lightning channels carry an electric current to the ground, lightning can produce magnetic fields as well. While lightning-magnetic anomalies can provide evidence of lightning activity in a region, these anomalies are often problematic for those examining the magnetic record of rock types because they disguise the natural magnetic fields present.In culture and religion
Religion and mythology

In many cultures, lightning has been viewed as a sign or part of a deity or a deity in and of itself. These include the Greek god Zeus, the Aztec god Tlaloc, the Mayan God K, Slavic mythology's Perun, the Baltic Pērkons/Perkūnas, Thor in Norse mythology, Ukko in Finnish mythology, the Hindu god Indra, the Yoruba god Sango, Illapa in Inca mythology and the Shinto god Raijin. The ancient Etruscans produced guides to brontoscopic and fulgural divination of the future based on the omens supposedly displayed by thunder or lightning occurring on particular days of the year or in particular places. Such use of thunder and lightning in divination is also known as ceraunoscopy, a kind of aeromancy. In the traditional religion of the African Bantu tribes, lightning is a sign of the ire of the gods. Scriptures in Judaism, Islam and Christianity also ascribe supernatural importance to lightning. In Christianity, the Second Coming of Jesus is compared to lightning.
In popular culture
Although sometimes used figuratively, the idea that lightning never strikes the same place twice is a common myth. In fact, lightning can, and often does, strike the same place more than once. Lightning in a thunderstorm is more likely to strike objects and spots that are more prominent or conductive. For instance, lightning strikes the Empire State Building in New York City on average 23 times per year.
In French and Italian, the expression for "Love at first sight" is coup de foudre and colpo di fulmine, respectively, which literally translated means "lightning strike". Some European languages have a separate word for lightning which strikes the ground (as opposed to lightning in general); often it is a cognate of the English word "rays". The name of Australia's most celebrated thoroughbred horse, Phar Lap, derives from the shared Zhuang and Thai word for lightning.
Political and military culture

The bolt of lightning in heraldry is called a thunderbolt and is shown as a zigzag with non-pointed ends. This symbol usually represents power and speed.
Some political parties use lightning flashes as a symbol of power, such as the People's Action Party in Singapore, the British Union of Fascists during the 1930s, and the National States' Rights Party in the United States during the 1950s. The Schutzstaffel, the paramilitary wing of the Nazi Party, used the Sig rune in their logo which symbolizes lightning. The German word Blitzkrieg, which means "lightning war", was a major offensive strategy of the German army during World War II.
The lightning bolt is a common insignia for military communications units throughout the world. A lightning bolt is also the NATO symbol for a signal asset.
Data of injuries and deaths
The deadliest single direct lightning strike occurred when 21 people died as they huddled for safety in a hut that was hit (1975, Rhodesia).
The deadliest single indirect lightning strike was the 1994 Dronka lightning strike. 469 people died when lightning struck a set of oil tanks in 1994, causing burning oil to flood a town (1994, Dronka, Egypt).
In the United States an average of 23 people died from lightning per year from 2012 to 2021.


