Search This Blog

Tuesday, January 15, 2019

Social network analysis

From Wikipedia, the free encyclopedia

A social network diagram displaying friendship ties among a set of Facebook users.

Social network analysis (SNA) is the process of investigating social structures through the use of networks and graph theory. It characterizes networked structures in terms of nodes (individual actors, people, or things within the network) and the ties, edges, or links (relationships or interactions) that connect them. Examples of social structures commonly visualized through social network analysis include social media networks, memes spread, information circulation, friendship and acquaintance networks, business networks, social networks, collaboration graphs, kinship, disease transmission, and sexual relationships. These networks are often visualized through sociograms in which nodes are represented as points and ties are represented as lines. 

Social network analysis has emerged as a key technique in modern sociology. It has also gained a significant following in anthropology, biology, demography, communication studies, economics, geography, history, information science, organizational studies, political science, social psychology, development studies, sociolinguistics, and computer science and is now commonly available as a consumer tool.

History

Social network analysis has its theoretical roots in the work of early sociologists such as Georg Simmel and Émile Durkheim, who wrote about the importance of studying patterns of relationships that connect social actors. Social scientists have used the concept of "social networks" since early in the 20th century to connote complex sets of relationships between members of social systems at all scales, from interpersonal to international. In the 1930s Jacob Moreno and Helen Jennings introduced basic analytical methods. In 1954, John Arundel Barnes started using the term systematically to denote patterns of ties, encompassing concepts traditionally used by the public and those used by social scientists: bounded groups (e.g., tribes, families) and social categories (e.g., gender, ethnicity). Scholars such as Ronald Burt, Kathleen Carley, Mark Granovetter, David Krackhardt, Edward Laumann, Anatol Rapoport, Barry Wellman, Douglas R. White, and Harrison White expanded the use of systematic social network analysis. Even in the study of literature, network analysis has been applied by Anheier, Gerhards and Romo, Wouter De Nooy, and Burgert Senekal. Indeed, social network analysis has found applications in various academic disciplines, as well as practical applications such as countering money laundering and terrorism.

Metrics

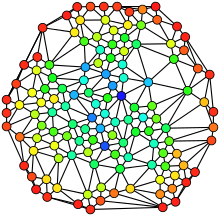
Hue (from red=0 to blue=max) indicates each node's betweenness centrality.

Connections

Homophily: The extent to which actors form ties with similar versus dissimilar others. Similarity can be defined by gender, race, age, occupation, educational achievement, status, values or any other salient characteristic. Homophily is also referred to as assortativity.
  • Multiplexity: The number of content-forms contained in a tie. For example, two people who are friends and also work together would have a multiplexity of 2. Multiplexity has been associated with relationship strength.
  • Mutuality/Reciprocity: The extent to which two actors reciprocate each other's friendship or other interaction.
  • Network Closure: A measure of the completeness of relational triads. An individual's assumption of network closure (i.e. that their friends are also friends) is called transitivity. Transitivity is an outcome of the individual or situational trait of Need for Cognitive Closure.
  • Propinquity: The tendency for actors to have more ties with geographically close others.

Distributions

  • Bridge: An individual whose weak ties fill a structural hole, providing the only link between two individuals or clusters. It also includes the shortest route when a longer one is unfeasible due to a high risk of message distortion or delivery failure.
  • Centrality: Centrality refers to a group of metrics that aim to quantify the "importance" or "influence" (in a variety of senses) of a particular node (or group) within a network. Examples of common methods of measuring "centrality" include betweenness centrality, closeness centrality, eigenvector centrality, alpha centrality, and degree centrality.
  • Density: The proportion of direct ties in a network relative to the total number possible.
  • Distance: The minimum number of ties required to connect two particular actors, as popularized by Stanley Milgram's small world experiment and the idea of 'six degrees of separation'.
  • Structural holes: The absence of ties between two parts of a network. Finding and exploiting a structural hole can give an entrepreneur a competitive advantage. This concept was developed by sociologist Ronald Burt, and is sometimes referred to as an alternate conception of social capital.
  • Tie Strength: Defined by the linear combination of time, emotional intensity, intimacy and reciprocity (i.e. mutuality). Strong ties are associated with homophily, propinquity and transitivity, while weak ties are associated with bridges.

Segmentation

Groups are identified as 'cliques' if every individual is directly tied to every other individual, 'social circles' if there is less stringency of direct contact, which is imprecise, or as structurally cohesive blocks if precision is wanted.
  • Clustering coefficient: A measure of the likelihood that two associates of a node are associates. A higher clustering coefficient indicates a greater 'cliquishness'.
  • Cohesion: The degree to which actors are connected directly to each other by cohesive bonds. Structural cohesion refers to the minimum number of members who, if removed from a group, would disconnect the group.

Modelling and visualization of networks

Visual representation of social networks is important to understand the network data and convey the result of the analysis. Numerous methods of visualization for data produced by social network analysis have been presented. Many of the analytic software have modules for network visualization. Exploration of the data is done through displaying nodes and ties in various layouts, and attributing colors, size and other advanced properties to nodes. Visual representations of networks may be a powerful method for conveying complex information, but care should be taken in interpreting node and graph properties from visual displays alone, as they may misrepresent structural properties better captured through quantitative analyses.

Signed graphs can be used to illustrate good and bad relationships between humans. A positive edge between two nodes denotes a positive relationship (friendship, alliance, dating) and a negative edge between two nodes denotes a negative relationship (hatred, anger). Signed social network graphs can be used to predict the future evolution of the graph. In signed social networks, there is the concept of "balanced" and "unbalanced" cycles. A balanced cycle is defined as a cycle where the product of all the signs are positive. According to balance theory, balanced graphs represent a group of people who are unlikely to change their opinions of the other people in the group. Unbalanced graphs represent a group of people who are very likely to change their opinions of the people in their group. For example, a group of 3 people (A, B, and C) where A and B have a positive relationship, B and C have a positive relationship, but C and A have a negative relationship is an unbalanced cycle. This group is very likely to morph into a balanced cycle, such as one where B only has a good relationship with A, and both A and B have a negative relationship with C. By using the concept of balanced and unbalanced cycles, the evolution of signed social network graphs can be predicted.

Especially when using social network analysis as a tool for facilitating change, different approaches of participatory network mapping have proven useful. Here participants / interviewers provide network data by actually mapping out the network (with pen and paper or digitally) during the data collection session. An example of a pen-and-paper network mapping approach, which also includes the collection of some actor attributes (perceived influence and goals of actors) is the * Net-map toolbox. One benefit of this approach is that it allows researchers to collect qualitative data and ask clarifying questions while the network data is collected.

Social networking potential

Social Networking Potential (SNP) is a numeric coefficient, derived through algorithms to represent both the size of an individual's social network and their ability to influence that network. SNP coefficients were first defined and used by Bob Gerstley in 2002. A closely related term is Alpha User, defined as a person with a high SNP. 

SNP coefficients have two primary functions:
  1. The classification of individuals based on their social networking potential, and
  2. The weighting of respondents in quantitative marketing research studies.
By calculating the SNP of respondents and by targeting High SNP respondents, the strength and relevance of quantitative marketing research used to drive viral marketing strategies is enhanced. 

Variables used to calculate an individual's SNP include but are not limited to: participation in Social Networking activities, group memberships, leadership roles, recognition, publication/editing/contributing to non-electronic media, publication/editing/contributing to electronic media (websites, blogs), and frequency of past distribution of information within their network. The acronym "SNP" and some of the first algorithms developed to quantify an individual's social networking potential were described in the white paper "Advertising Research is Changing" (Gerstley, 2003) See Viral Marketing.

The first book to discuss the commercial use of Alpha Users among mobile telecoms audiences was 3G Marketing by Ahonen, Kasper and Melkko in 2004. The first book to discuss Alpha Users more generally in the context of social marketing intelligence was Communities Dominate Brands by Ahonen & Moore in 2005. In 2012, Nicola Greco (UCL) presents at TEDx the Social Networking Potential as a parallelism to the potential energy that users generate and companies should use, stating that "SNP is the new asset that every company should aim to have".

Practical applications

Social network analysis is used extensively in a wide range of applications and disciplines. Some common network analysis applications include data aggregation and mining, network propagation modeling, network modeling and sampling, user attribute and behavior analysis, community-maintained resource support, location-based interaction analysis, social sharing and filtering, recommender systems development, and link prediction and entity resolution. In the private sector, businesses use social network analysis to support activities such as customer interaction and analysis, information system development analysis, marketing, and business intelligence needs. Some public sector uses include development of leader engagement strategies, analysis of individual and group engagement and media use, and community-based problem solving.

Security applications

Social network analysis is also used in intelligence, counter-intelligence and law enforcement activities. This technique allows the analysts to map covert organizations such as a espionage ring, an organized crime family or a street gang. The National Security Agency (NSA) uses its clandestine mass electronic surveillance programs to generate the data needed to perform this type of analysis on terrorist cells and other networks deemed relevant to national security. The NSA looks up to three nodes deep during this network analysis. After the initial mapping of the social network is complete, analysis is performed to determine the structure of the network and determine, for example, the leaders within the network. This allows military or law enforcement assets to launch capture-or-kill decapitation attacks on the high-value targets in leadership positions to disrupt the functioning of the network. The NSA has been performing social network analysis on call detail records (CDRs), also known as metadata, since shortly after the September 11 attacks.

Textual analysis applications

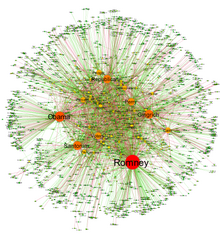
Large textual corpora can be turned into networks and then analysed with the method of social network analysis. In these networks, the nodes are Social Actors, and the links are Actions. The extraction of these networks can be automated by using parsers. The resulting networks, which can contain thousands of nodes, are then analyzed by using tools from network theory to identify the key actors, the key communities or parties, and general properties such as robustness or structural stability of the overall network, or centrality of certain nodes. This automates the approach introduced by Quantitative Narrative Analysis, whereby subject-verb-object triplets are identified with pairs of actors linked by an action, or pairs formed by actor-object.

Narrative network of US Elections 2012

Internet applications

Social network analysis has also been applied to understanding online behavior by individuals, organizations, and between websites. Hyperlink analysis can be used to analyze the connections between websites or webpages to examine how information flows as individuals navigate the web. The connections between organizations has been analyzed via hyperlink analysis to examine which organizations within an issue community.

Social Media Internet Applications

Social network analysis has been applied to social media as a tool to understand behavior between individuals or organizations through their linkages on social media websites such as Twitter and Facebook.

In computer-supported collaborative learning

One of the most current methods of the application of SNA is to the study of computer-supported collaborative learning (CSCL). When applied to CSCL, SNA is used to help understand how learners collaborate in terms of amount, frequency, and length, as well as the quality, topic, and strategies of communication. Additionally, SNA can focus on specific aspects of the network connection, or the entire network as a whole. It uses graphical representations, written representations, and data representations to help examine the connections within a CSCL network. When applying SNA to a CSCL environment the interactions of the participants are treated as a social network. The focus of the analysis is on the "connections" made among the participants – how they interact and communicate – as opposed to how each participant behaved on his or her own.

Key terms

There are several key terms associated with social network analysis research in computer-supported collaborative learning such as: density, centrality, indegree, outdegree, and sociogram.
  • Density refers to the "connections" between participants. Density is defined as the number of connections a participant has, divided by the total possible connections a participant could have. For example, if there are 20 people participating, each person could potentially connect to 19 other people. A density of 100% (19/19) is the greatest density in the system. A density of 5% indicates there is only 1 of 19 possible connections.
  • Centrality focuses on the behavior of individual participants within a network. It measures the extent to which an individual interacts with other individuals in the network. The more an individual connects to others in a network, the greater their centrality in the network.
In-degree and out-degree variables are related to centrality.
  • In-degree centrality concentrates on a specific individual as the point of focus; centrality of all other individuals is based on their relation to the focal point of the "in-degree" individual.
  • Out-degree is a measure of centrality that still focuses on a single individual, but the analytic is concerned with the out-going interactions of the individual; the measure of out-degree centrality is how many times the focus point individual interacts with others.
  • A sociogram is a visualization with defined boundaries of connections in the network. For example, a sociogram which shows out-degree centrality points for Participant A would illustrate all outgoing connections Participant A made in the studied network.

Unique capabilities

Researchers employ social network analysis in the study of computer-supported collaborative learning in part due to the unique capabilities it offers. This particular method allows the study of interaction patterns within a networked learning community and can help illustrate the extent of the participants' interactions with the other members of the group. The graphics created using SNA tools provide visualizations of the connections among participants and the strategies used to communicate within the group. Some authors also suggest that SNA provides a method of easily analyzing changes in participatory patterns of members over time.

A number of research studies have applied SNA to CSCL across a variety of contexts. The findings include the correlation between a network's density and the teacher's presence, a greater regard for the recommendations of "central" participants, infrequency of cross-gender interaction in a network, and the relatively small role played by an instructor in an asynchronous learning network.

Other methods used alongside SNA

Although many studies have demonstrated the value of social network analysis within the computer-supported collaborative learning field, researchers have suggested that SNA by itself is not enough for achieving a full understanding of CSCL. The complexity of the interaction processes and the myriad sources of data make it difficult for SNA to provide an in-depth analysis of CSCL. Researchers indicate that SNA needs to be complemented with other methods of analysis to form a more accurate picture of collaborative learning experiences.

A number of research studies have combined other types of analysis with SNA in the study of CSCL. This can be referred to as a multi-method approach or data triangulation, which will lead to an increase of evaluation reliability in CSCL studies.
  • Qualitative method – The principles of qualitative case study research constitute a solid framework for the integration of SNA methods in the study of CSCL experiences.
    • Ethnographic data such as student questionnaires and interviews and classroom non-participant observations
    • Case studies: comprehensively study particular CSCL situations and relate findings to general schemes
    • Content analysis: offers information about the content of the communication among members
  • Quantitative method – This includes simple descriptive statistical analyses on occurrences to identify particular attitudes of group members who have not been able to be tracked via SNA in order to detect general tendencies.
    • Computer log files: provide automatic data on how collaborative tools are used by learners
    • Multidimensional scaling (MDS): charts similarities among actors, so that more similar input data is closer together
    • Software tools: QUEST, SAMSA (System for Adjacency Matrix and Sociogram-based Analysis), and Nud*IST
Computational sociology

From Wikipedia, the free encyclopedia

Computational sociology is a branch of sociology that uses computationally intensive methods to analyze and model social phenomena. Using computer simulations, artificial intelligence, complex statistical methods, and analytic approaches like social network analysis, computational sociology develops and tests theories of complex social processes through bottom-up modeling of social interactions.
 
It involves the understanding of social agents, the interaction among these agents, and the effect of these interactions on the social aggregate. Although the subject matter and methodologies in social science differ from those in natural science or computer science, several of the approaches used in contemporary social simulation originated from fields such as physics and artificial intelligence. Some of the approaches that originated in this field have been imported into the natural sciences, such as measures of network centrality from the fields of social network analysis and network science.

In relevant literature, computational sociology is often related to the study of social complexity. Social complexity concepts such as complex systems, non-linear interconnection among macro and micro process, and emergence, have entered the vocabulary of computational sociology. A practical and well-known example is the construction of a computational model in the form of an "artificial society", by which researchers can analyze the structure of a social system.

History

Historical map of research paradigms and associated scientists in sociology and complexity science.

Background

In the past four decades, computational sociology has been introduced and gaining popularity. This has been used primarily for modeling or building explanations of social processes and are depending on the emergence of complex behavior from simple activities. The idea behind emergence is that properties of any bigger system don't always have to be properties of the components that the system is made of. The people responsible for the introduction of the idea of emergence are Alexander, Morgan, and Broad, who were classical emergentists. The time at which these emergentists came up with this concept and method was during the time of the early twentieth century. The aim of this method was to find a good enough accommodation between two different and extreme ontologies, which were reductionist materialism and dualism.

While emergence has had a valuable and important role with the foundation of Computational Sociology, there are those who do not necessarily agree. One major leader in the field, Epstein, doubted the use because there were aspects that are unexplainable. Epstein put up a claim against emergentism, in which he says it "is precisely the generative sufficiency of the parts that constitutes the whole's explanation".

Agent-based models have had a historical influence on Computational Sociology. These models first came around in the 1960s, and were used to simulate control and feedback processes in organizations, cities, etc. During the 1970s, the application introduced the use of individuals as the main units for the analyses and used bottom-up strategies for modeling behaviors. The last wave occurred in the 1980s. At this time, the models were still bottom-up; the only difference is that the agents interact interdependently.

Systems theory and structural functionalism

In the post-war era, Vannevar Bush's differential analyser, John von Neumann's cellular automata, Norbert Wiener's cybernetics, and Claude Shannon's information theory became influential paradigms for modeling and understanding complexity in technical systems. In response, scientists in disciplines such as physics, biology, electronics, and economics began to articulate a general theory of systems in which all natural and physical phenomena are manifestations of interrelated elements in a system that has common patterns and properties. Following Émile Durkheim's call to analyze complex modern society sui generis, post-war structural functionalist sociologists such as Talcott Parsons seized upon these theories of systematic and hierarchical interaction among constituent components to attempt to generate grand unified sociological theories, such as the AGIL paradigm. Sociologists such as George Homans argued that sociological theories should be formalized into hierarchical structures of propositions and precise terminology from which other propositions and hypotheses could be derived and operationalized into empirical studies. Because computer algorithms and programs had been used as early as 1956 to test and validate mathematical theorems, such as the four color theorem, some scholars anticipated that similar computational approaches could "solve" and "prove" analogously formalized problems and theorems of social structures and dynamics.

Macrosimulation and microsimulation

By the late 1960s and early 1970s, social scientists used increasingly available computing technology to perform macro-simulations of control and feedback processes in organizations, industries, cities, and global populations. These models used differential equations to predict population distributions as holistic functions of other systematic factors such as inventory control, urban traffic, migration, and disease transmission. Although simulations of social systems received substantial attention in the mid-1970s after the Club of Rome published reports predicting that policies promoting exponential economic growth would eventually bring global environmental catastrophe, the inconvenient conclusions led many authors to seek to discredit the models, attempting to make the researchers themselves appear unscientific. Hoping to avoid the same fate, many social scientists turned their attention toward micro-simulation models to make forecasts and study policy effects by modeling aggregate changes in state of individual-level entities rather than the changes in distribution at the population level. However, these micro-simulation models did not permit individuals to interact or adapt and were not intended for basic theoretical research.

Cellular automata and agent-based modeling

The 1970s and 1980s were also a time when physicists and mathematicians were attempting to model and analyze how simple component units, such as atoms, give rise to global properties, such as complex material properties at low temperatures, in magnetic materials, and within turbulent flows. Using cellular automata, scientists were able to specify systems consisting of a grid of cells in which each cell only occupied some finite states and changes between states were solely governed by the states of immediate neighbors. Along with advances in artificial intelligence and microcomputer power, these methods contributed to the development of "chaos theory" and "complexity theory" which, in turn, renewed interest in understanding complex physical and social systems across disciplinary boundaries. Research organizations explicitly dedicated to the interdisciplinary study of complexity were also founded in this era: the Santa Fe Institute was established in 1984 by scientists based at Los Alamos National Laboratory and the BACH group at the University of Michigan likewise started in the mid-1980s. 

This cellular automata paradigm gave rise to a third wave of social simulation emphasizing agent-based modeling. Like micro-simulations, these models emphasized bottom-up designs but adopted four key assumptions that diverged from microsimulation: autonomy, interdependency, simple rules, and adaptive behavior. Agent-based models are less concerned with predictive accuracy and instead emphasize theoretical development. In 1981, mathematician and political scientist Robert Axelrod and evolutionary biologist W.D. Hamilton published a major paper in Science titled "The Evolution of Cooperation" which used an agent-based modeling approach to demonstrate how social cooperation based upon reciprocity can be established and stabilized in a prisoner's dilemma game when agents followed simple rules of self-interest. Axelrod and Hamilton demonstrated that individual agents following a simple rule set of (1) cooperate on the first turn and (2) thereafter replicate the partner's previous action were able to develop "norms" of cooperation and sanctioning in the absence of canonical sociological constructs such as demographics, values, religion, and culture as preconditions or mediators of cooperation. Throughout the 1990s, scholars like William Sims Bainbridge, Kathleen Carley, Michael Macy, and John Skvoretz developed multi-agent-based models of generalized reciprocity, prejudice, social influence, and organizational information processing. In 1999, Nigel Gilbert published the first textbook on Social Simulation: Simulation for the social scientist and established its most relevant journal: the Journal of Artificial Societies and Social Simulation.

Data mining and social network analysis

Independent from developments in computational models of social systems, social network analysis emerged in the 1970s and 1980s from advances in graph theory, statistics, and studies of social structure as a distinct analytical method and was articulated and employed by sociologists like James S. Coleman, Harrison White, Linton Freeman, J. Clyde Mitchell, Mark Granovetter, Ronald Burt, and Barry Wellman. The increasing pervasiveness of computing and telecommunication technologies throughout the 1980s and 1990s demanded analytical techniques, such as network analysis and multilevel modeling, that could scale to increasingly complex and large data sets. The most recent wave of computational sociology, rather than employing simulations, uses network analysis and advanced statistical techniques to analyze large-scale computer databases of electronic proxies for behavioral data. Electronic records such as email and instant message records, hyperlinks on the World Wide Web, mobile phone usage, and discussion on Usenet allow social scientists to directly observe and analyze social behavior at multiple points in time and multiple levels of analysis without the constraints of traditional empirical methods such as interviews, participant observation, or survey instruments. Continued improvements in machine learning algorithms likewise have permitted social scientists and entrepreneurs to use novel techniques to identify latent and meaningful patterns of social interaction and evolution in large electronic datasets.

Narrative network of US Elections 2012
 
The automatic parsing of textual corpora has enabled the extraction of actors and their relational networks on a vast scale, turning textual data into network data. The resulting networks, which can contain thousands of nodes, are then analyzed by using tools from Network theory to identify the key actors, the key communities or parties, and general properties such as robustness or structural stability of the overall network, or centrality of certain nodes. This automates the approach introduced by quantitative narrative analysis, whereby subject-verb-object triplets are identified with pairs of actors linked by an action, or pairs formed by actor-object.

Computational content analysis

Content analysis has been a traditional part of social sciences and media studies for a long time. The automation of content analysis has allowed a "big data" revolution to take place in that field, with studies in social media and newspaper content that include millions of news items. Gender bias, readability, content similarity, reader preferences, and even mood have been analyzed based on text mining methods over millions of documents. The analysis of readability, gender bias and topic bias was demonstrated in Flaounas et al. showing how different topics have different gender biases and levels of readability; the possibility to detect mood shifts in a vast population by analyzing Twitter content was demonstrated as well.

The analysis of vast quantities of historical newspaper content has been pioneered by Dzogang et al., which showed how periodic structures can be automatically discovered in historical newspapers. A similar analysis was performed on social media, again revealing strongly periodic structures.

Challenges

Computational sociology, as with any field of study, faces a set of challenges. These challenges need to be handled meaningfully so as to make the maximum impact on society.

Levels and their interactions

Each society that is formed tends to be in one level or the other and there exists tendencies of interactions between and across these levels. Levels need not only be micro-level or macro-level in nature. There can be intermediate levels in which a society exists say - groups, networks, communities etc.

The question however arises as to how to identify these levels and how they come into existence? And once they are in existence how do they interact within themselves and with other levels?

If we view entities(agents) as nodes and the connections between them as the edges, we see the formation of networks. The connections in these networks do not come about based on just objective relationships between the entities, rather they are decided upon by factors chosen by the participating entities. The challenge with this process is that, it is difficult to identify when a set of entities will form a network. These networks may be of trust networks, co-operation networks, dependence networks etc. There have been cases where heterogeneous set of entities have shown to form strong and meaningful networks among themselves.

As discussed previously, societies fall into levels and in one such level, the individual level, a micro-macro link refers to the interactions which create higher-levels. There are a set of questions that needs to be answered regarding these Micro-Macro links. How they are formed? When do they converge? What is the feedback pushed to the lower levels and how are they pushed?

Another major challenge in this category concerns the validity of information and their sources. In recent years there has been a boom in information gathering and processing. However, little attention was paid to the spread of false information between the societies. Tracing back the sources and finding ownership of such information is difficult.

Culture modeling

The evolution of the networks and levels in the society brings about cultural diversity. A thought which arises however is that, when people tend to interact and become more accepting of other cultures and beliefs, how is it that diversity still persists? Why is there no convergence? A major challenge is how to model these diversities. Are there external factors like mass media, locality of societies etc. which influence the evolution or persistence of cultural diversities?

Experimentation and evaluation

Any study or modelling when combined with experimentation needs to be able to address the questions being asked. Computational social science deals with large scale data and the challenge becomes much more evident as the scale grows. How would one design informative simulations on a large scale? And even if a large scale simulation is brought up, how is the evaluation supposed to be performed?

Model choice and model complexities

Another challenge is identifying the models that would best fit the data and the complexities of these models. These models would help us predict how societies might evolve over time and provide possible explanations on how things work.

Generative models

Generative models helps us to perform extensive qualitative analysis in a controlled fashion. A model proposed by Epstein, is the agent-based simulation, which talks about identifying an initial set of heterogeneous entities(agents) and observe their evolution and growth based on simple local rules.

But what are these local rules? How does one identify them for a set of heterogeneous agents? Evaluation and impact of these rules state a whole new set of difficulties.

Heterogeneous or ensemble models

Integrating simple models which perform better on individual tasks to form a Hybrid model is an approach that can be looked into. These models can offer better performance and understanding of the data. However the trade-off of identifying and having a deep understanding of the interactions between these simple models arises when one needs to come up with one combined, well performing model. Also, coming up with tools and applications to help analyze and visualize the data based on these hybrid models is another added challenge.

Impact

Computational sociology can bring impacts to science, technology and society.

Impact on science

In order for the study of computational sociology to be effective, there has to be valuable innovations. These innovation can be of the form of new data analytics tools, better models and algorithms. The advent of such innovation will be a boon for the scientific community in large.

Impact on society

One of the major challenges of computational sociology is the modelling of social processes. Various law and policy makers would be able to see efficient and effective paths to issue new guidelines and the mass in general would be able to evaluate and gain fair understanding of the options presented in front of them enabling an open and well balanced decision process..

Journals and academic publications

The most relevant journal of the discipline is the Journal of Artificial Societies and Social Simulation.

Associations, conferences and workshops

Academic programs, departments and degrees

Centers and institutes

USA

Europe

Asia

Computer music

From Wikipedia, the free encyclopedia

Computer music is the application of computing technology in music composition, to help human composers create new music or to have computers independently create music, such as with algorithmic composition programs. It includes the theory and application of new and existing computer software technologies and basic aspects of music, such as sound synthesis, digital signal processing, sound design, sonic diffusion, acoustics, and psychoacoustics. The field of computer music can trace its roots back to the origins of electronic music, and the very first experiments and innovations with electronic instruments at the turn of the 20th century.

In the 2000s, with the widespread availability of relatively affordable home computers that have a fast processing speed, and the growth of home recording using digital audio recording systems ranging from Garageband to Protools, the term is sometimes used to describe music that has been created using digital technology.

History

CSIRAC, Australia's first digital computer, as displayed at the Melbourne Museum
 
Much of the work on computer music has drawn on the relationship between music and mathematics, a relationship which has been noted since the Ancient Greeks described the "harmony of the spheres".
Musical melodies were first generated by the computer originally named the CSIR Mark 1 (later renamed CSIRAC) in Australia in 1950. There were newspaper reports from America and England (early and recently) that computers may have played music earlier, but thorough research has debunked these stories as there is no evidence to support the newspaper reports (some of which were obviously speculative). Research has shown that people speculated about computers playing music, possibly because computers would make noises, but there is no evidence that they actually did it.

The world's first computer to play music was the CSIR Mark 1 (later named CSIRAC), which was designed and built by Trevor Pearcey and Maston Beard from the late 1940s. Mathematician Geoff Hill programmed the CSIR Mark 1 to play popular musical melodies from the very early 1950s. In 1950 the CSIR Mark 1 was used to play music, the first known use of a digital computer for the purpose. The music was never recorded, but it has been accurately reconstructed. In 1951 it publicly played the "Colonel Bogey March" of which only the reconstruction exists. However, the CSIR Mark 1 played standard repertoire and was not used to extend musical thinking or composition practice, as Max Mathews did, which is current computer-music practice. 

The first music to be performed in England was a performance of the British National Anthem that was programmed by Christopher Strachey on the Ferranti Mark I, late in 1951. Later that year, short extracts of three pieces were recorded there by a BBC outside broadcasting unit: the National Anthem, "Ba, Ba Black Sheep, and "In the Mood" and this is recognised as the earliest recording of a computer to play music. This recording can be heard at the this Manchester University site. Researchers at the University of Canterbury, Christchurch declicked and restored this recording in 2016 and the results may be heard on Soundcloud.

Two further major 1950s developments were the origins of digital sound synthesis by computer, and of algorithmic composition programs beyond rote playback. Max Mathews at Bell Laboratories developed the influential MUSIC I program and its descendants, further popularizing computer music through a 1963 article in Science. Among other pioneers, the musical chemists Lejaren Hiller and Leonard Isaacson worked on a series of algorithmic composition experiments from 1956-9, manifested in the 1957 premiere of the Illiac Suite for string quartet.

In Japan, experiments in computer music date back to 1962, when Keio University professor Sekine and Toshiba engineer Hayashi experimented with the TOSBAC computer. This resulted in a piece entitled TOSBAC Suite, influenced by the Illiac Suite. Later Japanese computer music compositions include a piece by Kenjiro Ezaki presented during Osaka Expo '70 and "Panoramic Sonore" (1974) by music critic Akimichi Takeda. Ezaki also published an article called "Contemporary Music and Computers" in 1970. Since then, Japanese research in computer music has largely been carried out for commercial purposes in popular music, though some of the more serious Japanese musicians used large computer systems such as the Fairlight in the 1970s.

The programming computer for Yamaha's first FM synthesizer GS1. CCRMA, Stanford University
 
Early computer-music programs typically did not run in real time. Programs would run for hours or days, on multimillion-dollar computers, to generate a few minutes of music. One way around this was to use a 'hybrid system', most notably the Roland MC-8 Microcomposer, where a microprocessor-based system controls an analog synthesizer, released in 1978. John Chowning's work on FM synthesis from the 1960s to the 1970s allowed much more efficient digital synthesis, eventually leading to the development of the affordable FM synthesis-based Yamaha DX7 digital synthesizer, released in 1983. In addition to the Yamaha DX7, the advent of inexpensive digital chips and microcomputers opened the door to real-time generation of computer music. In the 1980s, Japanese personal computers such as the NEC PC-88 came installed with FM synthesis sound chips and featured audio programming languages such as Music Macro Language (MML) and MIDI interfaces, which were most often used to produce video game music, or chiptunes. By the early 1990s, the performance of microprocessor-based computers reached the point that real-time generation of computer music using more general programs and algorithms became possible.
Interesting sounds must have a fluidity and changeability that allows them to remain fresh to the ear. In computer music this subtle ingredient is bought at a high computational cost, both in terms of the number of items requiring detail in a score and in the amount of interpretive work the instruments must produce to realize this detail in sound.

Advances

Advances in computing power and software for manipulation of digital media have dramatically affected the way computer music is generated and performed. Current-generation micro-computers are powerful enough to perform very sophisticated audio synthesis using a wide variety of algorithms and approaches. Computer music systems and approaches are now ubiquitous, and so firmly embedded in the process of creating music that we hardly give them a second thought: computer-based synthesizers, digital mixers, and effects units have become so commonplace that use of digital rather than analog technology to create and record music is the norm, rather than the exception.

Research

Despite the ubiquity of computer music in contemporary culture, there is considerable activity in the field of computer music, as researchers continue to pursue new and interesting computer-based synthesis, composition, and performance approaches. Throughout the world there are many organizations and institutions dedicated to the area of computer and electronic music study and research, including the ICMA (International Computer Music Association), C4DM (Center for Digital Music), IRCAM, GRAME, SEAMUS (Society for Electro Acoustic Music in the United States), CEC (Canadian Electroacoustic Community), and a great number of institutions of higher learning around the world.

Computer-generated music

Computer-generated music is music composed by, or with the extensive aid of, a computer. Although any music which uses computers in its composition or realisation is computer-generated to some extent, the use of computers is now so widespread (in the editing of pop songs, for instance) that the phrase computer-generated music is generally used to mean a kind of music which could not have been created without the use of computers.

We can distinguish two groups of computer-generated music: music in which a computer generated the score, which could be performed by humans, and music which is both composed and performed by computers. There is a large genre of music that is organized, synthesized, and created on computers.

Music composed and performed by computers

Later, composers such as Gottfried Michael Koenig had computers generate the sounds of the composition as well as the score. Koenig produced algorithmic composition programs which were a generalisation of his own serial composition practice. This is not exactly similar to Xenakis' work as he used mathematical abstractions and examined how far he could explore these musically. Koenig's software translated the calculation of mathematical equations into codes which represented musical notation. This could be converted into musical notation by hand and then performed by human players. His programs Project 1 and Project 2 are examples of this kind of software. Later, he extended the same kind of principles into the realm of synthesis, enabling the computer to produce the sound directly. SSP is an example of a program which performs this kind of function. All of these programs were produced by Koenig at the Institute of Sonology in Utrecht in the 1970s.

Procedures such as those used by Koenig and Xenakis are still in use today. Since the invention of the MIDI system in the early 1980s, for example, some people have worked on programs which map MIDI notes to an algorithm and then can either output sounds or music through the computer's sound card or write an audio file for other programs to play.

Some of these simple programs are based on fractal geometry, and can map midi notes to specific fractals, or fractal equations. Although such programs are widely available and are sometimes seen as clever toys for the non-musician, some professional musicians have given them attention also. The resulting 'music' can be more like noise, or can sound quite familiar and pleasant. As with much algorithmic music, and algorithmic art in general, more depends on the way in which the parameters are mapped to aspects of these equations than on the equations themselves. Thus, for example, the same equation can be made to produce both a lyrical and melodic piece of music in the style of the mid-nineteenth century, and a fantastically dissonant cacophony more reminiscent of the avant-garde music of the 1950s and 1960s.

Other programs can map mathematical formulae and constants to produce sequences of notes. In this manner, an irrational number can give an infinite sequence of notes where each note is a digit in the decimal expression of that number. This sequence can in turn be a composition in itself, or simply the basis for further elaboration.

Operations such as these, and even more elaborate operations can also be performed in computer music programming languages such as Max/MSP, Reaktor, SuperCollider, Csound, Pure Data (Pd), Keykit, and ChucK. These programs now easily run on most personal computers, and are often capable of more complex functions than those which would have necessitated the most powerful mainframe computers several decades ago.

There exist programs that generate "human-sounding" melodies by using a vast database of phrases. One example is Band-in-a-Box, which is capable of creating jazz, blues and rock instrumental solos with almost no user interaction. Another is Impro-Visor, which uses a stochastic context-free grammar to generate phrases and complete solos.

Another 'cybernetic' approach to computer composition uses specialized hardware to detect external stimuli which are then mapped by the computer to realize the performance. Examples of this style of computer music can be found in the middle-80's work of David Rokeby (Very Nervous System) where audience/performer motions are 'translated' to MIDI segments. Computer controlled music is also found in the performance pieces by the Canadian composer Udo Kasemets such as the Marce(ntennia)l Circus C(ag)elebrating Duchamp (1987), a realization of the Marcel Duchamp process piece Erratum Musical using an electric model train to collect a hopper-car of stones to be deposited on a drum wired to an Analog:Digital converter, mapping the stone impacts to a score display (performed in Toronto by pianist Gordon Monahan during the 1987 Duchamp Centennial), or his installations and performance works (e.g. Spectrascapes) based on his Geo(sono)scope (1986) 15x4-channel computer-controlled audio mixer. In these latter works, the computer generates sound-scapes from tape-loop sound samples, live shortwave or sine-wave generators.

Computer-generated scores for performance by human players

Many systems for generating musical scores actually existed well before the time of computers. One of these was Musikalisches Würfelspiel (Musical dice game; 18th century), a system which used throws of the dice to randomly select measures from a large collection of small phrases. When patched together, these phrases combined to create musical pieces which could be performed by human players. Although these works were not actually composed with a computer in the modern sense, it uses a rudimentary form of the random combinatorial techniques sometimes used in computer-generated composition.

The world's first digital computer music was generated in Australia by programmer Geoff Hill on the CSIRAC computer which was designed and built by Trevor Pearcey and Maston Beard, although it was only used to play standard tunes of the day. Subsequently, one of the first composers to write music with a computer was Iannis Xenakis. He wrote programs in the FORTRAN language that generated numeric data that he transcribed into scores to be played by traditional musical instruments. An example is ST/48 of 1962. Although Xenakis could well have composed this music by hand, the intensity of the calculations needed to transform probabilistic mathematics into musical notation was best left to the number-crunching power of the computer.

Computers have also been used in an attempt to imitate the music of great composers of the past, such as Mozart. A present exponent of this technique is David Cope. He wrote computer programs that analyse works of other composers to produce new works in a similar style. He has used this program to great effect with composers such as Bach and Mozart (his program Experiments in Musical Intelligence is famous for creating "Mozart's 42nd Symphony"), and also within his own pieces, combining his own creations with that of the computer.

Melomics, a research project from the University of Málaga, Spain, developed a computer composition cluster named Iamus, which composes complex, multi-instrument pieces for editing and performance. Since its inception, Iamus has composed a full album in 2012, appropriately named Iamus, which New Scientist described as "The first major work composed by a computer and performed by a full orchestra." The group has also developed an API for developers to utilize the technology, and makes its music available on its website.

Computer-aided algorithmic composition

Diagram illustrating the position of CAAC in relation to other Generative music Systems
 
Computer-aided algorithmic composition (CAAC, pronounced "sea-ack") is the implementation and use of algorithmic composition techniques in software. This label is derived from the combination of two labels, each too vague for continued use. The label computer-aided composition lacks the specificity of using generative algorithms. Music produced with notation or sequencing software could easily be considered computer-aided composition. The label algorithmic composition is likewise too broad, particularly in that it does not specify the use of a computer. The term computer-aided, rather than computer-assisted, is used in the same manner as computer-aided design.

Machine improvisation

Machine improvisation uses computer algorithms to create improvisation on existing music materials. This is usually done by sophisticated recombination of musical phrases extracted from existing music, either live or pre-recorded. In order to achieve credible improvisation in particular style, machine improvisation uses machine learning and pattern matching algorithms to analyze existing musical examples. The resulting patterns are then used to create new variations "in the style" of the original music, developing a notion of stylistic reinjection. This is different from other improvisation methods with computers that use algorithmic composition to generate new music without performing analysis of existing music examples .

Statistical style modeling

Style modeling implies building a computational representation of the musical surface that captures important stylistic features from data. Statistical approaches are used to capture the redundancies in terms of pattern dictionaries or repetitions, which are later recombined to generate new musical data. Style mixing can be realized by analysis of a database containing multiple musical examples in different styles. Machine Improvisation builds upon a long musical tradition of statistical modeling that began with Hiller and Isaacson's Illiac Suite for String Quartet (1957) and Xenakis' uses of Markov chains and stochastic processes. Modern methods include the use of lossless data compression for incremental parsing, prediction suffix tree and string searching by factor oracle algorithm (basically a factor oracle is a finite state automaton constructed in linear time and space in an incremental fashion).

Uses of machine improvisation

Machine improvisation encourages musical creativity by providing automatic modeling and transformation structures for existing music. This creates a natural interface with the musician without need for coding musical algorithms. In live performance, the system re-injects the musician's material in several different ways, allowing a semantics-level representation of the session and a smart recombination and transformation of this material in real-time. In offline version, machine improvisation can be used to achieve style mixing, an approach inspired by Vannevar Bush's memex imaginary machine.

Implementations

The first system implementing interactive machine improvisation by means of Markov models and style modeling techniques is the Continuator, developed by François Pachet at Sony CSL Paris in 2002 based on work on non-real time style modeling. Matlab implementation of the Factor Oracle machine improvisation can be found as part of Computer Audition toolbox. There is also an NTCC implementation of the Factor Oracle machine improvisation.

OMax is a software environment developed in IRCAM. OMax uses OpenMusic and Max. It is based on researches on stylistic modeling carried out by Gerard Assayag and Shlomo Dubnov and on researches on improvisation with the computer by G. Assayag, M. Chemillier and G. Bloch (a.k.a. the OMax Brothers) in the Ircam Music Representations group.

Musicians working with machine improvisation

Gerard Assayag (IRCAM, France), Jeremy Baguyos (University of Nebraska at Omaha, US) Tim Blackwell (Goldsmiths College, Great Britain), George Bloch (Composer, France), Marc Chemiller (IRCAM/CNRS, France), Nick Collins (University of Sussex, UK), Shlomo Dubnov (Composer, Israel / US), Mari Kimura (Juilliard, New York City), Amanuel Zarzowski (Composer Los Angeles/San Diego), George Lewis (Columbia University, New York City), Bernard Lubat (Pianist, France), François Pachet (Sony CSL, France), Joel Ryan (Institute of Sonology, Netherlands), Michel Waisvisz (STEIM, Netherlands), David Wessel (CNMAT, California), Michael Young (Goldsmiths College, Great Britain), Pietro Grossi (CNUCE, Institute of the National Research Council, Pisa, Italy), Toby Gifford and Andrew Brown (Griffith University, Brisbane, Australia), Davis Salks (jazz composer, Hamburg, PA, US), Doug Van Nort (electroacoustic improviser, Montreal/New York).

Live coding

Live coding (sometimes known as 'interactive programming', 'on-the-fly programming', 'just in time programming') is the name given to the process of writing software in realtime as part of a performance. Recently it has been explored as a more rigorous alternative to laptop musicians who, live coders often feel, lack the charisma and pizzazz of musicians performing live.

Generally, this practice stages a more general approach: one of interactive programming, of writing (parts of) programs while they are interpreted. Traditionally most computer music programs have tended toward the old write/compile/run model which evolved when computers were much less powerful. This approach has locked out code-level innovation by people whose programming skills are more modest. Some programs have gradually integrated real-time controllers and gesturing (for example, MIDI-driven software synthesis and parameter control). Until recently, however, the musician/composer rarely had the capability of real-time modification of program code itself. This legacy distinction is somewhat erased by languages such as ChucK, SuperCollider, and Impromptu.

TOPLAP, an ad-hoc conglomerate of artists interested in live coding was formed in 2004, and promotes the use, proliferation and exploration of a range of software, languages and techniques to implement live coding. This is a parallel and collaborative effort e.g. with research at the Princeton Sound Lab, the University of Cologne, and the Computational Arts Research Group at Queensland University of Technology.

Electronic design automation

From Wikipedia, the free encyclopedia https://en.wikipedia.org/w...