Search This Blog

Tuesday, June 26, 2018

Visual cortex

From Wikipedia, the free encyclopedia
 
Visual cortex
Brodmann areas 17 18 19.png
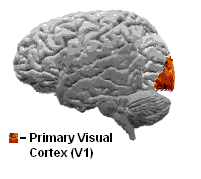
View of the brain from behind. Red = Brodmann area 17 (primary visual cortex); orange = area 18; yellow = area 19
Brodmann Cytoarchitectonics 17.png
Brain shown from the side, facing left. Above: view from outside, below: cut through the middle. Orange = Brodmann area 17 (primary visual cortex)
Details
Identifiers
Latin Cortex visualis
MeSH D014793
NeuroLex ID nlx_143552
FMA 242644
Anatomical terms of neuroanatomy

The visual cortex of the brain is a part of the cerebral cortex that processes visual information. It is located in the occipital lobe in the back of the head.

Visual information coming from the eye goes through the lateral geniculate nucleus in the thalamus and then reaches the visual cortex. The part of the visual cortex that receives the sensory inputs from the thalamus is the primary visual cortex, also known as visual area 1 (V1), and the striate cortex. The extrastriate areas consist of visual areas 2 (V2), 3 (V3), 4 (V4), and 5 (V5).[1]

Both hemispheres of the brain contain a visual cortex; the visual cortex in the left hemisphere receives signals from the right visual field, and the visual cortex in the right hemisphere receives signals from the left visual field.

Introduction

The primary visual cortex (V1) is located in and around the calcarine fissure in the occipital lobe. Each hemisphere's V1 receives information directly from its ipsilateral lateral geniculate nucleus that receives signals from the contralateral visual hemifield.

Neurons in the visual cortex fire action potentials when visual stimuli appear within their receptive field. By definition, the receptive field is the region within the entire visual field that elicits an action potential. But, for any given neuron, it may respond best to a subset of stimuli within its receptive field. This property is called neuronal tuning. In the earlier visual areas, neurons have simpler tuning. For example, a neuron in V1 may fire to any vertical stimulus in its receptive field. In the higher visual areas, neurons have complex tuning. For example, in the inferior temporal cortex (IT), a neuron may fire only when a certain face appears in its receptive field.

The visual cortex receives its blood supply primarily from the calcarine branch of the posterior cerebral artery.

Neural pathway diagram.svg

Psychological model of the neural processing of visual information

Ventral-dorsal model

The dorsal stream (green) and ventral stream (purple) are shown. They originate from primary visual cortex.

V1 transmits information to two primary pathways, called the ventral stream and the dorsal stream.[2]
  • The ventral stream begins with V1, goes through visual area V2, then through visual area V4, and to the inferior temporal cortex (IT cortex). The ventral stream, sometimes called the "What Pathway", is associated with form recognition and object representation. It is also associated with storage of long-term memory.
  • The dorsal stream begins with V1, goes through Visual area V2, then to the dorsomedial area (DM/ V6) and Visual area MT (middle temporal/ V5) and to the posterior parietal cortex. The dorsal stream, sometimes called the "Where Pathway" or "How Pathway", is associated with motion, representation of object locations, and control of the eyes and arms, especially when visual information is used to guide saccades or reaching.
The what vs. where account of the ventral/dorsal pathways was first described by Ungerleider and Mishkin.[3]

More recently, Goodale and Milner extended these ideas and suggested that the ventral stream is critical for visual perception whereas the dorsal stream mediates the visual control of skilled actions.[4] It has been shown that visual illusions such as the Ebbinghaus illusion distort judgements of a perceptual nature, but when the subject responds with an action, such as grasping, no distortion occurs.[5]

Work such as the one from Scharnowski and Gegenfurtner[6] suggests that both the action and perception systems are equally fooled by such illusions. Other studies, however, provide strong support for the idea that skilled actions such as grasping are not affected by pictorial illusions[7][8] and suggest that the action/perception dissociation is a useful way to characterize the functional division of labor between the dorsal and ventral visual pathways in the cerebral cortex.[9]

Primary visual cortex (V1)

Visualcortex.gif
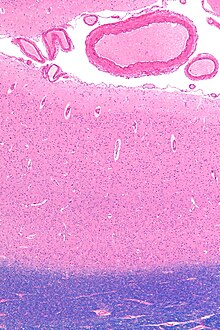
Micrograph showing the visual cortex (pink). The pia mater and arachnoid mater including blood vessels are seen at the top of the image. Subcortical white matter (blue) is seen at the bottom of the image. HE-LFB stain.

The primary visual cortex is the most studied visual area in the brain. In mammals, it is located in the posterior pole of the occipital lobe and is the simplest, earliest cortical visual area. It is highly specialized for processing information about static and moving objects and is excellent in pattern recognition.[clarification needed]

The functionally defined primary visual cortex is approximately equivalent to the anatomically defined striate cortex.[clarification needed] The name "striate cortex" is derived from the line of Gennari, a distinctive stripe visible to the naked eye[10] that represents myelinated axons from the lateral geniculate body terminating in layer 4 of the gray matter.

The primary visual cortex is divided into six functionally distinct layers, labeled 1 to 6. Layer 4, which receives most visual input from the lateral geniculate nucleus (LGN), is further divided into 4 layers, labelled 4A, 4B, 4Cα, and 4Cβ. Sublamina 4Cα[clarification needed] receives mostly magnocellular input from the LGN, while layer 4Cβ receives input from parvocellular pathways.

The average number of neurons in the adult human primary visual cortex in each hemisphere has been estimated at around 140 million.[11]

Function


V1 has a very well-defined map of the spatial information in vision. For example, in humans, the upper bank of the calcarine sulcus responds strongly to the lower half of visual field (below the center), and the lower bank of the calcarine to the upper half of visual field. In concept, this retinotopic mapping is a transformation of the visual image from retina to V1. The correspondence between a given location in V1 and in the subjective visual field is very precise: even the blind spots are mapped into V1. In terms of evolution, this correspondence is very basic and found in most animals that possess a V1. In humans and animals with a fovea in the retina, a large portion of V1 is mapped to the small, central portion of visual field, a phenomenon known as cortical magnification.[12] Perhaps for the purpose of accurate spatial encoding, neurons in V1 have the smallest receptive field size of any visual cortex microscopic regions.

The tuning properties of V1 neurons (what the neurons respond to) differ greatly over time. Early in time (40 ms and further) individual V1 neurons have strong tuning to a small set of stimuli. That is, the neuronal responses can discriminate small changes in visual orientations, spatial frequencies and colors. Furthermore, individual V1 neurons in humans and animals with binocular vision have ocular dominance, namely tuning to one of the two eyes. In V1, and primary sensory cortex in general, neurons with similar tuning properties tend to cluster together as cortical columns. David Hubel and Torsten Wiesel proposed the classic ice-cube organization model of cortical columns for two tuning properties: ocular dominance and orientation. However, this model cannot accommodate the color, spatial frequency and many other features to which neurons are tuned[citation needed]. The exact organization of all these cortical columns within V1 remains a hot topic of current research. The mathematical modeling of this function has been compared to Gabor transforms.

Later in time (after 100 ms), neurons in V1 are also sensitive to the more global organisation of the scene (Lamme & Roelfsema, 2000).[13] These response properties probably stem from recurrent feedback processing (the influence of higher-tier cortical areas on lower-tier cortical areas) and lateral connections from pyramidal neurons (Hupe et al. 1998). While feedforward connections are mainly driving, feedback connections are mostly modulatory in their effects (Angelucci et al., 2003; Hupe et al., 2001). Evidence shows that feedback originating in higher-level areas such as V4, IT, or MT, with bigger and more complex receptive fields, can modify and shape V1 responses, accounting for contextual or extra-classical receptive field effects (Guo et al., 2007; Huang et al., 2007; Sillito et al., 2006).

The visual information relayed to V1 is not coded in terms of spatial (or optical) imagery but rather are better described as edge detection. As an example, for an image comprising half side black and half side white, the dividing line between black and white has strongest local contrast (that is, edge detection) and is encoded, while few neurons code the brightness information (black or white per se). As information is further relayed to subsequent visual areas, it is coded as increasingly non-local frequency/phase signals. Note that, at these early stages of cortical visual processing, spatial location of visual information is well preserved amid the local contrast encoding (edge detection).

Axiomatically[clarification needed] determined functional models of simple cells in V1 have been determined by Lindeberg[14][15] in terms of directional derivatives[clarification needed] of affine Gaussian kernels[clarification needed] over the spatial domain[clarification needed] in combination with temporal derivatives[clarification needed] of either non-causal or time-causal scale-space kernels[clarification needed] over the temporal domain (see axiomatic theory of receptive fields). Specifically, it has been shown that this theory both leads to predictions about receptive fields with good qualitative agreement with the biological receptive field measurements performed by DeAngelis et al.[16][17] and guarantees good theoretical properties of the mathematical receptive field model, including covariance and invariance properties under natural image transformations.[18][relevant? ]

Differences in size of V1 also seem to have an effect on the perception of illusions.[19]

V2

Visual area V2, or secondary visual cortex, also called prestriate cortex,[20] is the second major area in the visual cortex, and the first region within the visual association area. It receives strong feedforward connections from V1 (direct and via the pulvinar) and sends strong connections to V3, V4, and V5. It also sends strong feedback connections to V1.

In terms of anatomy, V2 is split into four quadrants, a dorsal and ventral representation in the left and the right hemispheres. Together, these four regions provide a complete map of the visual world. V2 has many properties in common with V1: Cells are tuned to simple properties such as orientation, spatial frequency, and colour. The responses of many V2 neurons are also modulated by more complex properties, such as the orientation of illusory contours,[21][22] binocular disparity,[23] and whether the stimulus is part of the figure or the ground.[24][25] Recent research has shown that V2 cells show a small amount of attentional modulation (more than V1, less than V4), are tuned for moderately complex patterns, and may be driven by multiple orientations at different subregions within a single receptive field.

It is argued that the entire ventral visual-to-hippocampal stream is important for visual memory.[26] This theory, unlike the dominant one, predicts that object-recognition memory (ORM) alterations could result from the manipulation in V2, an area that is highly interconnected within the ventral stream of visual cortices. In the monkey brain, this area receives strong feedforward connections from the primary visual cortex (V1) and sends strong projections to other secondary visual cortices (V3, V4, and V5).[27][28] Most of the neurons of this area are tuned to simple visual characteristics such as orientation, spatial frequency, size, color, and shape.[22][29][30] Anatomical studies implicate layer 3 of area V2 in visual-information processing. In contrast to layer 3, layer 6 of the visual cortex is composed of many types of neurons, and their response to visual stimuli is more complex.
In a recent study, the Layer 6 cells of the V2 cortex were found to play a very important role in the storage of Object Recognition Memory as well as the conversion of short-term object memories into long-term memories.[31]

Third visual cortex, including area V3

The term third visual complex refers to the region of cortex located immediately in front of V2, which includes the region named visual area V3 in humans. The "complex" nomenclature is justified by the fact that some controversy still exists regarding the exact extent of area V3, with some researchers proposing that the cortex located in front of V2 may include two or three functional subdivisions. For example, David Van Essen and others (1986) have proposed the existence of a "dorsal V3" in the upper part of the cerebral hemisphere, which is distinct from the "ventral V3" (or ventral posterior area, VP) located in the lower part of the brain. Dorsal and ventral V3 have distinct connections with other parts of the brain, appear different in sections stained with a variety of methods, and contain neurons that respond to different combinations of visual stimulus (for example, colour-selective neurons are more common in the ventral V3). Additional subdivisions, including V3A and V3B have also been reported in humans. These subdivisions are located near dorsal V3, but do not adjoin V2.

Dorsal V3 is normally considered to be part of the dorsal stream, receiving inputs from V2 and from the primary visual area and projecting to the posterior parietal cortex. It may be anatomically located in Brodmann area 19. Braddick using fMRI has suggested that area V3/V3A may play a role in the processing of global motion[32] Other studies prefer to consider dorsal V3 as part of a larger area, named the dorsomedial area (DM), which contains a representation of the entire visual field. Neurons in area DM respond to coherent motion of large patterns covering extensive portions of the visual field (Lui and collaborators, 2006).

Ventral V3 (VP), has much weaker connections from the primary visual area, and stronger connections with the inferior temporal cortex. While earlier studies proposed that VP contained a representation of only the upper part of the visual field (above the point of fixation), more recent work indicates that this area is more extensive than previously appreciated, and like other visual areas it may contain a complete visual representation. The revised, more extensive VP is referred to as the ventrolateral posterior area (VLP) by Rosa and Tweedale.[33]

V4

Visual area V4 is one of the visual areas in the extrastriate visual cortex. In macaques, it is located anterior to V2 and posterior to posterior inferotemporal area (PIT). It comprises at least four regions (left and right V4d, left and right V4v), and some groups report that it contains rostral and caudal subdivisions as well. It is unknown whether the human V4 is as expansive as that of the macaque homologue which is a subject of debate.[34]
V4 is the third cortical area in the ventral stream, receiving strong feedforward input from V2 and sending strong connections to the PIT. It also receives direct input from V1, especially for central space. In addition, it has weaker connections to V5 and dorsal prelunate gyrus (DP).

V4 is the first area in the ventral stream to show strong attentional modulation. Most studies indicate that selective attention can change firing rates in V4 by about 20%. A seminal paper by Moran and Desimone characterizing these effects was the first paper to find attention effects anywhere in the visual cortex.[35]

Like V2, V4 is tuned for orientation, spatial frequency, and color. Unlike V2, V4 is tuned for object features of intermediate complexity, like simple geometric shapes, although no one has developed a full parametric description of the tuning space for V4. Visual area V4 is not tuned for complex objects such as faces, as areas in the inferotemporal cortex are.

The firing properties of V4 were first described by Semir Zeki in the late 1970s, who also named the area. Before that, V4 was known by its anatomical description, the prelunate gyrus. Originally, Zeki argued that the purpose of V4 was to process color information. Work in the early 1980s proved that V4 was as directly involved in form recognition as earlier cortical areas.[citation needed] This research supported the two-streams hypothesis, first presented by Ungerleider and Mishkin in 1982.

Recent work has shown that V4 exhibits long-term plasticity,[36] encodes stimulus salience, is gated by signals coming from the frontal eye fields,[37] and shows changes in the spatial profile of its receptive fields with attention.[citation needed]

Middle temporal visual area (V5)

The middle temporal visual area (MT or V5) is a region of extrastriate visual cortex. In several species of both New World monkeys and Old World monkeys the MT area contains a high concentration of direction-selective neurons.[38] The MT in primates is thought to play a major role in the perception of motion, the integration of local motion signals into global percepts, and the guidance of some eye movements.[38]

Connections

MT is connected to a wide array of cortical and subcortical brain areas. Its input comes from visual cortical areas V1, V2 and dorsal V3 (dorsomedial area),[39][40] the koniocellular regions of the LGN,[41] and the inferior pulvinar.[42] The pattern of projections to MT changes somewhat between the representations of the foveal and peripheral visual fields, with the latter receiving inputs from areas located in the midline cortex and retrosplenial region.[43]

A standard view is that V1 provides the "most important" input to MT.[38] Nonetheless, several studies have demonstrated that neurons in MT are capable of responding to visual information, often in a direction-selective manner, even after V1 has been destroyed or inactivated.[44] Moreover, research by Semir Zeki and collaborators has suggested that certain types of visual information may reach MT before it even reaches V1.

MT sends its major output to areas located in the cortex immediately surrounding it, including areas FST, MST, and V4t (middle temporal crescent). Other projections of MT target the eye movement-related areas of the frontal and parietal lobes (frontal eye field and lateral intraparietal area).

Function

The first studies of the electrophysiological properties of neurons in MT showed that a large portion of the cells are tuned to the speed and direction of moving visual stimuli.[45][46]

Lesion studies have also supported the role of MT in motion perception and eye movements.[47] Neuropsychological studies of a patient unable to see motion, seeing the world in a series of static 'frames' instead, suggested that V5 in the primate is homologous to MT in the human.[48][49]

However, since neurons in V1 are also tuned to the direction and speed of motion, these early results left open the question of precisely what MT could do that V1 could not. Much work has been carried out on this region, as it appears to integrate local visual motion signals into the global motion of complex objects.[50] For example, lesion to the V5 leads to deficits in perceiving motion and processing of complex stimuli. It contains many neurons selective for the motion of complex visual features (line ends, corners). Microstimulation of a neuron located in the V5 affects the perception of motion. For example, if one finds a neuron with preference for upward motion in a monkey's V5 and stimulates it with an electrode, then the monkey becomes more likely to report 'upward' motion when presented with stimuli containing 'left' and 'right' as well as 'upward' components.[51]

There is still much controversy over the exact form of the computations carried out in area MT[52] and some research suggests that feature motion is in fact already available at lower levels of the visual system such as V1. [53] [54]

Functional organization

MT was shown to be organized in direction columns.[55] DeAngelis argued that MT neurons were also organized based on their tuning for binocular disparity.[56]

V6

The dorsomedial area (DM) also known as V6, appears to respond to visual stimuli associated with self-motion [57] and wide-field stimulation.[58] V6, is a subdivision of the visual cortex of primates first described by John Allman and Jon Kaas in 1975.[59] V6 is located in the dorsal part of the extrastriate cortex, near the deep groove through the centre of the brain (medial longitudinal fissure), and typically also includes portions of the medial cortex, such as the parieto-occipital sulcus.[citation needed] DM contains a topographically organized representation of the entire field of vision.[citation needed]

There are similarities between the visual area V5 and V6 of the common marmoset. Both areas receive direct connections from the primary visual cortex.[citation needed] And both have a high myelin content, a characteristic that is usually present in brain structures involved in fast transmission of information.[citation needed]

For many years, it was considered that DM only existed in New World monkeys.[citation needed] However, more recent research has suggested that DM also exists in Old World monkeys and perhaps humans.[citation needed] V6 is also sometimes referred to as the parieto-occipital area (PO), although the correspondence is not exact.[60][61]

Properties

Neurons in area DM/V6 of night monkeys and common marmosets have unique response properties, including an extremely sharp selectivity for the orientation of visual contours, and preference for long, uninterrupted lines covering large parts of the visual field.[62][63]

However, in comparison with area MT, a much smaller proportion of DM cells shows selectivity for the direction of motion of visual patterns.[64] Another notable difference with area MT is that cells in DM are attuned to low spatial frequency components of an image, and respond poorly to the motion of textured patterns such as a field of random dots.[64] These response properties suggest that DM and MT may work in parallel, with the former analyzing self-motion relative to the environment, and the latter analyzing the motion of individual objects relative to the background.[64]

Recently, an area responsive to wide-angle flow fields has been identified in the human and is thought to be a homologue of macaque area V6.[65]

Pathways

The connections and response properties of cells in DM/ V6 suggest that this area is a key node in a subset of the 'dorsal stream', referred to by some as the 'dorsomedial pathway'.[citation needed] This pathway is likely to be important for the control of skeletomotor activity, including postural reactions and reaching movements towards objects [61] The main 'feedforward' connection of DM is to the cortex immediately rostral to it, in the interface between the occipital and parietal lobes (V6A).[citation needed] This region has, in turn, relatively direct connections with the regions of the frontal lobe that control arm movements, including the premotor cortex.

Chelation

From Wikipedia, the free encyclopedia
 
Chelation (US: /kˈlʃən/, UK: /ɪ-/) is a type of bonding of ions and molecules to metal ions. It involves the formation or presence of two or more separate coordinate bonds between a polydentate (multiple bonded) ligand and a single central atom.[1][2] Usually these ligands are organic compounds, and are called chelants, chelators, chelating agents, or sequestering agents.

Chelation is useful in applications such as providing nutritional supplements, in chelation therapy to remove toxic metals from the body, as contrast agents in MRI scanning, in manufacturing using homogeneous catalysts, in chemical water treatment to assist in the removal of metals, and in fertilizers.

Chelate effect

Ethylenediamine ligand chelating to a metal with two bonds.
 
Cu2+ complexes with nonchelating methylamine (left) and chelating ethylenediamine (right) ligands.
 
The chelate effect is the enhanced affinity of chelating ligands for a metal ion compared to the affinity of a collection of similar nonchelating (monodentate) ligands for the same metal.

The thermodynamic principles underpinning the chelate effect are illustrated by the contrasting affinities of copper(II) for ethylenediamine (en) vs. methylamine.
Cu2+ + en ⇌ [Cu(en)]2+


(1)
Cu2+ + 2 MeNH2 ⇌ [Cu(MeNH2)2]2+


(2)
In (1) the ethylenediamine forms a chelate complex with the copper ion. Chelation results in the formation of a five-membered CuC2N2 ring. In (2) the bidentate ligand is replaced by two monodentate methylamine ligands of approximately the same donor power, indicating that the Cu—N bonds is approximately the same in the two reactions.

The thermodynamic approach to describing the chelate effect considers the equilibrium constant for the reaction: the larger the equilibrium constant, the higher the concentration of the complex.
[Cu(en)] = β11[Cu][en]


(3)
[Cu(MeNH2)2] = β12[Cu][MeNH2]2


(4)
Electrical charges have been omitted for simplicity of notation. The square brackets indicate concentration, and the subscripts to the stability constants, β, indicate the stoichiometry of the complex. When the analytical concentration of methylamine is twice that of ethylenediamine and the concentration of copper is the same in both reactions, the concentration [Cu(en)] is much higher than the concentration [Cu(MeNH2)2] because β11 ≫ β12.

An equilibrium constant, K, is related to the standard Gibbs free energy, \Delta G^{\ominus } by
{\displaystyle \Delta G^{\ominus }=-RT\ln K=\Delta H^{\ominus }-T\Delta S^{\ominus }}
where R is the gas constant and T is the temperature in kelvins. {\displaystyle \Delta H^{\ominus }} is the standard enthalpy change of the reaction and {\displaystyle \Delta S^{\ominus }} is the standard entropy change.

Since the enthalpy should be approximately the same for the two reactions, the difference between the two stability constants is due to the effects of entropy. In equation (1) there are two particles on the left and one on the right, whereas in equation (2) there are three particles on the left and one on the right. This difference means that less entropy of disorder is lost when the chelate complex is formed than when the complex with monodentate ligands is formed. This is one of the factors contributing to the entropy difference. Other factors include solvation changes and ring formation. Some experimental data to illustrate the effect are shown in the following table.[3]
Equilibrium log β \Delta G^{\ominus } {\displaystyle \Delta H^{\ominus }\mathrm {/kJ\ mol^{-1}} } {\displaystyle -T\Delta S^{\ominus }\mathrm {/kJ\ mol^{-1}} }
Cu2+ + 4 MeNH2 ⇌ Cu(MeNH2)42+ 6.55 -37.4 -57.3 19.9
Cu2+ + 2 en ⇌ Cu(en)22+ 10.62 -60.67 -56.48 -4.19
These data confirm that the enthalpy changes are approximately equal for the two reactions and that the main reason for the greater stability of the chelate complex is the entropy term, which is much less unfavorable. In general it is difficult to account precisely for thermodynamic values in terms of changes in solution at the molecular level, but it is clear that the chelate effect is predominantly an effect of entropy.

Other explanations, including that of Schwarzenbach,[4] are discussed in Greenwood and Earnshaw (loc.cit).

In nature

Numerous biomolecules exhibit the ability to dissolve certain metal cations. Thus, proteins, polysaccharides, and polynucleic acids are excellent polydentate ligands for many metal ions. Organic compounds such as the amino acids glutamic acid and histidine, organic diacids such as malate, and polypeptides such as phytochelatin are also typical chelators. In addition to these adventitious chelators, several biomolecules are specifically produced to bind certain metals (see next section).[5][6][7][8]

In biochemistry and microbiology

Virtually all metalloenzymes feature metals that are chelated, usually to peptides or cofactors and prosthetic groups.[8] Such chelating agents include the porphyrin rings in hemoglobin and chlorophyll. Many microbial species produce water-soluble pigments that serve as chelating agents, termed siderophores. For example, species of Pseudomonas are known to secrete pyochelin and pyoverdine that bind iron. Enterobactin, produced by E. coli, is the strongest chelating agent known. The marine mussels use metal chelation esp. Fe3+ chelation with the Dopa residues in mussel foot protein-1 to improve the strength of the threads that it uses to secure itself to surfaces.[9][10][11]

In geology

In earth science, hot chemical weathering is attributed to organic chelating agents (e.g., peptides and sugars) that extract metal ions from minerals and rocks.[12] Some metal complexes in the environment and in nature are not found in some form of chelate ring (e.g., with a humic acid or a protein). Thus, metal chelates are relevant to the mobilization of metals in the soil, the uptake and the accumulation of metals into plants and microorganisms. Selective chelation of heavy metals is relevant to bioremediation (e.g., removal of 137Cs from radioactive waste).[13]

Medical applications

Nutritional supplements

In the 1960s, scientists developed the concept of chelating a metal ion prior to feeding the element to the animal. They believed that this would create a neutral compound, protecting the mineral from being complexed with insoluble salts within the stomach, which would render the metal unavailable for absorption. Amino acids, being effective metal binders, were chosen as the prospective ligands, and research was conducted on the metal-amino acid combinations. The research supported that the metal-amino acid chelates were able to enhance mineral absorption.[citation needed]

During this period, synthetic chelates such as ethylenediaminetetraacetic acid (EDTA) were being developed. These applied the same concept of chelation and did create chelated compounds; but these synthetics were too stable and not nutritionally viable. If the mineral was taken from the EDTA ligand, the ligand could not be used by the body and would be expelled. During the expulsion process the EDTA ligand randomly chelated and stripped another mineral from the body.[14]

According to the Association of American Feed Control Officials (AAFCO), a metal amino acid chelate is defined as the product resulting from the reaction of a metal ion from a soluble metal salt with a mole ratio of one to three (preferably two) moles of amino acids. The average weight of the hydrolyzed amino acids must be approximately 150 and the resulting molecular weight of the chelate must not exceed 800 Da.[citation needed]

Since the early development of these compounds, much more research has been conducted, and has been applied to human nutrition products in a similar manner to the animal nutrition experiments that pioneered the technology. Ferrous bis-glycinate is an example of one of these compounds that has been developed for human nutrition.[15]

Dental and Oral Application

First-Generation Dentin Adhesives were first designed and produced in the 1950s. These systems were based on a co-monomer chelate with calcium on the surface of the tooth and generated very weak water resistance chemical bonding (2-3 MPa).[16]

Heavy-metal detoxification

Chelation therapy is used as antidotes for poisoning by mercury, arsenic, and lead. Chelating agents convert these metal ions into a chemically and biochemically inert form that can be excreted. Chelation using calcium disodium EDTA has been approved by the U.S. Food and Drug Administration (FDA) for serious cases of lead poisoning. It is not approved for treating "heavy metal toxicity".[17]

Although beneficial in cases of serious lead poisoning, use of disodium EDTA (edetate disodium) instead of calcium disodium EDTA has resulted in fatalities due to hypocalcemia.[18] Disodium EDTA is not approved by the FDA for any use,[17] and all FDA-approved chelation therapy products require a prescription.[19]

Pharmaceuticals

Chelate complexes of gadolinium are often used as contrast agents in MRI scans, although iron particle and manganese chelate complexes have also been explored.[20][21] Bifunctional chelate complexes of zirconium, gallium, fluorine, copper, yttrium, bromine, or iodine are often used for conjugation to monoclonal antibodies for use in antibody-based PET imaging.[22] These chelate complexes often employ the usage of hexadentate ligands such as desferrioxamine B (DFO), according to Meijs et al.,[23] and the gadolinium complexes often employ the usage of octadentate ligands such as DTPA, according to Desreux et al.[24] Auranofin, a chelate complex of gold, is used in the treatment of rheumatoid arthritis, and penicillamine, which forms chelate complexes of copper, is used in the treatment of Wilson's disease and cystinuria, as well as refractory rheumatoid arthritis.[25][26]

Other medical applications

Chelation in the intestinal tract is a cause of numerous interactions between drugs and metal ions (also known as "minerals" in nutrition). As examples, antibiotic drugs of the tetracycline and quinolone families are chelators of Fe2+, Ca2+, and Mg2+ ions.[27][28]

EDTA, which binds to calcium, is used to alleviate the hypercalcimia that often results from band keratopathy. The calcium may then be removed from the cornea, allowing for some increase in clarity of vision for the patient.

Metal Chelation can be used as a carcinostatic agent. The anti-cancer drug, which is a metal complex, frees the drug on the cancer site and binds to the virus , which causes the cancer, eliminating it from the body.[29]

Industrial and agricultural applications

Catalysis

Homogeneous catalysts are often chelated complexes. A representative example is the use of BINAP (a bidentate phosphine) in Noyori asymmetric hydrogenation and asymmetric isomerization. The latter has the practical use of manufacture of synthetic (–)-menthol.

Water softening

Citric acid is used to soften water in soaps and laundry detergents. A common synthetic chelator is EDTA. Phosphonates are also well-known chelating agents. Chelators are used in water treatment programs and specifically in steam engineering, e.g., boiler water treatment system: Chelant Water Treatment system. Although the treatment is often referred to as "softening," chelation has little effect on the water's mineral content, other than to make it soluble. What does change is the water's pH level, which is lowered.

Fertilizers

Metal chelate compounds are common components of fertilizers to provide micronutrients. These micronutrients (manganese, iron, zinc, copper) are required for the health of the plants. Most fertilizers contain phosphate salts that, in the absence of chelating agents, typically convert these metal ions into insoluble solids that are of no nutritional value to the plants. EDTA is the typical chelating agent that keeps these metal ions in a soluble form.[30]

Etymology

The ligand forms a chelate complex with the substrate. Chelate complexes are contrasted with coordination complexes composed of monodentate ligands, which form only one bond with the central atom. The word chelation is derived from Greek χηλή, chēlē, meaning "claw"; the ligands lie around the central atom like the claws of a lobster. The term chelate was first applied in 1920 by Sir Gilbert T. Morgan and H. D. K. Drew, who stated: "The adjective chelate, derived from the great claw or chele (Greek) of the lobster or other crustaceans, is suggested for the caliperlike groups which function as two associating units and fasten to the central atom so as to produce heterocyclic rings."[31

Buffer solution

From Wikipedia, the free encyclopedia
 
A buffer solution (more precisely, pH buffer or hydrogen ion buffer) is an aqueous solution consisting of a mixture of a weak acid and its conjugate base, or vice versa. Its pH changes very little when a small amount of strong acid or base is added to it. Buffer solutions are used as a means of keeping pH at a nearly constant value in a wide variety of chemical applications. In nature, there are many systems that use buffering for pH regulation. For example, the bicarbonate buffering system is used to regulate the pH of blood.

Principles of buffering

Simulated titration of an acidified solution of a weak acid (pKa = 4.7) with alkali.
Addition of hydroxide to an equilibrium mixture of a weak acid. HA, and its conjugate base, A

Buffer solutions achieve their resistance to pH change because of the presence of an equilibrium between the acid HA and its conjugate base A.
HA ⇌ H+ + A
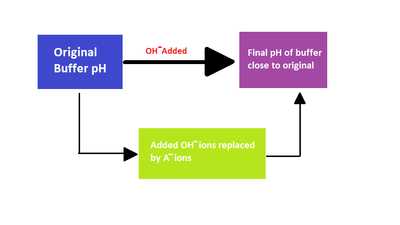
When some strong acid is added to an equilibrium mixture of the weak acid and its conjugate base, the equilibrium is shifted to the left, in accordance with Le Châtelier's principle. Because of this, the hydrogen ion concentration increases by less than the amount expected for the quantity of strong acid added. Similarly, if strong alkali is added to the mixture the hydrogen ion concentration decreases by less than the amount expected for the quantity of alkali added. The effect is illustrated by the simulated titration of a weak acid with pKa = 4.7. The relative concentration of undissociated acid is shown in blue and of its conjugate base in red. The pH changes relatively slowly in the buffer region, pH = pKa ± 1, centered at pH = 4.7 where [HA] = [A]. The hydrogen ion concentration decreases by less than the amount expected because most of the added hydroxide ion is consumed in the reaction
OH + HA → H2O + A
and only a little is consumed in the neutralization reaction which results in an increase in pH.
OH + H+ → H2O
Once the acid is more than 95% deprotonated the pH rises rapidly because most of the added alkali is consumed in the neutralization reaction.

Buffer capacity

Buffer capacity, β, is a quantitative measure of the resistance of a buffer solution to pH change on addition of hydroxide ions. It can be defined as follows.
{\displaystyle \beta ={\frac {dn}{d(\mathrm {pH} )}}},
where dn is an infinitesimal amount of added base and d(p[H+]) is the resulting infinitesimal change in the cologarithm of the hydrogen ion concentration. With this definition the buffer capacity of a weak acid, with a dissociation constant Ka, can be expressed as:
{\displaystyle {\frac {dn}{d(\mathrm {pH} )}}=\ln {10}{\frac {C_{\mathrm {A} }K_{\mathrm {a} }[\mathrm {H^{+}} ]}{\left(K_{\mathrm {a} }+[\mathrm {H^{+}} ]\right)^{2}}}\approx 2.303{\frac {C_{\mathrm {A} }K_{\mathrm {a} }[\mathrm {H^{+}} ]}{\left(K_{\mathrm {a} }+[\mathrm {H^{+}} ]\right)^{2}}}}
Buffer capacity for a 0.1 M solution of an acid with pKa 
of 7

for pH close to the pKa. CA is the analytical concentration of the acid.[1][2] pH is defined as −log10[H+]. For simple buffers there are three regions of raised buffer capacity.
  1. At very low pH the buffer capacity rises exponentially with decreasing pH.
  2. The buffer capacity of a buffering agent is at a local maximum when pH = pKa. It falls to about 33% of the maximum value at pH = pKa ± 1 and to about 12% at pH = pKa ± 1.5. For this reason the useful range is approximately pKa ± 1. Buffer capacity is proportional to the concentration of the buffering agent, CA, so dilute solutions have little buffer capacity.
  3. At very high pH the buffer capacity rises exponentially with increasing pH.
Properties 1 and 3 are independent of the presence or absence of added buffering agents. They are concentration effects and reflect the fact that pH is related to the logarithm of the hydrogen ion concentration.

Applications

Buffer solutions are necessary to keep the correct pH for enzymes in many organisms to work. Many enzymes work only under very precise conditions; if the pH moves outside of a narrow range, the enzymes slow or stop working and can denature. In many cases denaturation can permanently disable their catalytic activity.[3] A buffer of carbonic acid (H
2
CO
3
) and bicarbonate (HCO
3
) is present in blood plasma, maintaining a pH between 7.35 and 7.45.

Industrially, buffer solutions are used in fermentation processes and in setting the correct conditions for dyes used in colouring fabrics. They are also used in chemical analysis[2] and calibration of pH meters.

The majority of biological samples that are used in research are made in buffers, especially phosphate buffered saline (PBS) at pH 7.4.

Simple buffering agents

Buffering agent pKa Useful pH range
Citric acid 3.13, 4.76, 6.40 2.1–7.4
Acetic acid 4.8 3.8–5.8
KH2PO4 7.2 6.2–8.2
CHES 9.3 8.3–10.3
Borate 9.24 8.25–10.25
For buffers in acid regions, the pH may be adjusted to a desired value by adding a strong acid such as hydrochloric acid to the buffering agent. For alkaline buffers, a strong base such as sodium hydroxide may be added. Alternatively, a buffer mixture can be made from a mixture of an acid and its conjugate base. For example, an acetate buffer can be made from a mixture of acetic acid and sodium acetate. Similarly an alkaline buffer can be made from a mixture of the base and its conjugate acid.

"Universal" buffer mixtures

By combining substances with pKa values differing by only two or less and adjusting the pH, a wide range of buffers can be obtained. Citric acid is a useful component of a buffer mixture because it has three pKa values, separated by less than two. The buffer range can be extended by adding other buffering agents. The following mixtures (McIlvaine's buffer solutions) have a buffer range of pH 3 to 8.[4]
0.2 M Na2HPO4 (mL) 0.1 M citric acid (mL) pH
20.55 79.45 3.0
38.55 61.45 4.0
51.50 48.50 5.0
63.15 36.85 6.0
82.35 17.65 7.0
97.25 2.75 8.0
A mixture containing citric acid, monopotassium phosphate, boric acid, and diethyl barbituric acid can be made to cover the pH range 2.6 to 12.[5]

Other universal buffers are the Carmody buffer[6] and the Britton–Robinson buffer, developed in 1931.

Common buffer compounds used in biology


Common name Structure pKa
at 25 °C
Temp. effect
dpH/dT (K−1)[7]
Mol.
weight
TAPS TAPS.svg 8.43 −0.018 243.3
Bicine Bicine.png 8.35 −0.018 163.2
Tris Tris.png 8.07* −0.028 121.14
Tricine Tricine.png 8.05 −0.021 179.2
TAPSO TAPSO.svg 7.635
259.3
HEPES HEPES.png 7.48 −0.014 238.3
TES TES free acid.svg 7.40 −0.020 229.20
MOPS MOPS.png 7.20 −0.015 209.3
PIPES PIPES.svg 6.76 −0.008 302.4
Cacodylate Cacodylic acid.svg 6.27
138.0
MES MES.svg 6.15 −0.011 195.2
(*) Tris is a base, the pKa of 8.07 refers to its conjugate acid.

Calculating buffer pH

Monoprotic acids

First write down the equilibrium expression.
HA ⇌ A + H+
This shows that when the acid dissociates equal amounts of hydrogen ion and anion are produced. The equilibrium concentrations of these three components can be calculated in an ICE table.
ICE table for a monoprotic acid

[HA] [A] [H+]
I C0 0 y
C x x x
E C0x x x + y
The first row, labelled I, lists the initial conditions: the concentration of acid is C0, initially undissociated, so the concentrations of A and H+ would be zero; y is the initial concentration of added strong acid, such as hydrochloric acid. If strong alkali, such as sodium hydroxide, is added y will have a negative sign because alkali removes hydrogen ions from the solution. The second row, labelled C for change, specifies the changes that occur when the acid dissociates. The acid concentration decreases by an amount −x and the concentrations of A and H+ both increase by an amount +x. This follows from the equilibrium expression. The third row, labelled E for equilibrium concentrations, adds together the first two rows and shows the concentrations at equilibrium.

To find x, use the formula for the equilibrium constant in terms of concentrations:
{\displaystyle K_{\mathrm {a} }={\frac {[\mathrm {H^{+}} ][\mathrm {A^{-}} ]}{[\mathrm {HA} ]}}}
Substitute the concentrations with the values found in the last row of the ICE table:
{\displaystyle K_{\mathrm {a} }={\frac {x(x+y)}{C_{0}-x}}}
Simplify to:
{\displaystyle x^{2}+(K_{\mathrm {a} }+y)x-K_{\mathrm {a} }C_{0}=0}
With specific values for C0, Ka and y this equation can be solved for x. Assuming that pH = −log10[H+] the pH can be calculated as pH = −log10(x + y).

Polyprotic acids

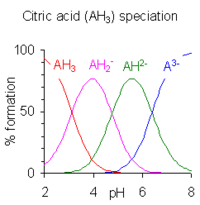
This image plots the relative percentages of the protonation species of citric acid as a function of p H. Citric acid has three ionizable hydrogen atoms and thus three p K A values. Below the lowest p K A, the triply protonated species prevails; between the lowest and middle p K A, the doubly protonated form prevails; between the middle and highest p K A, the singly protonated form prevails; and above the highest p K A, the unprotonated form of citric acid is predominant.
% species formation calculated for a 10 millimolar solution of citric acid.

Polyprotic acids are acids that can lose more than one proton. The constant for dissociation of the first proton may be denoted as Ka1 and the constants for dissociation of successive protons as Ka2, etc. Citric acid, H3A, is an example of a polyprotic acid as it can lose three protons.
Equilibrium pKa value
H3A ⇌ H2A + H+ pKa1 = 3.13
H2A ⇌ HA2− + H+ pKa2 = 4.76
HA2− ⇌ A3− + H+ pKa3 = 6.40
When the difference between successive pKa values is less than about three there is overlap between the pH range of existence of the species in equilibrium. The smaller the difference, the more the overlap. In the case of citric acid, the overlap is extensive and solutions of citric acid are buffered over the whole range of pH 2.5 to 7.5.

Calculation of the pH with a polyprotic acid requires a speciation calculation to be performed. In the case of citric acid, this entails the solution of the two equations of mass balance
{\displaystyle {\begin{aligned}C_{{\ce {A}}}&=[{\ce {A^3-}}]+\beta _{1}[{\ce {A^3-}}][{\ce {H+}}]+\beta _{2}[{\ce {A^3-}}][{\ce {H+}}]^{2}+\beta _{3}[{\ce {A^3-}}][{\ce {H+}}]^{3}\\C_{{\ce {H}}}&=[{\ce {H+}}]+\beta _{1}[{\ce {A^3-}}][{\ce {H+}}]+2\beta _{2}[{\ce {A^3-}}][{\ce {H+}}]^{2}+3\beta _{3}[{\ce {A^3-}}][{\ce {H+}}]^{3}-K_{{\ce {w}}}[{\ce {H+}}]^{-1}\end{aligned}}}
CA is the analytical concentration of the acid, CH is the analytical concentration of added hydrogen ions, βq are the cumulative association constants
{\displaystyle \log \beta _{1}={\ce {p}}K_{{\ce {a3}}},\quad \log \beta _{2}={\ce {p}}K_{{\ce {a2}}}+{\ce {p}}K_{{\ce {a3}}},\quad \log \beta _{3}={\ce {p}}K_{{\ce {a1}}}+{\ce {p}}K_{{\ce {a2}}}+{\ce {p}}K_{{\ce {a3}}}}
Kw is the constant for self-ionization of water. There are two non-linear simultaneous equations in two unknown quantities [A3−] and [H+]. Many computer programs are available to do this calculation. The speciation diagram for citric acid was produced with the program HySS.[8]

Software framework

From Wikipedia, the free encyclopedia ...