Search This Blog

Wednesday, October 7, 2015

El Niño Southern Oscillation


From Wikipedia, the free encyclopedia


Southern Oscillation Index timeseries 1876–2012.

El Niño Southern Oscillation (ENSO) is an irregularly periodical climate change caused by variations in sea surface temperatures over the tropical eastern Pacific Ocean, affecting much of the tropics and subtropics. The warming phase is known as El Niño and the cooling phase as La Niña. The two variations are coupled: El Niño is accompanied with high, and La Niña with low air surface pressure in the tropical western Pacific.[1][2] The two periods last several years each (typically three to four) and their effects vary in intensity.[3]

The two phases relate to the Walker circulation, discovered by Gilbert Walker during the early twentieth century. The Walker circulation is caused by the pressure gradient force that results from a high pressure system over the eastern Pacific ocean, and a low pressure system over Indonesia. When the Walker circulation weakens or reverses, an El Niño results, causing the ocean surface to be warmer than average, as upwelling of cold water occurs less or not at all. An especially strong Walker circulation causes a La Niña, resulting in cooler ocean temperatures due to increased upwelling.

Mechanisms that cause the oscillation remain under study. The extremes of this climate pattern's oscillations cause extreme weather (such as floods and droughts) in many regions of the world. Developing countries dependent upon agriculture and fishing, particularly those bordering the Pacific Ocean, are the most affected.

Gilbert Walker
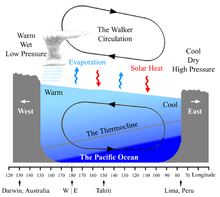

Diagram of the quasi-equilibrium and La Niña phase of the Southern Oscillation. The Walker circulation is seen at the surface as easterly trade winds which move water and air warmed by the sun towards the west. The western side of the equatorial Pacific is characterized by warm, wet low pressure weather as the collected moisture is dumped in the form of typhoons and thunderstorms. The ocean is some 60 centimetres (24 in) higher in the western Pacific as the result of this motion. The water and air are returned to the east. Both are now much cooler, and the air is much drier. An El Niño episode is characterised by a breakdown of this water and air cycle, resulting in relatively warm water and moist air in the eastern Pacific.

Gilbert Walker was an established applied mathematician at the University of Cambridge when he became director-general of observatories in India in 1904.[4] While there, he studied the characteristics of the Indian Ocean monsoon, the failure of whose rains had brought severe famine to the country in 1899. Analyzing vast amounts of weather data from India and lands beyond, over the next fifteen years he published the first descriptions of the great seesaw oscillation of atmospheric pressure between the Indian and Pacific Ocean, and its correlation to temperature and rainfall patterns across much of the Earth's tropical regions, including India. He also worked with the Indian Meteorological Department especially in linking the monsoon with Southern Oscillation phenomenon. He was made a Companion of the Order of the Star of India in 1911.[4]

Southern Oscillation


Normal Pacific pattern: Equatorial winds gather warm water pool toward the west. Cold water upwells along South American coast. (NOAA / PMEL / TAO)

The Southern Oscillation is the atmospheric component of El Niño. This component is an oscillation in surface air pressure between the tropical eastern and the western Pacific Ocean waters. The strength of the Southern Oscillation is measured by the Southern Oscillation Index (SOI). The SOI is computed from fluctuations in the surface air pressure difference between Tahiti (in the Pacific) and Darwin, Australia (on the Indian Ocean).[5]
  • El Niño episodes have negative SOI, meaning there is lower pressure over Tahiti and higher pressure in Darwin.
  • La Niña episodes have positive SOI, meaning there is higher pressure in Tahiti and lower in Darwin.
Low atmospheric pressure tends to occur over warm water and high pressure occurs over cold water, in part because of deep convection over the warm water. El Niño episodes are defined as sustained warming of the central and eastern tropical Pacific Ocean, thus resulting in a decrease in the strength of the Pacific trade winds, and a reduction in rainfall over eastern and northern Australia. La Niña episodes are defined as sustained cooling of the central and eastern tropical Pacific Ocean, thus resulting in an increase in the strength of the Pacific trade winds, and the opposite effects in Australia when compared to El Niño.

El Niño conditions: Warm water pool approaches the South American coast. The absence of cold upwelling increases warming.

La Niña conditions: Warm water is farther west than usual.

Although the Southern Oscillation Index has a long station record going back to the 1800s, its reliability is limited due to the presence of both Darwin and Tahiti well south of the Equator, resulting in the surface air pressure at both locations being less directly related to ENSO.[6] To overcome this question, a new index was created, being named Equatorial Southern Oscillation Index (EQSOI).[6][6] To generate this index data, two new regions, centered on the Equator, were delimited to create a new index: The western one is located over Indonesia and the eastern one is located over equatorial Pacific, close to the South American coast.[6] However, data on EQSOI goes back only to 1949.[6]

Walker circulation

The Walker circulation is caused by the pressure gradient force that results from a high pressure system over the eastern Pacific ocean, and a low pressure system over Indonesia. The Walker Circulations of the tropical Indian, Pacific, and Atlantic basins result in westerly surface winds in Northern Summer in the first basin and easterly winds in the second and third basins. As a result the temperature structure of the three oceans display dramatic asymmetries. The equatorial Pacific and Atlantic both have cool surface temperatures in Northern Summer in the east, while cooler surface temperatures prevail only in the western Indian Ocean.[7] These changes in surface temperature reflect changes in the depth of the thermocline.[8]
Changes in the Walker Circulation with time occur in conjunction with changes in surface temperature. Some of these changes are forced externally, such as the seasonal shift of the Sun into the Northern Hemisphere in summer. Other changes appear to be the result of coupled ocean-atmosphere feedback in which, for example, easterly winds cause the sea surface temperature to fall in the east, enhancing the zonal heat contrast and hence intensifying easterly winds across the basin. These anomalous easterlies induce more equatorial upwelling and raise the thermocline in the east, amplifying the initial cooling by the southerlies. This coupled ocean-atmosphere feedback was originally proposed by Bjerknes. From an oceanographic point of view, the equatorial cold tongue is caused by easterly winds. Were the earth climate symmetric about the equator, cross-equatorial wind would vanish, and the cold tongue would be much weaker and have a very different zonal structure than is observed today.[9]

During non-El Niño conditions, the Walker circulation is seen at the surface as easterly trade winds that move water and air warmed by the sun toward the west. This also creates ocean upwelling off the coasts of Peru and Ecuador and brings nutrient-rich cold water to the surface, increasing fishing stocks.[10] The western side of the equatorial Pacific is characterized by warm, wet, low-pressure weather as the collected moisture is dumped in the form of typhoons and thunderstorms. The ocean is some 60 cm (24 in) higher in the western Pacific as the result of this motion.[11][12][13][14]

Madden–Julian oscillation

A Hovmöller diagram of the 5-day running mean of outgoing longwave radiation showing the MJO. Time increases from top to bottom in the figure, so contours that are oriented from upper-left to lower-right represent movement from west to east.

The Madden–Julian oscillation, or (MJO), is the largest element of the intraseasonal (30–90 day) variability in the tropical atmosphere, and was discovered by Roland Madden and Paul Julian of the National Center for Atmospheric Research (NCAR) in 1971. It is a large-scale coupling between atmospheric circulation and tropical deep convection.[15][16] Rather than being a standing pattern like the El Niño Southern Oscillation (ENSO), the MJO is a traveling pattern that propagates eastward at approximately 4 to 8 m/s (9 to 18 mph), through the atmosphere above the warm parts of the Indian and Pacific oceans. This overall circulation pattern manifests itself in various ways, most clearly as anomalous rainfall. The wet phase of enhanced convection and precipitation is followed by a dry phase where thunderstorm activity is suppressed. Each cycle lasts approximately 30–60 days.[17] Because of this pattern, The MJO is also known as the 30–60 day oscillation, 30–60 day wave, or intraseasonal oscillation.

There is strong year-to-year (interannual) variability in MJO activity, with long periods of strong activity followed by periods in which the oscillation is weak or absent. This interannual variability of the MJO is partly linked to the El Niño-Southern Oscillation (ENSO) cycle. In the Pacific, strong MJO activity is often observed 6 – 12 months prior to the onset of an El Niño episode, but is virtually absent during the maxima of some El Niño episodes, while MJO activity is typically greater during a La Niña episode. Strong events in the Madden–Julian oscillation over a series of months in the western Pacific can speed the development of an El Niño or La Niña but usually do not in themselves lead to the onset of a warm or cold ENSO event.[18] However, observations suggest that the 1982-1983 El Niño developed rapidly during July 1982 in direct response to a Kelvin wave triggered by an MJO event during late May.[19] Further, changes in the structure of the MJO with the seasonal cycle and ENSO might facilitate more substantial impacts of the MJO on ENSO. For example, the surface westerly winds associated with active MJO convection are stronger during advancement toward El Niño and the surface easterly winds associated with the suppressed convective phase are stronger during advancement toward La Nina.[20]

How the phase is determined


The various "Niño regions" where sea surface temperatures are monitored to determine the current ENSO phase (warm or cold)

Within the National Oceanic and Atmospheric Administration in the United States, sea surface temperatures in the Niño 3.4 region, which stretches from the 120th to 150th meridians west longitude astride the equator five degrees of latitude on either side, is monitored. This region is approximately 3,000 kilometres (1,900 mi) to the southeast of Hawaii. The most recent three-month average for the area is computed, and if the region is more than 0.5 °C (0.9 °F) above (or below) normal for that period, then an El Niño (or La Niña) is considered in progress.[21] The United Kingdom's MetOffice also uses a several month period to determine ENSO state.[22] When this warming or cooling occurs for only seven to nine months, it is classified as El Niño/La Niña "conditions"; when it occurs for more than that period, it is classified as El Niño/La Niña "episodes".[23]

Neutral phase


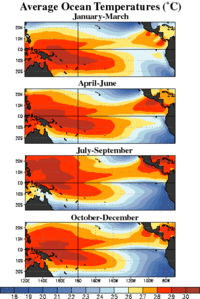
Average equatorial Pacific temperatures

If the temperature variation from climatology is within 0.5 °C (0.9 °F), ENSO conditions are described as neutral. Neutral conditions are the transition between warm and cold phases of ENSO. Ocean temperatures (by definition), tropical precipitation, and wind patterns are near average conditions during this phase.[24] Close to half of all years are within neutral periods.[25] During the neutral ENSO phase, other climate anomalies/patterns such as the sign of the North Atlantic Oscillation or the Pacific–North American teleconnection pattern exert more influence.[26]

The 1997 El Niño observed by TOPEX/Poseidon

Warm phase

When the Walker circulation weakens or reverses and the Hadley circulation strengthens an El Niño results,[27] causing the ocean surface to be warmer than average, as upwelling of cold water occurs less or not at all offshore northwestern South America. El Niño (/ɛlˈnnj/, /-ˈnɪn-/, Spanish pronunciation: [el ˈniɲo]) is associated with a band of warmer than average ocean water temperatures that periodically develops off the Pacific coast of South America. El niño is Spanish for "the boy", and the capitalized term El Niño refers to the Christ child, Jesus, because periodic warming in the Pacific near South America is usually noticed around Christmas.[28] It is a phase of 'El Niño–Southern Oscillation' (ENSO), which refers to variations in the temperature of the surface of the tropical eastern Pacific Ocean and in air surface pressure in the tropical western Pacific. The warm oceanic phase, El Niño, accompanies high air surface pressure in the western Pacific.[1][29] Mechanisms that cause the oscillation remain under study.

Cold phase

An especially strong Walker circulation causes a La Niña, resulting in cooler ocean temperatures due to increased upwelling. La Niña (/lɑːˈnnjə/, Spanish pronunciation: [la ˈniɲa]) is a coupled ocean-atmosphere phenomenon that is the counterpart of El Niño as part of the broader El Niño Southern Oscillation climate pattern. The name La Niña originates from Spanish, meaning "the girl", analogous to El Niño meaning "the boy". It has also in the past been called anti-El Niño, and El Viejo (meaning "the old man").[30] During a period of La Niña, the sea surface temperature across the equatorial eastern central Pacific will be lower than normal by 3–5 °C. In the United States, an appearance of La Niña happens for at least five months of La Niña conditions. La Niña, sometimes informally called "anti-El Niño", is the opposite of El Niño, with a sea surface temperature anomaly of at least 0.5 °C (0.9 °F) below normal and its effects are often the reverse of those of El Niño.

Impacts

On precipitation


Regional impacts of La Niña.

Developing countries dependent upon agriculture and fishing, particularly those bordering the Pacific Ocean, are the most affected by ENSO. The effects of El Niño in South America are direct and strong. An El Niño is associated with warm and very wet weather months in April–October along the coasts of northern Peru and Ecuador, causing major flooding whenever the event is strong or extreme.[31] La Niña causes a drop in sea surface temperatures over Southeast Asia and heavy rains over Malaysia, the Philippines, and Indonesia.[32]

To the north across Alaska, La Niña events lead to drier than normal conditions, while El Niño events do not have a correlation towards dry or wet conditions. During El Niño events, increased precipitation is expected in California due to a more southerly, zonal, storm track.[33] During La Niña, increased precipitation is diverted into the Pacific Northwest due to a more northerly storm track.[34] During La Niña events, the storm track shifts far enough northward to bring wetter than normal winter conditions (in the form of increased snowfall) to the Midwestern states, as well as hot and dry summers.[35] During the El Niño portion of ENSO, increased precipitation falls along the Gulf coast and Southeast due to a stronger than normal, and more southerly, polar jet stream.[36] In the late winter and spring during El Niño events, drier than average conditions can be expected in Hawaii.[37] On Guam during El Niño years, dry season precipitation averages below normal. However, the threat of a tropical cyclone is over triple what is normal during El Niño years, so extreme shorter duration rainfall events are possible.[38] On American Samoa during El Niño events, precipitation averages about 10 percent above normal, while La Niña events lead to precipitation amounts which average close to 10 percent below normal.[39] ENSO is linked to rainfall over Puerto Rico.[40] During an El Niño, snowfall is greater than average across the southern Rockies and Sierra Nevada mountain range, and is well-below normal across the Upper Midwest and Great Lakes states. During a La Niña, snowfall is above normal across the Pacific Northwest and western Great Lakes.[41]

On Tehuantepecers

The synoptic condition for the Tehuantepecer, a violent mountain-gap wind in between the mountains of Mexico and Guatemala, is associated with high-pressure system forming in Sierra Madre of Mexico in the wake of an advancing cold front, which causes winds to accelerate through the Isthmus of Tehuantepec. Tehuantepecers primarily occur during the cold season months for the region in the wake of cold fronts, between October and February, with a summer maximum in July caused by the westward extension of the Azores-Bermuda high pressure system. Wind magnitude is greater during El Niño years than during La Niña years, due to the more frequent cold frontal incursions during El Niño winters.[42] Tehuantepec winds reach 20 knots (40 km/h) to 45 knots (80 km/h), and on rare occasions 100 knots (200 km/h). The wind’s direction is from the north to north-northeast.[43] It leads to a localized acceleration of the trade winds in the region, and can enhance thunderstorm activity when it interacts with the Intertropical Convergence Zone.[44] The effects can last from a few hours to six days.[45]

On global warming


NOAA graph of Global Annual Temperature Anomalies 1950–2012, showing ENSO

During the last several decades, the number of El Niño events increased, and the number of La Niña events decreased,[46] although observation of ENSO for much longer is needed to detect robust changes.[47] The question is whether this is a random fluctuation or a normal instance of variation for that phenomenon or the result of global climate changes toward global warming.

The studies of historical data show the recent El Niño variation is most likely linked to global warming. For example, one of the most recent results, even after subtracting the positive influence of decadal variation, is shown to be possibly present in the ENSO trend,[48] the amplitude of the ENSO variability in the observed data still increases, by as much as 60% in the last 50 years.[49]

The exact changes happening to ENSO in the future is uncertain:[50] Different models make different predictions.[51][52] It may be that the observed phenomenon of more frequent and stronger El Niño events occurs only in the initial phase of the global warming, and then (e.g., after the lower layers of the ocean get warmer, as well), El Niño will become weaker than it was.[53] It may also be that the stabilizing and destabilizing forces influencing the phenomenon will eventually compensate for each other.[54] More research is needed to provide a better answer to that question. The ENSO is considered to be a potential tipping element in Earth's climate.[55]

ENSO diversity

The traditional ENSO (El Niño Southern Oscillation), also called Eastern Pacific (EP) ENSO,[56] involves temperature anomalies in the eastern pacific. However, in the 1990s and 2000s, nontraditional ENSO conditions were observed, in which the usual place of the temperature anomaly (Niño 1 and 2) is not affected, but an anomaly arises in the central Pacific (Niño 3.4).[57] The phenomenon is called Central Pacific (CP) ENSO,[56] "dateline" ENSO (because the anomaly arises near the dateline), or ENSO "Modoki" (Modoki is Japanese for "similar, but different").[58][59] There are flavors of ENSO additional to EP and CP types and some scientists argue that ENSO exists as a continuum often with hybrid types.[60]

The effects of the CP ENSO are different from those of the traditional EP ENSO. The El Niño Modoki leads to more hurricanes more frequently making landfall in the Atlantic.[61] La Niña Modoki leads to a rainfall increase over northwestern Australia and northern Murray-Darling basin, rather than over the east as in a conventional La Niña.[59] Also, La Niña Modoki increases the frequency of cyclonic storms over Bay of Bengal, but decreases the occurrence of severe storms in the Indian Ocean.[62]

The recent discovery of ENSO Modoki has some scientists believing it to be linked to global warming.[63] However, comprehensive satellite data go back only to 1979. More research must be done to find the correlation and study past El Niño episodes. More generally, there is no scientific consensus on how/if climate change may affect ENSO.[50]

There is also a scientific debate on the very existence of this "new" ENSO. Indeed, a number of studies dispute the reality of this statistical distinction or its increasing occurrence, or both, either arguing the reliable record is too short to detect such a distinction,[64][65] finding no distinction or trend using other statistical approaches,[66][67][68][69][70] or that other types should be distinguished, such as standard and extreme ENSO.[71][72] Following the asymmetric nature of the warm and cold phases of ENSO, some studies could not identify such distinctions for La Niña, both in observations and in the climate models,[73] but some sources indicate that there is a variation on La Niña with cooler waters on central Pacific and average or warmer water temperatures on both eastern and western Pacific, also showing eastern Pacific ocean currents going to the opposite direction compared to the currents in traditional La Niñas.[58][74][75]

Fresnel equations


From Wikipedia, the free encyclopedia


Partial transmission and reflection amplitudes of a wave travelling from a low to high refractive index medium.

The Fresnel equations (or Fresnel conditions), deduced by Augustin-Jean Fresnel /frɛˈnɛl/, describe the behaviour of light when moving between media of differing refractive indices. The reflection of light that the equations predict is known as Fresnel reflection.

Overview

When light moves from a medium of a given refractive index n1 into a second medium with refractive index n2, both reflection and refraction of the light may occur. The Fresnel equations describe what fraction of the light is reflected and what fraction is refracted (i.e., transmitted). They also describe the phase shift of the reflected light.
The equations assume the interface between the media is flat and that the media are homogeneous. The incident light is assumed to be a plane wave, and effects of edges are neglected.

S and p polarizations

The calculations below depend on polarisation of the incident ray. Two cases are analyzed:
  1. The incident light is polarized with its electric field perpendicular to the plane containing the incident, reflected, and refracted rays. This plane is called the plane of incidence; it is the plane of the diagram below. The light is said to be s-polarized, from the German senkrecht (perpendicular).
  2. The incident light is polarized with its electric field parallel to the plane of incidence. Such light is described as p-polarized, from parallel.

Power or intensity equations


Variables used in the Fresnel equations.

In the diagram on the right, an incident light ray IO strikes the interface between two media of refractive indices n1 and n2 at point O. Part of the ray is reflected as ray OR and part refracted as ray OT. The angles that the incident, reflected and refracted rays make to the normal of the interface are given as θi, θr and θt, respectively.

The relationship between these angles is given by the law of reflection:
\theta_\mathrm{i} = \theta_\mathrm{r},
and Snell's law:
n_1 \sin \theta_\mathrm{i} = n_2 \sin \theta_\mathrm{t}.
The fraction of the incident power that is reflected from the interface is given by the reflectance or reflectivity R and the fraction that is refracted is given by the transmittance or transmissivity T (unrelated to the transmission through a medium).[1]

The reflectance for s-polarized light is
R_\mathrm{s} = \left|\frac{Z_2 \cos \theta_{\mathrm{i}} - Z_1 \cos \theta_{\mathrm{t}}}{Z_2 \cos \theta_{\mathrm{i}} + Z_1 \cos \theta_{\mathrm{t}}}\right|^2 = \left|\frac{\sqrt{\frac{\mu_2}{\epsilon_2}} \cos \theta_{\mathrm{i}} - \sqrt{\frac{\mu_1}{\epsilon_1}} \cos \theta_{\mathrm{t}}}{ \sqrt{\frac{\mu_2}{\epsilon_2}} \cos \theta_{\mathrm{i}} + \sqrt{\frac{\mu_1}{\epsilon_1}} \cos \theta_{\mathrm{t}}}\right|^2,
while the reflectance for p-polarized light is
R_\mathrm{p} = \left|\frac{Z_2 \cos \theta_{\mathrm{t}} - Z_1 \cos \theta_{\mathrm{i}}}{Z_2 \cos \theta_{\mathrm{t}} + Z_1 \cos \theta_{\mathrm{i}}}\right|^2 = \left|\frac{\sqrt{\frac{\mu_2}{\epsilon_2}} \cos \theta_{\mathrm{t}} - \sqrt{\frac{\mu_1}{\epsilon_1}} \cos \theta_{\mathrm{i}}}{ \sqrt{\frac{\mu_2}{\epsilon_2}} \cos \theta_{\mathrm{t}} + \sqrt{\frac{\mu_1}{\epsilon_1}} \cos \theta_{\mathrm{i}}}\right|^2,
where Z1 and Z2 are the wave impedances of media 1 and 2, respectively.

For non-magnetic media, we have μ1 = μ2 = μ0, so that
Z_1=\frac{Z_0}{n_1},\ Z_2=\frac{Z_0}{n_2}.
Then, the reflectance for s-polarized light becomes
R_\mathrm{s} = \left|\frac{n_1 \cos \theta_{\mathrm{i}} - n_2 \cos \theta_{\mathrm{t}}}{n_1 \cos \theta_{\mathrm{i}} + n_2 \cos \theta_{\mathrm{t}}}\right|^2 = \left|\frac{n_1 \cos \theta_{\mathrm{i}} - n_2 \sqrt{1-\left(\frac{n_1}{n_2} \sin \theta_{\mathrm{i}}\right)^2}}{n_1 \cos \theta_{\mathrm{i}} + n_2 \sqrt{1 - \left(\frac{n_1}{n_2} \sin \theta_{\mathrm{i}}\right)^2}}\right|^2\!,
while the reflectance for p-polarized light becomes
R_\mathrm{p} = \left|\frac{n_1\cos\theta_{\mathrm{t}} - n_2 \cos \theta_{\mathrm{i}}}{n_1 \cos \theta_{\mathrm{t}} + n_2 \cos \theta_{\mathrm{i}}}\right|^2 = \left|\frac{n_1\sqrt{1 - \left(\frac{n_1}{n_2} \sin \theta_{\mathrm{i}}\right)^2} - n_2 \cos \theta_{\mathrm{i}}}{n_1 \sqrt{1 - \left(\frac{n_1}{n_2} \sin \theta_{\mathrm{i}}\right)^2} + n_2 \cos \theta_{\mathrm{i}}}\right|^2\!.
The second form of each equation is derived from the first by eliminating θt using Snell's law and trigonometric identities.

As a consequence of the conservation of energy, the transmittances are given by[2]
T_\mathrm{s} = 1 - R_\mathrm{s}
and
T_\mathrm{p} = 1 - R_\mathrm{p}
These relationships hold only for power or intensity, not for complex amplitude transmission and reflection coefficients as defined below.

If the incident light is unpolarised (containing an equal mix of s- and p-polarisations), the reflectance is
R = \frac{R_\mathrm{s} + R_\mathrm{p}}{2}.
For common glass, with n2 around 1.5, the reflectance at θi = 0 is about 4%. Note that reflection by a window is from the front side as well as the back side, and that some of the light bounces back and forth a number of times between the two sides. The combined reflectance for this case is 2R/(1 + R), when interference can be neglected (see below).

The discussion given here assumes that the permeability μ is equal to the vacuum permeability μ0 in both media, embodying the assumption that the material is non-magnetic. This is approximately true for most dielectric materials, but not for some other types of material. The completely general Fresnel equations are more complicated.
Fresnel reflection.svg
For low-precision applications where polarization may be ignored, such as computer graphics, Schlick's approximation may be used.

Special angles

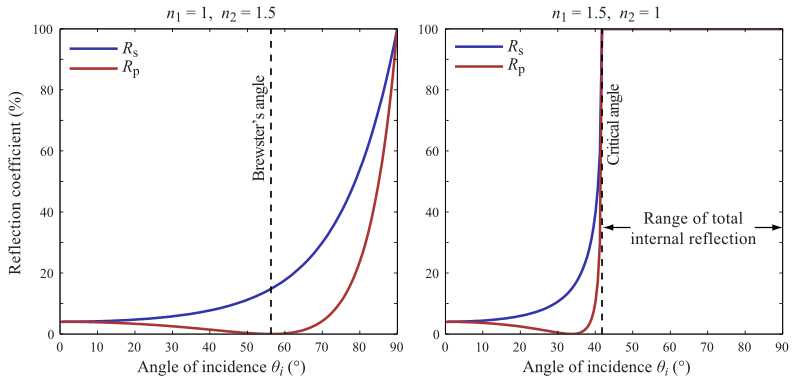
At one particular angle for a given n1 and n2, the value of Rp goes to zero and a p-polarised incident ray is purely refracted. This angle is known as Brewster's angle, and is around 56° for a glass medium in air or vacuum. Note that this statement is only true when the refractive indices of both materials are real numbers, as is the case for materials like air and glass. For materials that absorb light, like metals and semiconductors, n is complex, and Rp does not generally go to zero.

When moving from a denser medium into a less dense one (i.e., n1 > n2), above an incidence angle known as the critical angle, all light is reflected and Rs = Rp =1. This phenomenon is known as total internal reflection. The critical angle is approximately 41° for glass in air.

Amplitude or field equations

Equations for coefficients corresponding to ratios of the electric field complex-valued amplitudes of the waves (not necessarily real-valued magnitudes) are also called "Fresnel equations". These take several different forms, depending on the choice of formalism and sign convention used. The amplitude coefficients are usually represented by lower case r and t.


Amplitude ratios: air to glass

Amplitude ratios: glass to air

Conventions used here

In this treatment, the coefficient r is the ratio of the reflected wave's complex electric field amplitude to that of the incident wave. The coefficient t is the ratio of the transmitted wave's electric field amplitude to that of the incident wave. The light is split into s and p polarizations as defined above. (In the figures to the right, s polarization is denoted "\bot" and p is denoted "\parallel".)

For s-polarization, a positive r or t means that the electric fields of the incoming and reflected or transmitted wave are parallel, while negative means anti-parallel. For p-polarization, a positive r or t means that the magnetic fields of the waves are parallel, while negative means anti-parallel.[3] It is also assumed that the magnetic permeability µ of both media is equal to the permeability of free space µ0.

(Be aware that some authors say instead use the opposite sign convention for rp, so that rp is positive when the incoming and reflected magnetic fields are antiparallel, and negative when they are parallel. This latter convention has the convenient advantage that the s- and p- sign conventions are the same at normal incidence. However, either convention, when used consistently, gives the right answers.)

Formulas

Using the arbitrary sign conventions above,[3]
r_\mathrm{s} = \frac{n_1 \cos \theta_\mathrm{i} - n_2 \cos \theta_\mathrm{t}}{n_1 \cos \theta_\mathrm{i} + n_2 \cos \theta_\mathrm{t}},
t_\mathrm{s} = \frac{2 n_1 \cos \theta_\mathrm{i}}{n_1 \cos \theta_\mathrm{i} + n_2 \cos \theta_\mathrm{t}},
r_\mathrm{p} = \frac{n_2 \cos \theta_\mathrm{i} - n_1 \cos \theta_\mathrm{t}}{n_1 \cos \theta_\mathrm{t} + n_2 \cos \theta_\mathrm{i}},
t_\mathrm{p} = \frac{2 n_1 \cos \theta_\mathrm{i}}{n_1 \cos \theta_\mathrm{t} + n_2 \cos \theta_\mathrm{i}}.
Notice that ts = 1 + rs but tp ≠ 1 + rp.[4]

Because the reflected and incident waves propagate in the same medium and make the same angle with the normal to the surface, the amplitude reflection coefficient is related to the reflectance R by [5]
R = |r|^2.
The transmittance T is generally not equal to |t|2, since the light travels with different direction and speed in the two media. The transmittance is related to t by:[6]
T = \frac{n_2 \cos \theta_\mathrm{t}}{n_1 \cos \theta_\mathrm{i}} |t|^2.
The factor of n2/n1 occurs from the ratio of intensities (closely related to irradiance). The factor of cos θt/cos θi represents the change in area m of the pencil of rays, needed since T, the ratio of powers, is equal to the ratio of (intensity × area). In terms of the ratio of refractive indices,
\rho = \frac{n_2}{n_1},
and of the magnification m of the beam cross section occurring at the interface,
T = \rho m |t|^2.

Multiple surfaces

When light makes multiple reflections between two or more parallel surfaces, the multiple beams of light generally interfere with one another, resulting in net transmission and reflection amplitudes that depend on the light's wavelength. The interference, however, is seen only when the surfaces are at distances comparable to or smaller than the light's coherence length, which for ordinary white light is few micrometers; it can be much larger for light from a laser.

An example of interference between reflections is the iridescent colours seen in a soap bubble or in thin oil films on water. Applications include Fabry–Pérot interferometers, antireflection coatings, and optical filters. A quantitative analysis of these effects is based on the Fresnel equations, but with additional calculations to account for interference.

The transfer-matrix method, or the recursive Rouard method[7] can be used to solve multiple-surface problems.

Albedo


From Wikipedia, the free encyclopedia


Percentage of diffusely reflected sunlight in relation to various surface conditions

Albedo (/ælˈbd/), or reflection coefficient, derived from Latin albedo "whiteness" (or reflected sunlight) in turn from albus "white", is the diffuse reflectivity or reflecting power of a surface.
It is the ratio of reflected radiation from the surface to incident radiation upon it. Its dimensionless nature lets it be expressed as a percentage and is measured on a scale from zero for no reflection of a perfectly black surface to 1 for perfect reflection of a white surface.

Albedo depends on the frequency of the radiation. When quoted unqualified, it usually refers to some appropriate average across the spectrum of visible light. In general, the albedo depends on the directional distribution of incident radiation, except for Lambertian surfaces, which scatter radiation in all directions according to a cosine function and therefore have an albedo that is independent of the incident distribution. In practice, a bidirectional reflectance distribution function (BRDF) may be required to accurately characterize the scattering properties of a surface, but albedo is very useful as a first approximation.

The albedo is an important concept in climatology, astronomy, and calculating reflectivity of surfaces in LEED sustainable-rating systems for buildings. The average overall albedo of Earth, its planetary albedo, is 30 to 35% because of cloud cover, but widely varies locally across the surface because of different geological and environmental features.[1]

The term was introduced into optics by Johann Heinrich Lambert in his 1760 work Photometria.

Terrestrial albedo

Sample albedos
Surface Typical
albedo
Fresh asphalt 0.04[2]
Worn asphalt 0.12[2]
Conifer forest
(Summer)
0.08,[3] 0.09 to 0.15[4]
Deciduous trees 0.15 to 0.18[4]
Bare soil 0.17[5]
Green grass 0.25[5]
Desert sand 0.40[6]
New concrete 0.55[5]
Ocean ice 0.5–0.7[5]
Fresh snow 0.80–0.90[5]
Albedos of typical materials in visible light range from up to 0.9 for fresh snow to about 0.04 for charcoal, one of the darkest substances. Deeply shadowed cavities can achieve an effective albedo approaching the zero of a black body. When seen from a distance, the ocean surface has a low albedo, as do most forests, whereas desert areas have some of the highest albedos among landforms. Most land areas are in an albedo range of 0.1 to 0.4.[7] The average albedo of Earth is about 0.3.[8] This is far higher than for the ocean primarily because of the contribution of clouds.


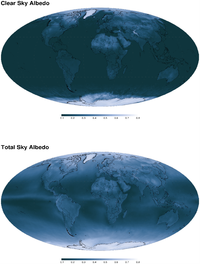
2003–2004 mean annual clear-sky and total-sky albedo

Earth's surface albedo is regularly estimated via Earth observation satellite sensors such as NASA's MODIS instruments on board the Terra and Aqua satellites. As the total amount of reflected radiation cannot be directly measured by satellite, a mathematical model of the BRDF is used to translate a sample set of satellite reflectance measurements into estimates of directional-hemispherical reflectance and bi-hemispherical reflectance (e.g.[9]).

Earth's average surface temperature due to its albedo and the greenhouse effect is currently about 15 °C. If Earth were frozen entirely (and hence be more reflective) the average temperature of the planet would drop below −40 °C.[10] If only the continental land masses became covered by glaciers, the mean temperature of the planet would drop to about 0 °C.[11] In contrast, if the entire Earth is covered by water—a so-called aquaplanet—the average temperature on the planet would rise to just under 27 °C.[12]

White-sky and black-sky albedo

It has been shown that for many applications involving terrestrial albedo, the albedo at a particular solar zenith angle θi can reasonably be approximated by the proportionate sum of two terms: the directional-hemispherical reflectance at that solar zenith angle, {\bar \alpha(\theta_i)}, and the bi-hemispherical reflectance, \bar{ \bar \alpha} the proportion concerned being defined as the proportion of diffuse illumination {D}.
Albedo {\alpha} can then be given as:
{\alpha}= (1-D) \bar \alpha(\theta_i) + D \bar{ \bar \alpha}.
Directional-hemispherical reflectance is sometimes referred to as black-sky albedo and bi-hemispherical reflectance as white-sky albedo. These terms are important because they allow the albedo to be calculated for any given illumination conditions from a knowledge of the intrinsic properties of the surface.[13]

Astronomical albedo

The albedos of planets, satellites and asteroids can be used to infer much about their properties. The study of albedos, their dependence on wavelength, lighting angle ("phase angle"), and variation in time comprises a major part of the astronomical field of photometry. For small and far objects that cannot be resolved by telescopes, much of what we know comes from the study of their albedos. For example, the absolute albedo can indicate the surface ice content of outer Solar System objects, the variation of albedo with phase angle gives information about regolith properties, whereas unusually high radar albedo is indicative of high metal content in asteroids.

Enceladus, a moon of Saturn, has one of the highest known albedos of any body in the Solar System, with 99% of EM radiation reflected. Another notable high-albedo body is Eris, with an albedo of 0.96.[14] Many small objects in the outer Solar System[15] and asteroid belt have low albedos down to about 0.05.[16] A typical comet nucleus has an albedo of 0.04.[17] Such a dark surface is thought to be indicative of a primitive and heavily space weathered surface containing some organic compounds.
The overall albedo of the Moon is around 0.12, but it is strongly directional and non-Lambertian, displaying also a strong opposition effect.[18] Although such reflectance properties are different from those of any terrestrial terrains, they are typical of the regolith surfaces of airless Solar System bodies.

Two common albedos that are used in astronomy are the (V-band) geometric albedo (measuring brightness when illumination comes from directly behind the observer) and the Bond albedo (measuring total proportion of electromagnetic energy reflected). Their values can differ significantly, which is a common source of confusion.

In detailed studies, the directional reflectance properties of astronomical bodies are often expressed in terms of the five Hapke parameters which semi-empirically describe the variation of albedo with phase angle, including a characterization of the opposition effect of regolith surfaces.

The correlation between astronomical (geometric) albedo, absolute magnitude and diameter is:[19]

A =\left ( \frac{1329\times10^{-H/5}}{D} \right ) ^2,

where A is the astronomical albedo, D is the diameter in kilometers, and H is the absolute magnitude.

Examples of terrestrial albedo effects

Illumination

Although the albedo–temperature effect is best known in colder, whiter regions on Earth, the maximum albedo is actually found in the tropics where year-round illumination is greater. The maximum is additionally in the northern hemisphere, varying between three and twelve degrees north.[20] The minima are found in the subtropical regions of the northern and southern hemispheres, beyond which albedo increases without respect to illumination.[20]

Insolation effects

The intensity of albedo temperature effects depend on the amount of albedo and the level of local insolation; high albedo areas in the arctic and antarctic regions are cold due to low insolation, where areas such as the Sahara Desert, which also have a relatively high albedo, will be hotter due to high insolation. Tropical and sub-tropical rain forest areas have low albedo, and are much hotter than their temperate forest counterparts, which have lower insolation. Because insolation plays such a big role in the heating and cooling effects of albedo, high insolation areas like the tropics will tend to show a more pronounced fluctuation in local temperature when local albedo changes.[citation needed]

Climate and weather

Albedo affects climate and drives weather. All weather is a result of the uneven heating of Earth caused by different areas of the planet having different albedos. Essentially, for the driving of weather, there are two types of albedo regions on Earth: Land and ocean. Land and ocean regions produce the four basic different types of air masses, depending on latitude and therefore insolation: Warm and dry, which form over tropical and sub-tropical land masses; warm and wet, which form over tropical and sub-tropical oceans; cold and dry which form over temperate, polar and sub-polar land masses; and cold and wet, which form over temperate, polar and sub-polar oceans. Different temperatures between the air masses result in different air pressures, and the masses develop into pressure systems. High pressure systems flow toward lower pressure, driving weather from north to south in the northern hemisphere, and south to north in the lower; however due to the spinning of Earth, the Coriolis effect further complicates flow and creates several weather/climate bands and the jet streams.

Albedo–temperature feedback

When an area's albedo changes due to snowfall, a snow–temperature feedback results. A layer of snowfall increases local albedo, reflecting away sunlight, leading to local cooling. In principle, if no outside temperature change affects this area (e.g. a warm air mass), the raised albedo and lower temperature would maintain the current snow and invite further snowfall, deepening the snow–temperature feedback. However, because local weather is dynamic due to the change of seasons, eventually warm air masses and a more direct angle of sunlight (higher insolation) cause melting. When the melted area reveals surfaces with lower albedo, such as grass or soil, the effect is reversed: the darkening surface lowers albedo, increasing local temperatures, which induces more melting and thus reducing the albedo further, resulting in still more heating.

Snow

Snow albedo is highly variable, ranging from as high as 0.9 for freshly fallen snow, to about 0.4 for melting snow, and as low as 0.2 for dirty snow.[21] Over Antarctica they average a little more than 0.8. If a marginally snow-covered area warms, snow tends to melt, lowering the albedo, and hence leading to more snowmelt because more radiation is being absorbed by the snowpack (the ice–albedo positive feedback). Cryoconite, powdery windblown dust containing soot, sometimes reduces albedo on glaciers and ice sheets.[22] Hence, small errors in albedo can lead to large errors in energy estimates, which is why it is important to measure the albedo of snow-covered areas through remote sensing techniques rather than applying a single value over broad regions.

Small-scale effects

Albedo works on a smaller scale, too. In sunlight, dark clothes absorb more heat and light-coloured clothes reflect it better, thus allowing some control over body temperature by exploiting the albedo effect of the colour of external clothing.[23]

Solar photovoltaic effects

Albedo can affect the electrical energy output of solar photovoltaic devices. For example, the effects of a spectrally responsive albedo are illustrated by the differences between the spectrally weighted albedo of solar photovoltaic technology based on hydrogenated amorphous silicon (a-Si:H) and crystalline silicon (c-Si)-based compared to traditional spectral-integrated albedo predictions. Research showed impacts of over 10%.[24] More recently, the analysis was extended to the effects of spectral bias due to the specular reflectivity of 22 commonly occurring surface materials (both human-made and natural) and analyzes the albedo effects on the performance of seven photovoltaic materials covering three common photovoltaic system topologies: industrial (solar farms), commercial flat rooftops and residential pitched-roof applications.[25]

Trees

Because forests generally have a low albedo, (the majority of the ultraviolet and visible spectrum is absorbed through photosynthesis), some scientists have suggested that greater heat absorption by trees could offset some of the carbon benefits of afforestation (or offset the negative climate impacts of deforestation). In the case of evergreen forests with seasonal snow cover albedo reduction may be great enough for deforestation to cause a net cooling effect.[26] Trees also impact climate in extremely complicated ways through evapotranspiration. The water vapor causes cooling on the land surface, causes heating where it condenses, acts a strong greenhouse gas, and can increase albedo when it condenses into clouds[27] Scientists generally treat evapotranspiration as a net cooling impact, and the net climate impact of albedo and evapotranspiration changes from deforestation depends greatly on local climate [28]

In seasonally snow-covered zones, winter albedos of treeless areas are 10% to 50% higher than nearby forested areas because snow does not cover the trees as readily. Deciduous trees have an albedo value of about 0.15 to 0.18 whereas coniferous trees have a value of about 0.09 to 0.15.[4]

Studies by the Hadley Centre have investigated the relative (generally warming) effect of albedo change and (cooling) effect of carbon sequestration on planting forests. They found that new forests in tropical and midlatitude areas tended to cool; new forests in high latitudes (e.g. Siberia) were neutral or perhaps warming.[29]

Water

Water reflects light very differently from typical terrestrial materials. The reflectivity of a water surface is calculated using the Fresnel equations (see graph).

Reflectivity of smooth water at 20 °C (refractive index=1.333)

At the scale of the wavelength of light even wavy water is always smooth so the light is reflected in a locally specular manner (not diffusely). The glint of light off water is a commonplace effect of this. At small angles of incident light, waviness results in reduced reflectivity because of the steepness of the reflectivity-vs.-incident-angle curve and a locally increased average incident angle.[30]

Although the reflectivity of water is very low at low and medium angles of incident light, it becomes very high at high angles of incident light such as those that occur on the illuminated side of Earth near the terminator (early morning, late afternoon, and near the poles). However, as mentioned above, waviness causes an appreciable reduction. Because light specularly reflected from water does not usually reach the viewer, water is usually considered to have a very low albedo in spite of its high reflectivity at high angles of incident light.

Note that white caps on waves look white (and have high albedo) because the water is foamed up, so there are many superimposed bubble surfaces which reflect, adding up their reflectivities. Fresh 'black' ice exhibits Fresnel reflection.

Clouds

Cloud albedo has substantial influence over atmospheric temperatures. Different types of clouds exhibit different reflectivity, theoretically ranging in albedo from a minimum of near 0 to a maximum approaching 0.8. "On any given day, about half of Earth is covered by clouds, which reflect more sunlight than land and water. Clouds keep Earth cool by reflecting sunlight, but they can also serve as blankets to trap warmth."[31]

Albedo and climate in some areas are affected by artificial clouds, such as those created by the contrails of heavy commercial airliner traffic.[32] A study following the burning of the Kuwaiti oil fields during Iraqi occupation showed that temperatures under the burning oil fires were as much as 10 °C colder than temperatures several miles away under clear skies.[33]

Aerosol effects

Aerosols (very fine particles/droplets in the atmosphere) have both direct and indirect effects on Earth's radiative balance. The direct (albedo) effect is generally to cool the planet; the indirect effect (the particles act as cloud condensation nuclei and thereby change cloud properties) is less certain.[34] As per [35] the effects are:
  • Aerosol direct effect. Aerosols directly scatter and absorb radiation. The scattering of radiation causes atmospheric cooling, whereas absorption can cause atmospheric warming.
  • Aerosol indirect effect. Aerosols modify the properties of clouds through a subset of the aerosol population called cloud condensation nuclei. Increased nuclei concentrations lead to increased cloud droplet number concentrations, which in turn leads to increased cloud albedo, increased light scattering and radiative cooling (first indirect effect), but also leads to reduced precipitation efficiency and increased lifetime of the cloud (second indirect effect).

Black carbon

Another albedo-related effect on the climate is from black carbon particles. The size of this effect is difficult to quantify: the Intergovernmental Panel on Climate Change estimates that the global mean radiative forcing for black carbon aerosols from fossil fuels is +0.2 W m−2, with a range +0.1 to +0.4 W m−2.[36] Black carbon is a bigger cause of the melting of the polar ice cap in the Arctic than carbon dioxide due to its effect on the albedo.[37]

Human activities

Human activities (e.g. deforestation, farming, and urbanization) change the albedo of various areas around the globe. However, quantification of this effect on the global scale is difficult.[citation needed]

Other types of albedo

Single-scattering albedo is used to define scattering of electromagnetic waves on small particles. It depends on properties of the material (refractive index); the size of the particle or particles; and the wavelength of the incoming radiation.

Neurophilosophy

From Wikipedia, the free encyclopedia https://en.wikipedia.org/wiki/Neurophilosophy ...