Search This Blog

Monday, November 18, 2024

Abstraction

From Wikipedia, the free encyclopedia

Abstraction is a process where general rules and concepts are derived from the use and classifying of specific examples, literal (real or concrete) signifiers, first principles, or other methods.

"An abstraction" is the outcome of this process — a concept that acts as a common noun for all subordinate concepts and connects any related concepts as a group, field, or category.

Conceptual abstractions may be made by filtering the information content of a concept or an observable phenomenon, selecting only those aspects which are relevant for a particular purpose. For example, abstracting a leather soccer ball to the more general idea of a ball selects only the information on general ball attributes and behavior, excluding but not eliminating the other phenomenal and cognitive characteristics of that particular ball. In a type–token distinction, a type (e.g., a 'ball') is more abstract than its tokens (e.g., 'that leather soccer ball').

Abstraction in its secondary use is a material process, discussed in the themes below.

Origins

Thinking in abstractions is considered by anthropologists, archaeologists, and sociologists to be one of the key traits in modern human behaviour, which is believed to have developed between 50,000 and 100,000 years ago. Its development is likely to have been closely connected with the development of human language, which (whether spoken or written) appears to both involve and facilitate abstract thinking.

History

Abstraction involves induction of ideas or the synthesis of particular facts into one general theory about something. It is the opposite of specification, which is the analysis or breaking-down of a general idea or abstraction into concrete facts. Abstraction can be illustrated by Francis Bacon's Novum Organum (1620), a book of modern scientific philosophy written in the late Jacobean era of England to encourage modern thinkers to collect specific facts before making any generalizations.

Bacon used and promoted induction as an abstraction tool; it complemented but was distinct from the ancient deductive-thinking approach that had dominated the intellectual world since the times of Greek philosophers like Thales, Anaximander, and Aristotle. Thales (c. 624–546 BCE) believed that everything in the universe comes from one main substance, water. He deduced or specified from a general idea, "everything is water," to the specific forms of water such as ice, snow, fog, and rivers.

Modern scientists used the approach of abstraction (going from particular facts collected into one general idea). Newton (1642–1727) derived the motion of the planets from Copernicus' (1473–1543) simplification, that the Sun is the center of the Solar System; Kepler (1571–1630) compressed thousands of measurements into one expression to finally conclude that Mars moves in an elliptical orbit about the Sun; Galileo (1564–1642) repeated one hundred specific experiments into the law of falling bodies.

Themes

Compression

An abstraction can be seen as a compression process, mapping multiple different pieces of constituent data to a single piece of abstract data; based on similarities in the constituent data, for example, many different physical cats map to the abstraction "CAT". This conceptual scheme emphasizes the inherent equality of both constituent and abstract data, thus avoiding problems arising from the distinction between "abstract" and "concrete". In this sense the process of abstraction entails the identification of similarities between objects, and the process of associating these objects with an abstraction (which is itself an object).

For example, picture 1 below illustrates the concrete relationship "Cat sits on Mat".

Chains of abstractions can be construed, moving from neural impulses arising from sensory perception to basic abstractions such as color or shape, to experiential abstractions such as a specific cat, to semantic abstractions such as the "idea" of a CAT, to classes of objects such as "mammals" and even categories such as "object" as opposed to "action".

For example, graph 1 below expresses the abstraction "agent sits on location". This conceptual scheme entails no specific hierarchical taxonomy (such as the one mentioned involving cats and mammals), only a progressive exclusion of detail.

Instantiation

Non-existent things in any particular place and time are often seen as abstract. By contrast, instances, or members, of such an abstract thing might exist in many different places and times.

Those abstract things are then said to be multiply instantiated, in the sense of picture 1, picture 2, etc., shown below. It is not sufficient, however, to define abstract ideas as those that can be instantiated and to define abstraction as the movement in the opposite direction to instantiation. Doing so would make the concepts "cat" and "telephone" abstract ideas since despite their varying appearances, a particular cat or a particular telephone is an instance of the concept "cat" or the concept "telephone". Although the concepts "cat" and "telephone" are abstractions, they are not abstract in the sense of the objects in graph 1 below. We might look at other graphs, in a progression from cat to mammal to animal, and see that animal is more abstract than mammal; but on the other hand mammal is a harder idea to express, certainly in relation to marsupial or monotreme.

Perhaps confusingly, some philosophies refer to tropes (instances of properties) as abstract particulars—e.g., the particular redness of a particular apple is an abstract particular. This is similar to qualia and sumbebekos.

Material process

Still retaining the primary meaning of 'abstrere' or 'to draw away from', the abstraction of money, for example, works by drawing away from the particular value of things allowing completely incommensurate objects to be compared (see the section on 'Physicality' below). Karl Marx's writing on the commodity abstraction recognizes a parallel process.

The state (polity) as both concept and material practice exemplifies the two sides of this process of abstraction. Conceptually, 'the current concept of the state is an abstraction from the much more concrete early-modern use as the standing or status of the prince, his visible estates'. At the same time, materially, the 'practice of statehood is now constitutively and materially more abstract than at the time when princes ruled as the embodiment of extended power'.

Ontological status

The way that physical objects, like rocks and trees, have being differs from the way that properties of abstract concepts or relations have being, for example the way the concrete, particular, individuals pictured in picture 1 exist differs from the way the concepts illustrated in graph 1 exist. That difference accounts for the ontological usefulness of the word "abstract". The word applies to properties and relations to mark the fact that, if they exist, they do not exist in space or time, but that instances of them can exist, potentially in many different places and times.

Physicality

A physical object (a possible referent of a concept or word) is considered concrete (not abstract) if it is a particular individual that occupies a particular place and time. However, in the secondary sense of the term 'abstraction', this physical object can carry materially abstracting processes. For example, record-keeping aids throughout the Fertile Crescent included calculi (clay spheres, cones, etc.) which represented counts of items, probably livestock or grains, sealed in containers. According to Schmandt-Besserat 1981, these clay containers contained tokens, the total of which were the count of objects being transferred. The containers thus served as something of a bill of lading or an accounts book. In order to avoid breaking open the containers for the count, marks were placed on the outside of the containers. These physical marks, in other words, acted as material abstractions of a materially abstract process of accounting, using conceptual abstractions (numbers) to communicate its meaning.

Abstract things are sometimes defined as those things that do not exist in reality or exist only as sensory experiences, like the color red. That definition, however, suffers from the difficulty of deciding which things are real (i.e. which things exist in reality). For example, it is difficult to agree to whether concepts like God, the number three, and goodness are real, abstract, or both.

An approach to resolving such difficulty is to use predicates as a general term for whether things are variously real, abstract, concrete, or of a particular property (e.g., good). Questions about the properties of things are then propositions about predicates, which propositions remain to be evaluated by the investigator. In the graph 1 below, the graphical relationships like the arrows joining boxes and ellipses might denote predicates.

Referencing and referring

Abstractions sometimes have ambiguous referents. For example, "happiness" can mean experiencing various positive emotions, but can also refer to life satisfaction and subjective well-being. Likewise, "architecture" refers not only to the design of safe, functional buildings, but also to elements of creation and innovation which aim at elegant solutions to construction problems, to the use of space, and to the attempt to evoke an emotional response in the builders, owners, viewers and users of the building.

Simplification and ordering

Abstraction uses a strategy of simplification, wherein formerly concrete details are left ambiguous, vague, or undefined; thus effective communication about things in the abstract requires an intuitive or common experience between the communicator and the communication recipient. This is true for all verbal/abstract communication.

Conceptual graph for A Cat sitting on the Mat (graph 1)
Cat on Mat (picture 1)

For example, many different things can be red. Likewise, many things sit on surfaces (as in picture 1, to the right). The property of redness and the relation sitting-on are therefore abstractions of those objects. Specifically, the conceptual diagram graph 1 identifies only three boxes, two ellipses, and four arrows (and their five labels), whereas the picture 1 shows much more pictorial detail, with the scores of implied relationships as implicit in the picture rather than with the nine explicit details in the graph.

Graph 1 details some explicit relationships between the objects of the diagram. For example, the arrow between the agent and CAT:Elsie depicts an example of an is-a relationship, as does the arrow between the location and the MAT. The arrows between the gerund/present participle SITTING and the nouns agent and location express the diagram's basic relationship; "agent is SITTING on location"; Elsie is an instance of CAT.

Although the description sitting-on (graph 1) is more abstract than the graphic image of a cat sitting on a mat (picture 1), the delineation of abstract things from concrete things is somewhat ambiguous; this ambiguity or vagueness is characteristic of abstraction. Thus something as simple as a newspaper might be specified to six levels, as in Douglas Hofstadter's illustration of that ambiguity, with a progression from abstract to concrete in Gödel, Escher, Bach (1979):

(1) a publication
(2) a newspaper
(3) The San Francisco Chronicle
(4) the May 18 edition of The San Francisco Chronicle
(5) my copy of the May 18 edition of The San Francisco Chronicle
(6) my copy of the May 18 edition of The San Francisco Chronicle as it was when I first picked it up (as contrasted with my copy as it was a few days later: in my fireplace, burning)

An abstraction can thus encapsulate each of these levels of detail with no loss of generality. But perhaps a detective or philosopher/scientist/engineer might seek to learn about something, at progressively deeper levels of detail, to solve a crime or a puzzle.

Thought processes

In philosophical terminology, abstraction is the thought process wherein ideas are distanced from objects. But an idea can be symbolized.

As used in different disciplines

In art

Typically, abstraction is used in the arts as a synonym for abstract art in general. Strictly speaking, it refers to art unconcerned with the literal depiction of things from the visible world—it can, however, refer to an object or image which has been distilled from the real world, or indeed, another work of art. Artwork that reshapes the natural world for expressive purposes is called abstract; that which derives from, but does not imitate a recognizable subject is called nonobjective abstraction. In the 20th century the trend toward abstraction coincided with advances in science, technology, and changes in urban life, eventually reflecting an interest in psychoanalytic theory. Later still, abstraction was manifest in more purely formal terms, such as color, freedom from objective context, and a reduction of form to basic geometric designs.

In computer science

Computer scientists use abstraction to make models that can be used and re-used without having to re-write all the program code for each new application on every different type of computer. They communicate their solutions with the computer by writing source code in some particular computer language which can be translated into machine code for different types of computers to execute. Abstraction allows program designers to separate a framework (categorical concepts related to computing problems) from specific instances which implement details. This means that the program code can be written so that code does not have to depend on the specific details of supporting applications, operating system software, or hardware, but on a categorical concept of the solution. A solution to the problem can then be integrated into the system framework with minimal additional work. This allows programmers to take advantage of another programmer's work, while requiring only an abstract understanding of the implementation of another's work, apart from the problem that it solves.

In general semantics

Abstractions and levels of abstraction play an important role in the theory of general semantics originated by Alfred Korzybski. Anatol Rapoport wrote "Abstracting is a mechanism by which an infinite variety of experiences can be mapped on short noises (words)."

In history

Francis Fukuyama defines history as "a deliberate attempt of abstraction in which we separate out important from unimportant events".

In linguistics

Researchers in linguistics frequently apply abstraction so as to allow an analysis of the phenomena of language at the desired level of detail. A commonly used abstraction, the phoneme, abstracts speech sounds in such a way as to neglect details that cannot serve to differentiate meaning. Other analogous kinds of abstractions (sometimes called "emic units") considered by linguists include morphemes, graphemes, and lexemes.

Abstraction also arises in the relation between syntax, semantics, and pragmatics. Pragmatics involves considerations that make reference to the user of the language; semantics considers expressions and what they denote (the designata) abstracted from the language user; and syntax considers only the expressions themselves, abstracted from the designata.

In mathematics

Abstraction in mathematics is the process of extracting the underlying structures, patterns or properties of a mathematical concept or object, removing any dependence on real-world objects with which it might originally have been connected, and generalizing it so that it has wider applications or matching among other abstract descriptions of equivalent phenomena.

The advantages of abstraction in mathematics are:

  • It reveals deep connections between different areas of mathematics.
  • Known results in one area can suggest conjectures in another related area.
  • Techniques and methods from one area can be applied to prove results in other related area.
  • Patterns from one mathematical object can be generalized to other similar objects in the same class.

The main disadvantage of abstraction is that highly abstract concepts are more difficult to learn, and might require a degree of mathematical maturity and experience before they can be assimilated.

In music

In music, the term abstraction can be used to describe improvisatory approaches to interpretation, and may sometimes indicate abandonment of tonality. Atonal music has no key signature, and is characterized by the exploration of internal numeric relationships.

In neurology

A recent meta-analysis suggests that the verbal system has a greater engagement with abstract concepts when the perceptual system is more engaged in processing concrete concepts. This is because abstract concepts elicit greater brain activity in the inferior frontal gyrus and middle temporal gyrus compared to concrete concepts which elicit greater activity in the posterior cingulate, precuneus, fusiform gyrus, and parahippocampal gyrus. Other research into the human brain suggests that the left and right hemispheres differ in their handling of abstraction. For example, one meta-analysis reviewing human brain lesions has shown a left hemisphere bias during tool usage.

In philosophy

Abstraction in philosophy is the process (or, to some, the alleged process) in concept formation of recognizing some set of common features in individuals, and on that basis forming a concept of that feature. The notion of abstraction is important to understanding some philosophical controversies surrounding empiricism and the problem of universals. It has also recently become popular in formal logic under predicate abstraction. Another philosophical tool for the discussion of abstraction is thought space.

John Locke defined abstraction in An Essay Concerning Human Understanding:

'So words are used to stand as outward marks of our internal ideas, which are taken from particular things; but if every particular idea that we take in had its own special name, there would be no end to names. To prevent this, the mind makes particular ideas received from particular things become general; which it does by considering them as they are in the mind—mental appearances—separate from all other existences, and from the circumstances of real existence, such as time, place, and so on. This procedure is called abstraction. In it, an idea taken from a particular thing becomes a general representative of all of the same kind, and its name becomes a general name that is applicable to any existing thing that fits that abstract idea.' (2.11.9)

In psychology

Carl Jung's definition of abstraction broadened its scope beyond the thinking process to include exactly four mutually exclusive, different complementary psychological functions: sensation, intuition, feeling, and thinking. Together they form a structural totality of the differentiating abstraction process. Abstraction operates in one of these functions when it excludes the simultaneous influence of the other functions and other irrelevancies, such as emotion. Abstraction requires selective use of this structural split of abilities in the psyche. The opposite of abstraction is concretism. Abstraction is one of Jung's 57 definitions in Chapter XI of Psychological Types.

There is an abstract thinking, just as there is abstract feeling, sensation and intuition. Abstract thinking singles out the rational, logical qualities ... Abstract feeling does the same with ... its feeling-values. ... I put abstract feelings on the same level as abstract thoughts. ... Abstract sensation would be aesthetic as opposed to sensuous sensation and abstract intuition would be symbolic as opposed to fantastic intuition. (Jung, [1921] (1971): par. 678).

In social theory

Social theorists deal with abstraction both as an ideational and as a material process. Alfred Sohn-Rethel (1899–1990) asked: "Can there be abstraction other than by thought?" He used the example of commodity abstraction to show that abstraction occurs in practice as people create systems of abstract exchange that extend beyond the immediate physicality of the object and yet have real and immediate consequences. This work was extended through the 'Constitutive Abstraction' approach of writers associated with the Journal Arena. Two books that have taken this theme of the abstraction of social relations as an organizing process in human history are Nation Formation: Towards a Theory of Abstract Community (1996) and an associated volume published in 2006, Globalism, Nationalism, Tribalism: Bringing Theory Back In. These books argue that a nation is an abstract community bringing together strangers who will never meet as such; thus constituting materially real and substantial, but abstracted and mediated relations. The books suggest that contemporary processes of globalization and mediatization have contributed to materially abstracting relations between people, with major consequences for how humans live their lives.

One can readily argue that abstraction is an elementary methodological tool in several disciplines of social science. These disciplines have definite and different concepts of "man" that highlight those aspects of man and his behaviour by idealization that are relevant for the given human science. For example, homo sociologicus is the man as sociology abstracts and idealizes it, depicting man as a social being. Moreover, we could talk about homo cyber sapiens (the man who can extend his biologically determined intelligence thanks to new technologies), or homo creativus (who is simply creative).

Abstraction (combined with Weberian idealization) plays a crucial role in economics - hence abstractions such as "the market" and the generalized concept of "business". Breaking away from directly experienced reality was a common trend in 19th-century sciences (especially physics), and this was the effort which fundamentally determined the way economics tried (and still tries) to approach the economic aspects of social life. It is abstraction we meet in the case of both Newton's physics and the neoclassical theory, since the goal was to grasp the unchangeable and timeless essence of phenomena. For example, Newton created the concept of the material point by following the abstraction method so that he abstracted from the dimension and shape of any perceptible object, preserving only inertial and translational motion. Material point is the ultimate and common feature of all bodies. Neoclassical economists created the indefinitely abstract notion of homo economicus by following the same procedure. Economists abstract from all individual and personal qualities in order to get to those characteristics that embody the essence of economic activity. Eventually, it is the substance of the economic man that they try to grasp. Any characteristic beyond it only disturbs the functioning of this essential core.
Tipping points in the climate system

From Wikipedia, the free encyclopedia
Map showing global and regional tipping elements: if the global temperature increases past a certain point (color-coded for temperature thresholds), this particular element would be tipped. The result would be a transition to a different state.

In climate science, a tipping point is a critical threshold that, when crossed, leads to large, accelerating and often irreversible changes in the climate system. If tipping points are crossed, they are likely to have severe impacts on human society and may accelerate global warming. Tipping behavior is found across the climate system, for example in ice sheets, mountain glaciers, circulation patterns in the ocean, in ecosystems, and the atmosphere. Examples of tipping points include thawing permafrost, which will release methane, a powerful greenhouse gas, or melting ice sheets and glaciers reducing Earth's albedo, which would warm the planet faster. Thawing permafrost is a threat multiplier because it holds roughly twice as much carbon as the amount currently circulating in the atmosphere.

Tipping points are often, but not necessarily, abrupt. For example, with average global warming somewhere between 0.8 °C (1.4 °F) and 3 °C (5.4 °F), the Greenland ice sheet passes a tipping point and is doomed, but its melt would take place over millennia. Tipping points are possible at today's global warming of just over 1 °C (1.8 °F) above preindustrial times, and highly probable above 2 °C (3.6 °F) of global warming. It is possible that some tipping points are close to being crossed or have already been crossed, like those of the West Antarctic and Greenland ice sheets, the Amazon rainforest and warm-water coral reefs.

A danger is that if the tipping point in one system is crossed, this could cause a cascade of other tipping points, leading to severe, potentially catastrophic, impacts. Crossing a threshold in one part of the climate system may trigger another tipping element to tip into a new state. For example, ice loss in West Antarctica and Greenland will significantly alter ocean circulation. Sustained warming of the northern high latitudes as a result of this process could activate tipping elements in that region, such as permafrost degradation, and boreal forest dieback.

Scientists have identified many elements in the climate system which may have tipping points. As of September 2022, nine global core tipping elements and seven regional impact tipping elements are known. Out of those, one regional and three global climate elements will likely pass a tipping point if global warming reaches 1.5 °C (2.7 °F). They are the Greenland ice sheet collapse, West Antarctic ice sheet collapse, tropical coral reef die off, and boreal permafrost abrupt thaw.

Tipping points exists in a range of systems, for example in the cryosphere, within ocean currents, and in terrestrial systems. The tipping points in the cryosphere include: Greenland ice sheet disintegration, West Antarctic ice sheet disintegration, East Antarctic ice sheet disintegration, arctic sea ice decline, retreat of mountain glaciers, permafrost thaw. The tipping points for ocean current changes include the Atlantic Meridional Overturning Circulation (AMOC), the North Subpolar Gyre and the Southern Ocean overturning circulation. Lastly, the tipping points in terrestrial systems include Amazon rainforest dieback, boreal forest biome shift, Sahel greening, and vulnerable stores of tropical peat carbon.

Definition

Positive tipping point in society

The IPCC Sixth Assessment Report defines a tipping point as a "critical threshold beyond which a system reorganizes, often abruptly and/or irreversibly". It can be brought about by a small disturbance causing a disproportionately large change in the system. It can also be associated with self-reinforcing feedbacks, which could lead to changes in the climate system irreversible on a human timescale. For any particular climate component, the shift from one state to a new stable state may take many decades or centuries.

The 2019 IPCC Special Report on the Ocean and Cryosphere in a Changing Climate defines a tipping point as: "A level of change in system properties beyond which a system reorganises, often in a non-linear manner, and does not return to the initial state even if the drivers of the change are abated. For the climate system, the term refers to a critical threshold at which global or regional climate changes from one stable state to another stable state.".

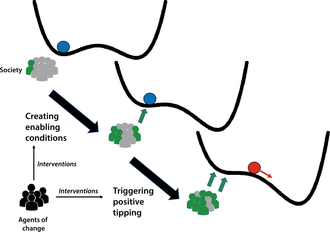
In ecosystems and in social systems, a tipping point can trigger a regime shift, a major systems reorganisation into a new stable state. Such regime shifts need not be harmful. In the context of the climate crisis, the tipping point metaphor is sometimes used in a positive sense, such as to refer to shifts in public opinion in favor of action to mitigate climate change, or the potential for minor policy changes to rapidly accelerate the transition to a green economy.

Comparison of tipping points

Scientists have identified many elements in the climate system which may have tipping points. In the early 2000s the IPCC began considering the possibility of tipping points, originally referred to as large-scale discontinuities. At that time the IPCC concluded they would only be likely in the event of global warming of 4 °C (7.2 °F) or more above preindustrial times, and another early assessment placed most tipping point thresholds at 3–5 °C (5.4–9.0 °F) above 1980–1999 average warming. Since then estimates for global warming thresholds have generally fallen, with some thought to be possible in the Paris Agreement range (1.5–2 °C (2.7–3.6 °F)) by 2016. As of 2021 tipping points are considered to have significant probability at today's warming level of just over 1 °C (1.8 °F), with high probability above 2 °C (3.6 °F) of global warming. Some tipping points may be close to being crossed or have already been crossed, like those of the ice sheets in West Antarctic and Greenland, warm-water coral reefs, and the Amazon rainforest.

As of September 2022, nine global core tipping elements and seven regional impact tipping elements have been identified. Out of those, one regional and three global climate elements are estimated to likely pass a tipping point if global warming reaches 1.5 °C (2.7 °F), namely Greenland ice sheet collapse, West Antarctic ice sheet collapse, tropical coral reef die off, and boreal permafrost abrupt thaw. Two further tipping points are forecast as likely if warming continues to approach 2 °C (3.6 °F): Barents sea ice abrupt loss, and the Labrador sea subpolar gyre collapse.

Global core tipping elements
Proposed climate tipping element (and tipping point) Threshold ( °C) Timescale (years) Maximum Impact ( °C)
Estimated Minimum Maximum Estimated Minimum Maximum Global Regional
Greenland Ice Sheet (collapse) 1.5 0.8 3.0 10,000 1,000 15,000 0.13 0.5 to 3.0
West Antarctic Ice Sheet (collapse) 1.5 1.0 3.0 2,000 500 13,000 0.05 1.0
Labrador-Irminger Seas/SPG Convection (collapse) 1.8 1.1 3.8 10 5 50 -0.5 -3.0
East Antarctic Subglacial Basins (collapse) 3.0 2.0 6.0 2,000 500 10,000 0.05 ?
Arctic Winter Sea Ice (collapse) 6.3 4.5 8.7 20 10 100 0.6 0.6 to 1.2
East Antarctic Ice Sheet (collapse) 7.5 5.0 10.0 ? 10,000 ? 0.6 2.0
Amazon Rainforest (dieback) 3.5 2.0 6.0 100 50 200 0.1 (partial) 0.2 (total) 0.4 to 2.0
Boreal Permafrost (collapse) 4.0 3.0 6.0 50 10 300 0.2 - 0.4 ~
Atlantic Meridional Overturning Circulation (collapse) 4.0 1.4 8.0 50 15 300 -0.5 -4 to -10
The paper also provides the same estimate in terms of equivalent emissions: partial dieback would be equivalent to the emissions of 30 billion tonnes of carbon, while total dieback would be equivalent to 75 billion tonnes of carbon.

The paper also provides the same estimate in terms of emissions: between 125 and 250 billion tonnes of carbon and between 175 and 350 billion tonnes of carbon equivalent.

Regional impact tipping elements
Proposed climate tipping element (and tipping point) Threshold ( °C) Timescale (years) Maximum Impact ( °C)
Estimated Minimum Maximum Estimated Minimum Maximum Global Regional
Low-latitude Coral Reefs (dieoff) 1.5 1.0 2.0 10 ~ ~ ~ ~
Boreal Permafrost (abrupt thaw) 1.5 1.0 2.3 200 100 300 0.04 per °C by 2100;0.11 per °C by 2300 ~
Barents Sea Ice (abrupt loss) 1.6 1.5 1.7 25 ? ? ~ +
Mountain Glaciers (loss) 2.0 1.5 3.0 200 50 1,000 0.08 +
Sahel and W.African Monsoon (greening) 2.8 2.0 3.5 50 10 500 ~ +
Boreal Forest (southern dieoff) 4.0 1.4 5.0 100 50 ? net -0.18 -0.5 to -2
Boreal Forest (northern expansion) 4.0 1.5 7.2 100 40 ? net +0.14 0.5-1.0

The paper clarifies that this represents a 50% increase of gradual permafrost thaw: it also provides the same estimate in terms of emissions per each degree of warming: 10 billion tonnes of carbon and 14 billion tonnes of carbon equivalent by 2100, and 25/35 billion tonnes of carbon/carbon equivalent by 2300.

The loss of these forests would be equivalent to the emissions of 52 billion tons of carbon, but this would be more than offset by the area's albedo effect increasing and reflecting more sunlight.

Extra forest growth here would absorb around 6 billion tons of carbon, but because this area receives a lot of sunlight, this is very minor when compared to reduced albedo, as this vegetation absorbs more heat than the snow-covered ground it moves into.

Tipping points in the cryosphere

Greenland ice sheet disintegration

Changes in extent (colored lines) and thickness (black lines) of the Greenland ice sheet over time, showing its rapid, sustained melting since 2000.

The Greenland ice sheet is the second largest ice sheet in the world, and the water which it holds, if completely melted, would raise sea levels globally by 7.2 metres (24 ft). Due to global warming, the ice sheet is melting at an accelerating rate, adding almost 1 mm to global sea levels every year. Around half of the ice loss occurs via surface melting, and the remainder occurs at the base of the ice sheet where it touches the sea, by calving (breaking off) icebergs from its margins.

The Greenland ice sheet has a tipping point because of the melt-elevation feedback. Surface melting reduces the height of the ice sheet, and air at a lower altitude is warmer. The ice sheet is then exposed to warmer temperatures, accelerating its melt. A 2021 analysis of sub-glacial sediment at the bottom of a 1.4 kilometres (0.87 mi) Greenland ice core finds that the Greenland ice sheet melted away at least once during the last million years, and therefore strongly suggests that its tipping point is below the 2.5 °C (4.5 °F) maximum temperature increase over the preindustrial conditions observed over that period. There is some evidence that the Greenland ice sheet is losing stability, and getting close to a tipping point.

West Antarctic ice sheet disintegration

A topographic and bathymetric map of Antarctica without its ice sheets, assuming constant sea levels and no post-glacial rebound

The West Antarctic Ice Sheet (WAIS) is a large ice sheet in Antarctica; in places more than 4 kilometres (2.5 mi) thick. It sits on bedrock mostly below sea level, having formed a deep subglacial basin due to the weight of the ice sheet over millions of years. As such, it is in contact with the heat from the ocean which makes it vulnerable to fast and irreversible ice loss. A tipping point could be reached once the WAIS's grounding lines (the point at which ice no longer sits on rock and becomes floating ice shelves) retreat behind the edge of the subglacial basin, resulting in self-sustaining retreat in to the deeper basin - a process known as the Marine Ice Sheet Instability (MISI). Thinning and collapse of the WAIS's ice shelves is helping to accelerate this grounding line retreat. If completely melted, the WAIS would contribute around 3.3 metres (11 ft) of sea level rise over thousands of years.

Ice loss from the WAIS is accelerating, and some outlet glaciers are estimated to be close to or possibly already beyond the point of self-sustaining retreat. The paleo record suggests that during the past few hundred thousand years, the WAIS largely disappeared in response to similar levels of warming and CO2 emission scenarios projected for the next few centuries.

Like with the other ice sheets, there is a counteracting negative feedback - greater warming also intensifies the effects of climate change on the water cycle, which result in an increased precipitation over the ice sheet in the form of snow during the winter, which would freeze on the surface, and this increase in the surface mass balance (SMB) counteracts some fraction of the ice loss. In the IPCC Fifth Assessment Report, it was suggested that this effect could potentially overpower increased ice loss under the higher levels of warming and result in small net ice gain, but by the time of the IPCC Sixth Assessment Report, improved modelling had proven that the glacier breakup would consistently accelerate at a faster rate.

East Antarctic ice sheet disintegration

East Antarctic ice sheet is the largest and thickest ice sheet on Earth, with the maximum thickness of 4,800 metres (3.0 mi). A complete disintegration would raise the global sea levels by 53.3 metres (175 ft), but this may not occur until global warming of 10 °C (18 °F), while the loss of two-thirds of its volume may require at least 6 °C (11 °F) of warming to trigger. Its melt would also occur over a longer timescale than the loss of any other ice on the planet, taking no less than 10,000 years to finish. However, the subglacial basin portions of the East Antarctic ice sheet may be vulnerable to tipping at lower levels of warming. The Wilkes Basin is of particular concern, as it holds enough ice to raise sea levels by about 3–4 metres (10–13 ft).

Arctic sea ice decline

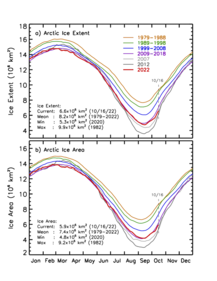
Average decadal extent and area of the Arctic Ocean sea ice since 1979.
Average decadal extent and area of the Arctic Ocean sea ice since the start of satellite observations.
Annual trend in the Arctic sea ice extent and area for the 2011-2022 time period.

Arctic sea ice was once identified as a potential tipping element. The loss of sunlight-reflecting sea ice during summer exposes the (dark) ocean, which would warm. Arctic sea ice cover is likely to melt entirely under even relatively low levels of warming, and it was hypothesised that this could eventually transfer enough heat to the ocean to prevent sea ice recovery even if the global warming is reversed. Modelling now shows that this heat transfer during the Arctic summer does not overcome the cooling and the formation of new ice during the Arctic winter. As such, the loss of Arctic ice during the summer is not a tipping point for as long as the Arctic winter remains cool enough to enable the formation of new Arctic sea ice. However, if the higher levels of warming prevent the formation of new Arctic ice even during winter, then this change may become irreversible. Consequently, Arctic Winter Sea Ice is included as a potential tipping point in a 2022 assessment.

Additionally, the same assessment argued that while the rest of the ice in the Arctic Ocean may recover from a total summertime loss during the winter, ice cover in the Barents Sea may not reform during the winter even below 2 °C (3.6 °F) of warming. This is because the Barents Sea is already the fastest-warming part of the Arctic: in 2021-2022 it was found that while the warming within the Arctic Circle has already been nearly four times faster than the global average since 1979, Barents Sea warmed up to seven times faster than the global average. This tipping point matters because of the decade-long history of research into the connections between the state of Barents-Kara Sea ice and the weather patterns elsewhere in Eurasia.

Retreat of mountain glaciers

Projected loss of mountain glaciers over the 21st century, for different amounts of global warming.

Mountain glaciers are the largest repository of land-bound ice after the Greenland and the Antarctica ice sheets, and they are also undergoing melting as the result of climate change. A glacier tipping point is when it enters a disequilibrium state with the climate and will melt away unless the temperatures go down. Examples include glaciers of the North Cascade Range, where even in 2005 67% of the glaciers observed were in disequilibrium and will not survive the continuation of the present climate, or the French Alps, where The Argentière and Mer de Glace glaciers are expected to disappear completely by end of the 21st century if current climate trends persist. Altogether, it was estimated in 2023 that 49% of the world's glaciers would be lost by 2100 at 1.5 °C (2.7 °F) of global warming, and 83% of glaciers would be lost at 4 °C (7.2 °F). This would amount to one quarter and nearly half of mountain glacier *mass* loss, respectively, as only the largest, most resilient glaciers would survive the century. This ice loss would also contribute ~9 cm (3+12 in) and ~15 cm (6 in) to sea level rise, while the current likely trajectory of 2.7 °C (4.9 °F) would result in the SLR contribution of ~11 cm (4+12 in) by 2100.

The absolute largest amount of glacier ice is located in the Hindu Kush Himalaya region, which is colloquially known as the Earth's Third Pole as the result. It is believed that one third of that ice will be lost by 2100 even if the warming is limited to 1.5 °C (2.7 °F), while the intermediate and severe climate change scenarios (Representative Concentration Pathways (RCP) 4.5 and 8.5) are likely to lead to the losses of 50% and >67% of the region's glaciers over the same timeframe. Glacier melt is projected to accelerate regional river flows until the amount of meltwater peaks around 2060, going into an irreversible decline afterwards. Since regional precipitation will continue to increase even as the glacier meltwater contribution declines, annual river flows are only expected to diminish in the western basins where contribution from the monsoon is low: however, irrigation and hydropower generation would still have to adjust to greater interannual variability and lower pre-monsoon flows in all of the region's rivers.

Permafrost thaw

Ground collapse caused by abrupt permafrost thaw in Herschel Island, Canada, 2013

Perennially frozen ground, or permafrost, covers large fractions of land – mainly in Siberia, Alaska, northern Canada and the Tibetan plateau – and can be up to a kilometre thick. Subsea permafrost up to 100 metres thick also occurs on the sea floor under part of the Arctic Ocean. This frozen ground holds vast amounts of carbon from plants and animals that have died and decomposed over thousands of years. Scientists believe there is nearly twice as much carbon in permafrost than is present in Earth's atmosphere.

As the climate warms and the permafrost begins to thaw, carbon dioxide and methane are released into the atmosphere. With higher temperatures, microbes become active and decompose the biological material in the permafrost, some of which is irreversibly lost. While most thaw is gradual and will take centuries, abrupt thaw can occur in some places where permafrost is rich in large ice masses, which once melted cause the ground to slump or form 'thermokarst' lakes over years to decades. These processes can become self-sustaining, leading to localised tipping dynamics, and could increase greenhouse gas emissions by around 40%. Because CO2 and methane are both greenhouse gases, they act as a self-reinforcing feedback on permafrost thaw, but are unlikely to lead to a global tipping point or runaway warming process.

Atlantic Meridional Overturning Circulation (AMOC)

The Northern part of the Atlantic Meridional Overturning Circulation

The Atlantic Meridional Overturning Circulation (AMOC), also known as the Gulf Stream System, is a large system of ocean currents. It is driven by differences in the density of water; colder and more salty water is heavier than warmer fresh water. The AMOC acts as a conveyor belt, sending warm surface water from the tropics north, and carrying cold fresh water back south. As warm water flows northwards, some evaporates which increases salinity. It also cools when it is exposed to cooler air. Cold, salty water is more dense and slowly begins to sink. Several kilometres below the surface, cold, dense water begins to move south. Increased rainfall and the melting of ice due to global warming dilutes the salty surface water, and warming further decreases its density. The lighter water is less able to sink, slowing down the circulation.

Theory, simplified models, and reconstructions of abrupt changes in the past suggest the AMOC has a tipping point. If freshwater input from melting glaciers reaches a certain threshold, it could collapse into a state of reduced flow. Even after melting stops, the AMOC may not return to its current state. It is unlikely that the AMOC will tip in the 21st century, but it may do so before 2300 if greenhouse gas emissions are very high. A weakening of 24% to 39% is expected depending on greenhouse emissions, even without tipping behaviour. If the AMOC does shut down, a new stable state could emerge that lasts for thousands of years, possibly triggering other tipping points.

In 2021, a study which used a primitive finite-difference ocean model estimated that AMOC collapse could be invoked by a sufficiently fast increase in ice melt even if it never reached the common thresholds for tipping obtained from slower change. Thus, it implied that the AMOC collapse is more likely than what is usually estimated by the complex and large-scale climate models. Another 2021 study found early-warning signals in a set of AMOC indices, suggesting that the AMOC may be close to tipping. However, it was contradicted by another study published in the same journal the following year, which found a largely stable AMOC which had so far not been affected by climate change beyond its own natural variability. Two more studies published in 2022 have also suggested that the modelling approaches commonly used to evaluate AMOC appear to overestimate the risk of its collapse.

North Subpolar Gyre

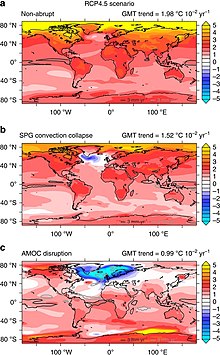
Modelled 21st century warming under the "intermediate" climate change scenario (top). The potential collapse of the subpolar gyre in this scenario (middle). The collapse of the entire AMOC (bottom).

Some climate models indicate that the deep convection in Labrador-Irminger Seas could collapse under certain global warming scenarios, which would then collapse the entire circulation in the North subpolar gyre. It is considered unlikely to recover even if the temperature is returned to a lower level, making it an example of a climate tipping point. This would result in rapid cooling, with implications for economic sectors, agriculture industry, water resources and energy management in Western Europe and the East Coast of the United States. Frajka-Williams et al. 2017 pointed out that recent changes in cooling of the subpolar gyre, warm temperatures in the subtropics and cool anomalies over the tropics, increased the spatial distribution of meridional gradient in sea surface temperatures, which is not captured by the AMO Index.

A 2021 study found that this collapse occurs in only four CMIP6 models out of 35 analyzed. However, only 11 models out of 35 can simulate North Atlantic Current with a high degree of accuracy, and this includes all four models which simulate collapse of the subpolar gyre. As the result, the study estimated the risk of an abrupt cooling event over Europe caused by the collapse of the current at 36.4%, which is lower than the 45.5% chance estimated by the previous generation of models.  In 2022, a paper suggested that previous disruption of subpolar gyre was connected to the Little Ice Age.

Southern Ocean overturning circulation

Since the 1970s, the upper cell of the circulation has strengthened, while the lower cell weakened.

Southern ocean overturning circulation itself consists of two parts, the upper and the lower cell. The smaller upper cell is most strongly affected by winds due to its proximity to the surface, while the behaviour of the larger lower cell is defined by the temperature and salinity of Antarctic bottom water. The strength of both halves had undergone substantial changes in the recent decades: the flow of the upper cell has increased by 50-60% since 1970s, while the lower cell has weakened by 10-20%. Some of this has been due to the natural cycle of Interdecadal Pacific Oscillation, but climate change has also played a substantial role in both trends, as it had altered the Southern Annular Mode weather pattern, while the massive growth of ocean heat content in the Southern Ocean has increased the melting of the Antarctic ice sheets, and this fresh meltwater dilutes salty Antarctic bottom water.

Paleoclimate evidence shows that the entire circulation had strongly weakened or outright collapsed before: some preliminary research suggests that such a collapse may become likely once global warming reaches levels between 1.7 °C (3.1 °F) and 3 °C (5.4 °F). However, there is far less certainty than with the estimates for most other tipping points in the climate system. Even if initiated in the near future, the circulation's collapse is unlikely to be complete until close to 2300, Similarly, impacts such as the reduction in precipitation in the Southern Hemisphere, with a corresponding increase in the North, or a decline of fisheries in the Southern Ocean with a potential collapse of certain marine ecosystems, are also expected to unfold over multiple centuries.

Tipping points in terrestrial systems

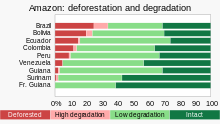
As of 2022, 20% of the Amazon rainforest has been "transformed" (deforested) and another 6% has been "highly degraded", causing Amazon Watch to warn that the Amazonia is in the midst of a tipping point crisis.

Amazon rainforest dieback

The Amazon rainforest is the largest tropical rainforest in the world. It is twice as big as India and spans nine countries in South America. It produces around half of its own rainfall by recycling moisture through evaporation and transpiration as air moves across the forest. This moisture recycling expands the area in which there is enough rainfall for rainforest to be maintained, and without it one model indicates around 40% of the current forest area would be too dry to sustain rainforest. However, when forest is lost via climate change (from droughts and wildfires) or deforestation, there will be less rain in downwind regions, increasing tree stress and mortality there. Eventually, if enough forest is lost a threshold can be reached beyond which large parts of the remaining rainforest may die off and transform into drier degraded forest or savanna landscapes, particularly in the drier south and east. In 2022, a study reported that the rainforest has been losing resilience since the early 2000s. Resilience is measured by recovery-time from short-term perturbations, with delayed return to equilibrium of the rainforest termed as critical slowing down. The observed loss of resilience reinforces the theory that the rainforest could be approaching a critical transition, although it cannot determine exactly when or if a tipping point will be reached.

Boreal forest biome shift

During the last quarter of the twentieth century, the zone of latitude occupied by taiga experienced some of the greatest temperature increases on Earth. Winter temperatures have increased more than summer temperatures. In summer, the daily low temperature has increased more than the daily high temperature. It has been hypothesised that the boreal environments have only a few states which are stable in the long term - a treeless tundra/steppe, a forest with >75% tree cover and an open woodland with ~20% and ~45% tree cover. Thus, continued climate change would be able to force at least some of the presently existing taiga forests into one of the two woodland states or even into a treeless steppe - but it could also shift tundra areas into woodland or forest states as they warm and become more suitable for tree growth.

The response of six tree species common in Quebec's forests to 2 °C (3.6 °F) and 4 °C (7.2 °F) warming under different precipitation levels.

These trends were first detected in the Canadian boreal forests in the early 2010s, and summer warming had also been shown to increase water stress and reduce tree growth in dry areas of the southern boreal forest in central Alaska and portions of far eastern Russia. In Siberia, the taiga is converting from predominantly needle-shedding larch trees to evergreen conifers in response to a warming climate.

Subsequent research in Canada found that even in the forests where biomass trends did not change, there was a substantial shift towards the deciduous broad-leaved trees with higher drought tolerance over the past 65 years. A Landsat analysis of 100,000 undisturbed sites found that the areas with low tree cover became greener in response to warming, but tree mortality (browning) became the dominant response as the proportion of existing tree cover increased. A 2018 study of the seven tree species dominant in the Eastern Canadian forests found that while 2 °C (3.6 °F) warming alone increases their growth by around 13% on average, water availability is much more important than temperature. Also, further warming of up to 4 °C (7.2 °F) would result in substantial declines unless matched by increases in precipitation.

A 2021 paper had confirmed that the boreal forests are much more strongly affected by climate change than the other forest types in Canada and projected that most of the eastern Canadian boreal forests would reach a tipping point around 2080 under the RCP 8.5 scenario, which represents the largest potential increase in anthropogenic emissions. Another 2021 study projected that under the moderate SSP2-4.5 scenario, boreal forests would experience a 15% worldwide increase in biomass by the end of the century, but this would be more than offset by the 41% biomass decline in the tropics. In 2022, the results of a 5-year warming experiment in North America had shown that the juveniles of tree species which currently dominate the southern margins of the boreal forests fare the worst in response to even 1.5 °C (2.7 °F) or 3.1 °C (5.6 °F) of warming and the associated reductions in precipitation. While the temperate species which would benefit from such conditions are also present in the southern boreal forests, they are both rare and have slower growth rates.hel greening

Greening of the Sahel between 1982 and 1999

The Special Report on Global Warming of 1.5 °C and the IPCC Fifth Assessment Report indicate that global warming will likely result in increased precipitation across most of East Africa, parts of Central Africa and the principal wet season of West Africa. However, there is significant uncertainty related to these projections especially for West Africa. Currently, the Sahel is becoming greener but precipitation has not fully recovered to levels reached in the mid-20th century.

A study from 2022 concluded: "Clearly the existence of a future tipping threshold for the WAM (West African Monsoon) and Sahel remains uncertain as does its sign but given multiple past abrupt shifts, known weaknesses in current models, and huge regional impacts but modest global climate feedback, we retain the Sahel/WAM as a potential regional impact tipping element (low confidence)."

Some simulations of global warming and increased carbon dioxide concentrations have shown a substantial increase in precipitation in the Sahel/Sahara. This and the increased plant growth directly induced by carbon dioxide could lead to an expansion of vegetation into present-day desert, although it might be accompanied by a northward shift of the desert, i.e. a drying of northernmost Africa.

Vulnerable stores of tropical peat carbon: Cuvette Centrale peatland

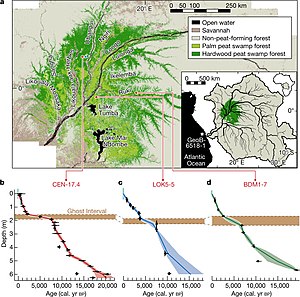
Map of Cuvette Centrale location in the Congo Basin. Three graphs portray the evolution of its peatland carbon content over the past 20,000 years, as reconstructed from three peat cores.

In 2017, it was discovered that 40% of the Cuvette Centrale wetlands are underlain with a dense layer of peat, which contains around 30 petagrams (billions of tons) of carbon. This amounts to 28% of all tropical peat carbon, equivalent to the carbon contained in all the forests of the Congo Basin. In other words, while this peatland only covers 4% of the Congo Basin area, its carbon content is equal to that of all trees in the other 96%. It was then estimated that if all of that peat burned, the atmosphere would absorb the equivalent of 20 years of current United States carbon dioxide emissions, or three years of all anthropogenic CO2 emissions.

This threat prompted the signing of Brazzaville Declaration in March 2018: an agreement between Democratic Republic of Congo, the Republic of Congo and Indonesia (a country with longer experience of managing its own tropical peatlands) aiming to promote better management and conservation of this region. However, 2022 research by the same team which had originally discovered this peatland not only revised its area (from the original estimate of 145,500 square kilometres (56,200 sq mi) to 167,600 square kilometres (64,700 sq mi)) and depth (from 2 m (6.6 ft) to (1.7 m (5.6 ft)) but also noted that only 8% of this peat carbon is currently covered by the existing protected areas. For comparison, 26% of its peat is located in areas open to logging, mining or palm oil plantations, and nearly all of this area is open for fossil fuel exploration.

Even in the absence of local disturbance from these activities, this area is the most vulnerable store of tropical peat carbon in the world, as its climate is already much drier than that of the other tropical peatlands in the Southeast Asia and the Amazon Rainforest. A 2022 study suggests that the geologically recent conditions between 7,500 years ago and 2,000 years ago were already dry enough to cause substantial peat release from this area, and that these conditions are likely to recur in the near future under continued climate change. In this case, Cuvette Centrale would act as one of the tipping points in the climate system at some yet unknown time.

Other tipping points

Coral reef die-off

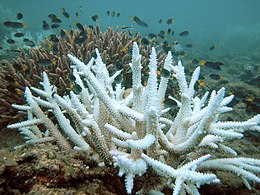
Bleached coral with normal coral in the background

Around 500 million people around the world depend on coral reefs for food, income, tourism and coastal protection. Since the 1980s, this is being threatened by the increase in sea surface temperatures which is triggering mass bleaching of coral, especially in sub-tropical regions. A sustained ocean temperature spike of 1 °C (1.8 °F) above average is enough to cause bleaching. Under heat stress, corals expel the small colourful algae which live in their tissues, which causes them to turn white. The algae, known as zooxanthellae, have a symbiotic relationship with coral such that without them, the corals slowly die. After these zooxanthellae have disappeared, the corals are vulnerable to a transition towards a seaweed-dominated ecosystem, making it very difficult to shift back to a coral-dominated ecosystem. The IPCC estimates that by the time temperatures have risen to 1.5 °C (2.7 °F) above pre-industrial times, Coral reefs... are projected to decline by a further 70–90% at 1.5 °C; and that if the world warms by 2 °C (3.6 °F), they will become extremely rare.

Break-up of equatorial stratocumulus clouds

In 2019, a study employed a large eddy simulation model to estimate that equatorial stratocumulus clouds could break up and scatter when CO2 levels rise above 1,200 ppm (almost three times higher than the current levels, and over 4 times greater than the preindustrial levels). The study estimated that this would cause a surface warming of about 8 °C (14 °F) globally and 10 °C (18 °F) in the subtropics, which would be in addition to at least 4 °C (7.2 °F) already caused by such CO2 concentrations. In addition, stratocumulus clouds would not reform until the CO2 concentrations drop to a much lower level. It was suggested that this finding could help explain past episodes of unusually rapid warming such as Paleocene-Eocene Thermal Maximum In 2020, further work from the same authors revealed that in their large eddy simulation, this tipping point cannot be stopped with solar radiation modification: in a hypothetical scenario where very high CO2 emissions continue for a long time but are offset with extensive solar radiation modification, the break-up of stratocumulus clouds is simply delayed until CO2 concentrations hit 1,700 ppm, at which point it would still cause around 5 °C (9.0 °F) of unavoidable warming.

However, because large eddy simulation models are simpler and smaller-scale than the general circulation models used for climate projections, with limited representation of atmospheric processes like subsidence, this finding is currently considered speculative. Other scientists say that the model used in that study unrealistically extrapolates the behavior of small cloud areas onto all cloud decks, and that it is incapable of simulating anything other than a rapid transition, with some comparing it to "a knob with two settings". Additionally, CO2 concentrations would only reach 1,200 ppm if the world follows Representative Concentration Pathway 8.5, which represents the highest possible greenhouse gas emission scenario and involves a massive expansion of coal infrastructure. In that case, 1,200 ppm would be passed shortly after 2100.

Cascading tipping points

A proposed tipping cascade with four tipping elements.

Crossing a threshold in one part of the climate system may trigger another tipping element to tip into a new state. Such sequences of thresholds are called cascading tipping points, an example of a domino effect. Ice loss in West Antarctica and Greenland will significantly alter ocean circulation. Sustained warming of the northern high latitudes as a result of this process could activate tipping elements in that region, such as permafrost degradation, and boreal forest dieback. Thawing permafrost is a threat multiplier because it holds roughly twice as much carbon as the amount currently circulating in the atmosphere. Loss of ice in Greenland likely destabilises the West Antarctic ice sheet via sea level rise, and vice-versa, especially if Greenland were to melt first as West Antarctica is particularly vulnerable to contact with warm sea water.

A 2021 study with three million computer simulations of a climate model showed that nearly one-third of those simulations resulted in domino effects, even when temperature increases were limited to 2 °C (3.6 °F) – the upper limit set by the Paris Agreement in 2015. The authors of the study said that the science of tipping points is so complex that there is great uncertainty as to how they might unfold, but nevertheless, argued that the possibility of cascading tipping points represents "an existential threat to civilisation". A network model analysis suggested that temporary overshoots of climate change – increasing global temperature beyond Paris Agreement goals temporarily as often projected – can substantially increase risks of climate tipping cascades ("by up to 72% compared with non-overshoot scenarios").

Formerly considered tipping elements

Earlier (2008) list of tipping elements in the climate system. When compared to later lists, the major differences are that in 2008 ENSO, Indian summer monsoon, Arctic ozone hole and all of Arctic sea ice were all listed as tipping points. Labrador-Irminger circulation, mountain glaciers and East Antarctic ice however were not included. This 2008 list also includes Antarctic bottom water (part of the Southern Ocean overturning circulation), which was left out of the 2022 list, but included in some subsequent ones.

The possibility that the El Niño–Southern Oscillation (ENSO) is a tipping element had attracted attention in the past. Normally strong winds blow west across the South Pacific Ocean from South America to Australia. Every two to seven years, the winds weaken due to pressure changes and the air and water in the middle of the Pacific warms up, causing changes in wind movement patterns around the globe. This is known as El Niño and typically leads to droughts in India, Indonesia and Brazil, and increased flooding in Peru. In 2015/2016, this caused food shortages affecting over 60 million people. El Niño-induced droughts may increase the likelihood of forest fires in the Amazon. The threshold for tipping was estimated to be between 3.5 °C (6.3 °F) and 7 °C (13 °F) of global warming in 2016. After tipping, the system would be in a more permanent El Niño state, rather than oscillating between different states. This has happened in Earth's past, in the Pliocene, but the layout of the ocean was significantly different from now. So far, there is no definitive evidence indicating changes in ENSO behaviour, and the IPCC Sixth Assessment Report concluded that it is "virtually certain that the ENSO will remain the dominant mode of interannual variability in a warmer world." Consequently, the 2022 assessment no longer includes it in the list of likely tipping elements.

The Indian summer monsoon is another part of the climate system which was considered suspectible to irreversible collapse in the earlier research. However, more recent research has demonstrated that warming tends to strengthen the Indian monsoon, and it is projected to strengthen in the future.

Methane hydrate deposits in the Arctic were once thought to be vulnerable to a rapid dissociation which would have a large impact on global temperatures, in a dramatic scenario known as a clathrate gun hypothesis. Later research found that it takes millennia for methane hydrates to respond to warming, while methane emissions from the seafloor rarely transfer from the water column into the atmosphere. IPCC Sixth Assessment Report states "It is very unlikely that gas clathrates (mostly methane) in deeper terrestrial permafrost and subsea clathrates will lead to a detectable departure from the emissions trajectory during this century".

Mathematical theory

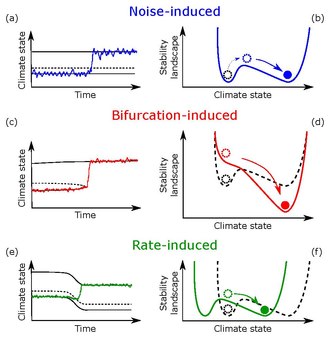
Illustration of three types of tipping point; (a), (b) noise-, (c), (d) bifurcation- and (e), (f) rate-induced. (a), (c), (e) example time-series (coloured lines) through the tipping point with black solid lines indicating stable climate states (e.g. low or high rainfall) and dashed lines represent the boundary between stable states. (b), (d), (f) stability landscapes provide an understanding for the different types of tipping point. The valleys represent different climate states the system can occupy with hill tops separating the stable states.

Tipping point behaviour in the climate can be described in mathematical terms. Three types of tipping points have been identified—bifurcation, noise-induced and rate-dependent.

Bifurcation-induced tipping

Bifurcation-induced tipping happens when a particular parameter in the climate (for instance a change in environmental conditions or forcing), passes a critical level – at which point a bifurcation takes place – and what was a stable state loses its stability or simply disappears. The Atlantic Meridional Overturning Circulation (AMOC) is an example of a tipping element that can show bifurcation-induced tipping. Slow changes to the bifurcation parameters in this system – the salinity and temperature of the water – may push the circulation towards collapse.

Many types of bifurcations show hysteresis, which is the dependence of the state of a system on its history. For instance, depending on how warm it was in the past, there can be differing amounts of ice on the poles at the same concentration of greenhouse gases or temperature.

Early warning signals

For tipping points that occur because of a bifurcation, it may be possible to detect whether a system is getting closer to a tipping point, as it becomes less resilient to perturbations on approach of the tipping threshold. These systems display critical slowing down, with an increased memory (rising autocorrelation) and variance. Depending on the nature of the tipping system, there may be other types of early warning signals. Abrupt change is not an early warning signal (EWS) for tipping points, as abrupt change can also occur if the changes are reversible to the control parameter.

These EWSs are often developed and tested using time series from the paleo record, like sediments, ice caps, and tree rings, where past examples of tipping can be observed. It is not always possible to say whether increased variance and autocorrelation is a precursor to tipping, or caused by internal variability, for instance in the case of the collapse of the AMOC. Quality limitations of paleodata further complicate the development of EWSs. They have been developed for detecting tipping due to drought in forests in California, and melting of the Pine Island Glacier in West Antarctica, among other systems. Using early warning signals (increased autocorrelation and variance of the melt rate time series), it has been suggested that the Greenland ice sheet is currently losing resilience, consistent with modelled early warning signals of the ice sheet.

Human-induced changes in the climate system may be too fast for early warning signals to become evident, especially in systems with inertia.

Noise-induced tipping

Noise-induced tipping is the transition from one state to another due to random fluctuations or internal variability of the system. Noise-induced transitions do not show any of the early warning signals which occur with bifurcations. This means they are unpredictable because the underlying potential does not change. Because they are unpredictable, such occurrences are often described as a "one-in-x-year" event. An example is the Dansgaard–Oeschger events during the last ice age, with 25 occurrences of sudden climate fluctuations over a 500-year period.

Rate-induced tipping

Rate-induced tipping occurs when a change in the environment is faster than the force that restores the system to its stable state. In peatlands, for instance, after years of relative stability, rate-induced tipping can lead to an "explosive release of soil carbon from peatlands into the atmosphere" – sometimes known as "compost bomb instability". The AMOC may also show rate-induced tipping: if the rate of ice melt increases too fast, it may collapse, even before the ice melt reaches the critical value where the system would undergo a bifurcation.

Potential impacts

Schematic of some possible interactions and cascading effects between the Earth's climate system and humanity's social system

Tipping points can have very severe impacts. They can exacerbate current dangerous impacts of climate change, or give rise to new impacts. Some potential tipping points would take place abruptly, such as disruptions to the Indian monsoon, with severe impacts on food security for hundreds of millions. Other impacts would likely take place over longer timescales, such as the melting of the ice caps. The circa 10 metres (33 ft) of sea level rise from the combined melt of Greenland and West Antarctica would require moving many cities inland over the course of centuries, but would also accelerate sea level rise this century, with Antarctic ice sheet instability projected to expose 120 million more people to annual floods in a mid-emissions scenario. A collapse of the Atlantic Overturning Circulation would cause over 10 degrees Celsius of cooling in parts of Europe, cause drying in Europe, Central America, West Africa, and southern Asia, and lead to about 1 metre (3+12 ft) of sea level rise in the North Atlantic. The impacts of AMOC collapse would have serious implications for food security, with one projection showing reduced yields of key crops across most world regions, with for example arable agriculture becoming economically infeasible in Britain. These impacts could happen simultaneously in the case of cascading tipping points. A review of abrupt changes over the last 30,000 years showed that tipping points can lead to a large set of cascading impacts in climate, ecological and social systems. For instance, the abrupt termination of the African humid period cascaded, and desertification and regime shifts led to the retreat of pastoral societies in North Africa and a change of dynasty in Egypt.

Some scholars have proposed a threshold which, if crossed, could trigger multiple tipping points and self-reinforcing feedback loops that would prevent stabilisation of the climate, causing much greater warming and sea-level rises and leading to severe disruption to ecosystems, society, and economies. This scenario is sometimes called the Hothouse Earth scenario. The researchers proposed that this scenario could unfold beyond a threshold of around 2 °C above pre-industrial levels. However, while this scenario is possible, the existence and value of this threshold remains speculative, and doubts have been raised if tipping points would lock in much extra warming in the shorter term. Decisions taken over the next decade could influence the climate of the planet for tens to hundreds of thousands of years and potentially even lead to conditions which are inhospitable to current human societies. The report also states that there is a possibility of a cascade of tipping points being triggered even if the goal outlined in the Paris Agreement to limit warming to 1.5–2.0 °C (34.7–35.6 °F) is achieved.

Geological timescales

Meltwater pulse 1A was a period of abrupt sea level rise around 14,000 years ago. It may be an example of a tipping point.

The geological record shows many abrupt changes that suggest tipping points may have been crossed in pre-historic times. For instance, the Dansgaard–Oeschger events during the last ice age were periods of abrupt warming (within decades) in Greenland and Europe, that may have involved the abrupt changes in major ocean currents. During the deglaciation in the early Holocene, sea level rise was not smooth, but rose abruptly during meltwater pulses. The monsoon in North Africa saw abrupt changes on decadal timescales during the African humid period. This period, spanning from 15,000 to 5,000 years ago, also ended suddenly in a drier state.

Runaway greenhouse effect

A runaway greenhouse effect is a tipping point so extreme that oceans evaporate and the water vapour escapes to space, an irreversible climate state that happened on Venus. A runaway greenhouse effect has virtually no chance of being caused by people. Venus-like conditions on the Earth require a large long-term forcing that is unlikely to occur until the sun brightens by a ten of percents, which will take 600 - 700 million years.

Sneaker wave

From Wikipedia, the free encyclopedia https://en.wikipedia.org/wiki/Sneaker_wave ...