Search This Blog

Monday, June 3, 2024

Computational electromagnetics

From Wikipedia, the free encyclopedia
https://en.wikipedia.org/wiki/Computational_electromagnetics

Computational electromagnetics
(CEM), computational electrodynamics or electromagnetic modeling is the process of modeling the interaction of electromagnetic fields with physical objects and the environment using computers.

It typically involves using computer programs to compute approximate solutions to Maxwell's equations to calculate antenna performance, electromagnetic compatibility, radar cross section and electromagnetic wave propagation when not in free space. A large subfield is antenna modeling computer programs, which calculate the radiation pattern and electrical properties of radio antennas, and are widely used to design antennas for specific applications.

Background

Several real-world electromagnetic problems like electromagnetic scattering, electromagnetic radiation, modeling of waveguides etc., are not analytically calculable, for the multitude of irregular geometries found in actual devices. Computational numerical techniques can overcome the inability to derive closed form solutions of Maxwell's equations under various constitutive relations of media, and boundary conditions. This makes computational electromagnetics (CEM) important to the design, and modeling of antenna, radar, satellite and other communication systems, nanophotonic devices and high speed silicon electronics, medical imaging, cell-phone antenna design, among other applications.

CEM typically solves the problem of computing the E (electric) and H (magnetic) fields across the problem domain (e.g., to calculate antenna radiation pattern for an arbitrarily shaped antenna structure). Also calculating power flow direction (Poynting vector), a waveguide's normal modes, media-generated wave dispersion, and scattering can be computed from the E and H fields. CEM models may or may not assume symmetry, simplifying real world structures to idealized cylinders, spheres, and other regular geometrical objects. CEM models extensively make use of symmetry, and solve for reduced dimensionality from 3 spatial dimensions to 2D and even 1D.

An eigenvalue problem formulation of CEM allows us to calculate steady state normal modes in a structure. Transient response and impulse field effects are more accurately modeled by CEM in time domain, by FDTD. Curved geometrical objects are treated more accurately as finite elements FEM, or non-orthogonal grids. Beam propagation method (BPM) can solve for the power flow in waveguides. CEM is application specific, even if different techniques converge to the same field and power distributions in the modeled domain.

Overview of methods

The most common numerical approach is to discretize ("mesh") the problem space in terms of grids or regular shapes ("cells"), and solve Maxwell's equations simultaneously across all cells. Discretization consumes computer memory, and solving the relevant equations takes significant time. Large-scale CEM problems face memory and CPU limitations, and combating these limitations is an active area of research. High performance clustering, vector processing, and/or parallelism is often required to make the computation practical. Some typical methods involve: time-stepping through the equations over the whole domain for each time instant; banded matrix inversion to calculate the weights of basis functions (when modeled by finite element methods); matrix products (when using transfer matrix methods); calculating numerical integrals (when using the method of moments); using fast Fourier transforms; and time iterations (when calculating by the split-step method or by BPM).

Choice of methods

Choosing the right technique for solving a problem is important, as choosing the wrong one can either result in incorrect results, or results which take excessively long to compute. However, the name of a technique does not always tell one how it is implemented, especially for commercial tools, which will often have more than one solver.

Davidson gives two tables comparing the FEM, MoM and FDTD techniques in the way they are normally implemented. One table is for both open region (radiation and scattering problems) and another table is for guided wave problems.

Maxwell's equations in hyperbolic PDE form

Maxwell's equations can be formulated as a hyperbolic system of partial differential equations. This gives access to powerful techniques for numerical solutions.

It is assumed that the waves propagate in the (x,y)-plane and restrict the direction of the magnetic field to be parallel to the z-axis and thus the electric field to be parallel to the (x,y) plane. The wave is called a transverse magnetic (TM) wave. In 2D and no polarization terms present, Maxwell's equations can then be formulated as:

where u, A, B, and C are defined as

In this representation, is the forcing function, and is in the same space as . It can be used to express an externally applied field or to describe an optimization constraint. As formulated above:

may also be explicitly defined equal to zero to simplify certain problems, or to find a characteristic solution, which is often the first step in a method to find the particular inhomogeneous solution.

Integral equation solvers

The discrete dipole approximation

The discrete dipole approximation is a flexible technique for computing scattering and absorption by targets of arbitrary geometry. The formulation is based on integral form of Maxwell equations. The DDA is an approximation of the continuum target by a finite array of polarizable points. The points acquire dipole moments in response to the local electric field. The dipoles of course interact with one another via their electric fields, so the DDA is also sometimes referred to as the coupled dipole approximation. The resulting linear system of equations is commonly solved using conjugate gradient iterations. The discretization matrix has symmetries (the integral form of Maxwell equations has form of convolution) enabling fast Fourier transform to multiply matrix times vector during conjugate gradient iterations.

Method of moments and boundary element method

The method of moments (MoM) or boundary element method (BEM) is a numerical computational method of solving linear partial differential equations which have been formulated as integral equations (i.e. in boundary integral form). It can be applied in many areas of engineering and science including fluid mechanics, acoustics, electromagnetics, fracture mechanics, and plasticity.

MoM has become more popular since the 1980s. Because it requires calculating only boundary values, rather than values throughout the space, it is significantly more efficient in terms of computational resources for problems with a small surface/volume ratio. Conceptually, it works by constructing a "mesh" over the modeled surface. However, for many problems, MoM are significantly computationally less efficient than volume-discretization methods (finite element method, finite difference method, finite volume method). Boundary element formulations typically give rise to fully populated matrices. This means that the storage requirements and computational time will tend to grow according to the square of the problem size. By contrast, finite element matrices are typically banded (elements are only locally connected) and the storage requirements for the system matrices typically grow linearly with the problem size. Compression techniques (e.g. multipole expansions or adaptive cross approximation/hierarchical matrices) can be used to ameliorate these problems, though at the cost of added complexity and with a success-rate that depends heavily on the nature and geometry of the problem.

MoM is applicable to problems for which Green's functions can be calculated. These usually involve fields in linear homogeneous media. This places considerable restrictions on the range and generality of problems suitable for boundary elements. Nonlinearities can be included in the formulation, although they generally introduce volume integrals which require the volume to be discretized before solution, removing an oft-cited advantage of MoM.

Fast multipole method

The fast multipole method (FMM) is an alternative to MoM or Ewald summation. It is an accurate simulation technique and requires less memory and processor power than MoM. The FMM was first introduced by Greengard and Rokhlin and is based on the multipole expansion technique. The first application of the FMM in computational electromagnetics was by Engheta et al.(1992). The FMM has also applications in computational bioelectromagnetics in the Charge based boundary element fast multipole method. FMM can also be used to accelerate MoM.

Plane wave time-domain

While the fast multipole method is useful for accelerating MoM solutions of integral equations with static or frequency-domain oscillatory kernels, the plane wave time-domain (PWTD) algorithm employs similar ideas to accelerate the MoM solution of time-domain integral equations involving the retarded potential. The PWTD algorithm was introduced in 1998 by Ergin, Shanker, and Michielssen.

Partial element equivalent circuit method

The partial element equivalent circuit (PEEC) is a 3D full-wave modeling method suitable for combined electromagnetic and circuit analysis. Unlike MoM, PEEC is a full spectrum method valid from dc to the maximum frequency determined by the meshing. In the PEEC method, the integral equation is interpreted as Kirchhoff's voltage law applied to a basic PEEC cell which results in a complete circuit solution for 3D geometries. The equivalent circuit formulation allows for additional SPICE type circuit elements to be easily included. Further, the models and the analysis apply to both the time and the frequency domains. The circuit equations resulting from the PEEC model are easily constructed using a modified loop analysis (MLA) or modified nodal analysis (MNA) formulation. Besides providing a direct current solution, it has several other advantages over a MoM analysis for this class of problems since any type of circuit element can be included in a straightforward way with appropriate matrix stamps. The PEEC method has recently been extended to include nonorthogonal geometries. This model extension, which is consistent with the classical orthogonal formulation, includes the Manhattan representation of the geometries in addition to the more general quadrilateral and hexahedral elements. This helps in keeping the number of unknowns at a minimum and thus reduces computational time for nonorthogonal geometries.

Cagniard-deHoop method of moments

The Cagniard-deHoop method of moments (CdH-MoM) is a 3-D full-wave time-domain integral-equation technique that is formulated via the Lorentz reciprocity theorem. Since the CdH-MoM heavily relies on the Cagniard-deHoop method, a joint-transform approach originally developed for the analytical analysis of seismic wave propagation in the crustal model of the Earth, this approach is well suited for the TD EM analysis of planarly-layered structures. The CdH-MoM has been originally applied to time-domain performance studies of cylindrical and planar antennas and, more recently, to the TD EM scattering analysis of transmission lines in the presence of thin sheets and electromagnetic metasurfaces, for example.

Differential equation solvers

Finite-Difference Frequency-Domain

Finite-difference frequency-domain (FDFD) provides a rigorous solution to Maxwell’s equations in the frequency-domain using the finite-difference method. FDFD is arguably the simplest numerical method that still provides a rigorous solution. It is incredibly versatile and able to solve virtually any problem in electromagnetics. The primary drawback of FDFD is poor efficiency compared to other methods. On modern computers, however, a huge array of problems are easily handled such as calculated guided modes in waveguides, calculating scattering from an object, calculating transmission and reflection from photonic crystals, calculate photonic band diagrams, simulating metamaterials, and much more.

FDFD may be the best "first" method to learn in computational electromagnetics (CEM). It involves almost all the concepts encountered with other methods, but in a much simpler framework. Concepts include boundary conditions, linear algebra, injecting sources, representing devices numerically, and post-processing field data to calculate meaningful things. This will help a person learn other techniques as well as provide a way to test and benchmark those other techniques.

FDFD is very similar to finite-difference time-domain (FDTD). Both methods represent space as an array of points and enforces Maxwell’s equations at each point. FDFD puts this large set of equations into a matrix and solves all the equations simultaneously using linear algebra techniques. In contrast, FDTD continually iterates over these equations to evolve a solution over time. Numerically, FDFD and FDTD are very similar, but their implementations are very different.

Finite-difference time-domain

Finite-difference time-domain (FDTD) is a popular CEM technique. It is easy to understand. It has an exceptionally simple implementation for a full wave solver. It is at least an order of magnitude less work to implement a basic FDTD solver than either an FEM or MoM solver. FDTD is the only technique where one person can realistically implement oneself in a reasonable time frame, but even then, this will be for a quite specific problem. Since it is a time-domain method, solutions can cover a wide frequency range with a single simulation run, provided the time step is small enough to satisfy the Nyquist–Shannon sampling theorem for the desired highest frequency.

FDTD belongs in the general class of grid-based differential time-domain numerical modeling methods. Maxwell's equations (in partial differential form) are modified to central-difference equations, discretized, and implemented in software. The equations are solved in a cyclic manner: the electric field is solved at a given instant in time, then the magnetic field is solved at the next instant in time, and the process is repeated over and over again.

The basic FDTD algorithm traces back to a seminal 1966 paper by Kane Yee in IEEE Transactions on Antennas and Propagation. Allen Taflove originated the descriptor "Finite-difference time-domain" and its corresponding "FDTD" acronym in a 1980 paper in IEEE Trans. Electromagn. Compat. Since about 1990, FDTD techniques have emerged as the primary means to model many scientific and engineering problems addressing electromagnetic wave interactions with material structures. An effective technique based on a time-domain finite-volume discretization procedure was introduced by Mohammadian et al. in 1991. Current FDTD modeling applications range from near-DC (ultralow-frequency geophysics involving the entire Earth-ionosphere waveguide) through microwaves (radar signature technology, antennas, wireless communications devices, digital interconnects, biomedical imaging/treatment) to visible light (photonic crystals, nanoplasmonics, solitons, and biophotonics). Approximately 30 commercial and university-developed software suites are available.

Discontinuous time-domain method

Among many time domain methods, discontinuous Galerkin time domain (DGTD) method has become popular recently since it integrates advantages of both the finite volume time domain (FVTD) method and the finite element time domain (FETD) method. Like FVTD, the numerical flux is used to exchange information between neighboring elements, thus all operations of DGTD are local and easily parallelizable. Similar to FETD, DGTD employs unstructured mesh and is capable of high-order accuracy if the high-order hierarchical basis function is adopted. With the above merits, DGTD method is widely implemented for the transient analysis of multiscale problems involving large number of unknowns.

Multiresolution time-domain

MRTD is an adaptive alternative to the finite difference time domain method (FDTD) based on wavelet analysis.

Finite element method

The finite element method (FEM) is used to find approximate solution of partial differential equations (PDE) and integral equations. The solution approach is based either on eliminating the time derivatives completely (steady state problems), or rendering the PDE into an equivalent ordinary differential equation, which is then solved using standard techniques such as finite differences, etc.

In solving partial differential equations, the primary challenge is to create an equation which approximates the equation to be studied, but which is numerically stable, meaning that errors in the input data and intermediate calculations do not accumulate and destroy the meaning of the resulting output. There are many ways of doing this, with various advantages and disadvantages. The finite element method is a good choice for solving partial differential equations over complex domains or when the desired precision varies over the entire domain.

Finite integration technique

The finite integration technique (FIT) is a spatial discretization scheme to numerically solve electromagnetic field problems in time and frequency domain. It preserves basic topological properties of the continuous equations such as conservation of charge and energy. FIT was proposed in 1977 by Thomas Weiland and has been enhanced continually over the years. This method covers the full range of electromagnetics (from static up to high frequency) and optic applications and is the basis for commercial simulation tools: CST Studio Suite developed by Computer Simulation Technology (CST AG) and Electromagnetic Simulation solutions developed by Nimbic.

The basic idea of this approach is to apply the Maxwell equations in integral form to a set of staggered grids. This method stands out due to high flexibility in geometric modeling and boundary handling as well as incorporation of arbitrary material distributions and material properties such as anisotropy, non-linearity and dispersion. Furthermore, the use of a consistent dual orthogonal grid (e.g. Cartesian grid) in conjunction with an explicit time integration scheme (e.g. leap-frog-scheme) leads to compute and memory-efficient algorithms, which are especially adapted for transient field analysis in radio frequency (RF) applications.

Pseudo-spectral time domain

This class of marching-in-time computational techniques for Maxwell's equations uses either discrete Fourier or discrete Chebyshev transforms to calculate the spatial derivatives of the electric and magnetic field vector components that are arranged in either a 2-D grid or 3-D lattice of unit cells. PSTD causes negligible numerical phase velocity anisotropy errors relative to FDTD, and therefore allows problems of much greater electrical size to be modeled.

Pseudo-spectral spatial domain

PSSD solves Maxwell's equations by propagating them forward in a chosen spatial direction. The fields are therefore held as a function of time, and (possibly) any transverse spatial dimensions. The method is pseudo-spectral because temporal derivatives are calculated in the frequency domain with the aid of FFTs. Because the fields are held as functions of time, this enables arbitrary dispersion in the propagation medium to be rapidly and accurately modelled with minimal effort. However, the choice to propagate forward in space (rather than in time) brings with it some subtleties, particularly if reflections are important.

Transmission line matrix

Transmission line matrix (TLM) can be formulated in several means as a direct set of lumped elements solvable directly by a circuit solver (ala SPICE, HSPICE, et al.), as a custom network of elements or via a scattering matrix approach. TLM is a very flexible analysis strategy akin to FDTD in capabilities, though more codes tend to be available with FDTD engines.

Locally one-dimensional

This is an implicit method. In this method, in two-dimensional case, Maxwell equations are computed in two steps, whereas in three-dimensional case Maxwell equations are divided into three spatial coordinate directions. Stability and dispersion analysis of the three-dimensional LOD-FDTD method have been discussed in detail.

Other methods

Eigenmode expansion

Eigenmode expansion (EME) is a rigorous bi-directional technique to simulate electromagnetic propagation which relies on the decomposition of the electromagnetic fields into a basis set of local eigenmodes. The eigenmodes are found by solving Maxwell's equations in each local cross-section. Eigenmode expansion can solve Maxwell's equations in 2D and 3D and can provide a fully vectorial solution provided that the mode solvers are vectorial. It offers very strong benefits compared with the FDTD method for the modelling of optical waveguides, and it is a popular tool for the modelling of fiber optics and silicon photonics devices.

Physical optics

Physical optics (PO) is the name of a high frequency approximation (short-wavelength approximation) commonly used in optics, electrical engineering and applied physics. It is an intermediate method between geometric optics, which ignores wave effects, and full wave electromagnetism, which is a precise theory. The word "physical" means that it is more physical than geometrical optics and not that it is an exact physical theory.

The approximation consists of using ray optics to estimate the field on a surface and then integrating that field over the surface to calculate the transmitted or scattered field. This resembles the Born approximation, in that the details of the problem are treated as a perturbation.

Uniform theory of diffraction

The uniform theory of diffraction (UTD) is a high frequency method for solving electromagnetic scattering problems from electrically small discontinuities or discontinuities in more than one dimension at the same point.

The uniform theory of diffraction approximates near field electromagnetic fields as quasi optical and uses ray diffraction to determine diffraction coefficients for each diffracting object-source combination. These coefficients are then used to calculate the field strength and phase for each direction away from the diffracting point. These fields are then added to the incident fields and reflected fields to obtain a total solution.

Validation

Validation is one of the key issues facing electromagnetic simulation users. The user must understand and master the validity domain of its simulation. The measure is, "how far from the reality are the results?"

Answering this question involves three steps: comparison between simulation results and analytical formulation, cross-comparison between codes, and comparison of simulation results with measurement.

Comparison between simulation results and analytical formulation

For example, assessing the value of the radar cross section of a plate with the analytical formula:

where A is the surface of the plate and is the wavelength. The next curve presenting the RCS of a plate computed at 35 GHz can be used as reference example.

Cross-comparison between codes

One example is the cross comparison of results from method of moments and asymptotic methods in their validity domains.

Comparison of simulation results with measurement

The final validation step is made by comparison between measurements and simulation. For example, the RCS calculation and the measurement of a complex metallic object at 35 GHz. The computation implements GO, PO and PTD for the edges.

Validation processes can clearly reveal that some differences can be explained by the differences between the experimental setup and its reproduction in the simulation environment.

Light scattering codes

There are now many efficient codes for solving electromagnetic scattering problems. They are listed as:

Solutions which are analytical, such as Mie solution for scattering by spheres or cylinders, can be used to validate more involved techniques.

Diffraction

From Wikipedia, the free encyclopedia
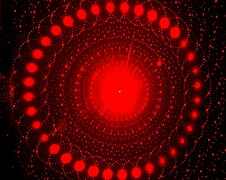
A diffraction pattern of a red laser beam projected onto a plate after passing through a small circular aperture in another plate

Diffraction is the interference or bending of waves around the corners of an obstacle or through an aperture into the region of geometrical shadow of the obstacle/aperture. The diffracting object or aperture effectively becomes a secondary source of the propagating wave. Italian scientist Francesco Maria Grimaldi coined the word diffraction and was the first to record accurate observations of the phenomenon in 1660.

Infinitely many points (three shown) along length project phase contributions from the wavefront, producing a continuously varying intensity on the registering plate

In classical physics, the diffraction phenomenon is described by the Huygens–Fresnel principle that treats each point in a propagating wavefront as a collection of individual spherical wavelets. The characteristic bending pattern is most pronounced when a wave from a coherent source (such as a laser) encounters a slit/aperture that is comparable in size to its wavelength, as shown in the inserted image. This is due to the addition, or interference, of different points on the wavefront (or, equivalently, each wavelet) that travel by paths of different lengths to the registering surface. If there are multiple, closely spaced openings (e.g., a diffraction grating), a complex pattern of varying intensity can result.

These effects also occur when a light wave travels through a medium with a varying refractive index, or when a sound wave travels through a medium with varying acoustic impedance – all waves diffract, including gravitational waves, water waves, and other electromagnetic waves such as X-rays and radio waves. Furthermore, quantum mechanics also demonstrates that matter possesses wave-like properties and, therefore, undergoes diffraction (which is measurable at subatomic to molecular levels).

The amount of diffraction depends on the size of the gap. Diffraction is greatest when the size of the gap is similar to the wavelength of the wave. In this case, when the waves pass through the gap they become semi-circular.

History

Thomas Young's sketch of two-slit diffraction for water waves, which he presented to the Royal Society in 1803

Da Vinci might have observed diffraction in a broadening of the shadow. The effects of diffraction of light were first carefully observed and characterized by Francesco Maria Grimaldi, who also coined the term diffraction, from the Latin diffringere, 'to break into pieces', referring to light breaking up into different directions. The results of Grimaldi's observations were published posthumously in 1665. Isaac Newton studied these effects and attributed them to inflexion of light rays. James Gregory (16381675) observed the diffraction patterns caused by a bird feather, which was effectively the first diffraction grating to be discovered. Thomas Young performed a celebrated experiment in 1803 demonstrating interference from two closely spaced slits. Explaining his results by interference of the waves emanating from the two different slits, he deduced that light must propagate as waves. Augustin-Jean Fresnel did more definitive studies and calculations of diffraction, made public in 1816 and 1818, and thereby gave great support to the wave theory of light that had been advanced by Christiaan Huygens and reinvigorated by Young, against Newton's corpuscular theory of light.

Mechanism

Single-slit diffraction in a circular ripple tank

In classical physics diffraction arises because of how waves propagate; this is described by the Huygens–Fresnel principle and the principle of superposition of waves. The propagation of a wave can be visualized by considering every particle of the transmitted medium on a wavefront as a point source for a secondary spherical wave. The wave displacement at any subsequent point is the sum of these secondary waves. When waves are added together, their sum is determined by the relative phases as well as the amplitudes of the individual waves so that the summed amplitude of the waves can have any value between zero and the sum of the individual amplitudes. Hence, diffraction patterns usually have a series of maxima and minima.

In the modern quantum mechanical understanding of light propagation through a slit (or slits) every photon is described by its wavefunction that determines the probability distribution for the photon: the light and dark bands are the areas where the photons are more or less likely to be detected. The wavefunction is determined by the physical surroundings such as slit geometry, screen distance, and initial conditions when the photon is created. The wave nature of individual photons (as opposed to wave properties only arising from the interactions between multitudes of photons) was implied by a low-intensity double-slit experiment first performed by G. I. Taylor in 1909. The quantum approach has some striking similarities to the Huygens-Fresnel principle; based on that principle, as light travels through slits and boundaries, secondary point light sources are created near or along these obstacles, and the resulting diffraction pattern is going to be the intensity profile based on the collective interference of all these light sources that have different optical paths. In the quantum formalism, that is similar to considering the limited regions around the slits and boundaries from which photons are more likely to originate, and calculating the probability distribution (that is proportional to the resulting intensity of classical formalism).

There are various analytical models which allow the diffracted field to be calculated, including the Kirchhoff diffraction equation (derived from the wave equation), the Fraunhofer diffraction approximation of the Kirchhoff equation (applicable to the far field), the Fresnel diffraction approximation (applicable to the near field) and the Feynman path integral formulation. Most configurations cannot be solved analytically, but can yield numerical solutions through finite element and boundary element methods.

It is possible to obtain a qualitative understanding of many diffraction phenomena by considering how the relative phases of the individual secondary wave sources vary, and, in particular, the conditions in which the phase difference equals half a cycle in which case waves will cancel one another out.

The simplest descriptions of diffraction are those in which the situation can be reduced to a two-dimensional problem. For water waves, this is already the case; water waves propagate only on the surface of the water. For light, we can often neglect one direction if the diffracting object extends in that direction over a distance far greater than the wavelength. In the case of light shining through small circular holes, we will have to take into account the full three-dimensional nature of the problem.

Examples

The effects of diffraction are often seen in everyday life. The most striking examples of diffraction are those that involve light; for example, the closely spaced tracks on a CD or DVD act as a diffraction grating to form the familiar rainbow pattern seen when looking at a disc.

Pixels on smart phone screen acting as diffraction grating
 
Data is written on CDs as pits and lands; the pits on the surface act as diffracting elements.

This principle can be extended to engineer a grating with a structure such that it will produce any diffraction pattern desired; the hologram on a credit card is an example.

Diffraction in the atmosphere by small particles can cause a corona - a bright disc and rings around a bright light source like the sun or the moon. At the opposite point one may also observe glory - bright rings around the shadow of the observer. In contrast to the corona, glory requires the particles to be transparent spheres (like fog droplets), since the backscattering of the light that forms the glory involves refraction and internal reflection within the droplet.

Lunar corona.
 
A solar glory, as seen from a plane on the underlying clouds.

A shadow of a solid object, using light from a compact source, shows small fringes near its edges.

The bright spot (Arago spot) seen in the center of the shadow of a circular obstacle is due to diffraction

Diffraction spikes are diffraction patterns caused due to non-circular aperture in camera or support struts in telescope; In normal vision, diffraction through eyelashes may produce such spikes.

View from the end of Millennium Bridge; Moon rising above the Southwark Bridge. Street lights are reflecting in the Thames.
Simulated diffraction spikes in hexagonal telescope mirrors

The speckle pattern which is observed when laser light falls on an optically rough surface is also a diffraction phenomenon. When deli meat appears to be iridescent, that is diffraction off the meat fibers. All these effects are a consequence of the fact that light propagates as a wave.

Diffraction can occur with any kind of wave. Ocean waves diffract around jetties and other obstacles.

Circular waves generated by diffraction from the narrow entrance of a flooded coastal quarry

Sound waves can diffract around objects, which is why one can still hear someone calling even when hiding behind a tree.

Diffraction can also be a concern in some technical applications; it sets a fundamental limit to the resolution of a camera, telescope, or microscope.

Other examples of diffraction are considered below.

Single-slit diffraction

2D Single-slit diffraction with width changing animation
Numerical approximation of diffraction pattern from a slit of width four wavelengths with an incident plane wave. The main central beam, nulls, and phase reversals are apparent.
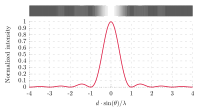
Graph and image of single-slit diffraction

A long slit of infinitesimal width which is illuminated by light diffracts the light into a series of circular waves and the wavefront which emerges from the slit is a cylindrical wave of uniform intensity, in accordance with the Huygens–Fresnel principle.

An illuminated slit that is wider than a wavelength produces interference effects in the space downstream of the slit. Assuming that the slit behaves as though it has a large number of point sources spaced evenly across the width of the slit interference effects can be calculated. The analysis of this system is simplified if we consider light of a single wavelength. If the incident light is coherent, these sources all have the same phase. Light incident at a given point in the space downstream of the slit is made up of contributions from each of these point sources and if the relative phases of these contributions vary by or more, we may expect to find minima and maxima in the diffracted light. Such phase differences are caused by differences in the path lengths over which contributing rays reach the point from the slit.

We can find the angle at which a first minimum is obtained in the diffracted light by the following reasoning. The light from a source located at the top edge of the slit interferes destructively with a source located at the middle of the slit, when the path difference between them is equal to . Similarly, the source just below the top of the slit will interfere destructively with the source located just below the middle of the slit at the same angle. We can continue this reasoning along the entire height of the slit to conclude that the condition for destructive interference for the entire slit is the same as the condition for destructive interference between two narrow slits a distance apart that is half the width of the slit. The path difference is approximately so that the minimum intensity occurs at an angle given by

where is the width of the slit, is the angle of incidence at which the minimum intensity occurs, and is the wavelength of the light.

A similar argument can be used to show that if we imagine the slit to be divided into four, six, eight parts, etc., minima are obtained at angles given by

where is an integer other than zero.

There is no such simple argument to enable us to find the maxima of the diffraction pattern. The intensity profile can be calculated using the Fraunhofer diffraction equation as

where is the intensity at a given angle, is the intensity at the central maximum (), which is also a normalization factor of the intensity profile that can be determined by an integration from to and conservation of energy, and , which is the unnormalized sinc function.

This analysis applies only to the far field (Fraunhofer diffraction), that is, at a distance much larger than the width of the slit.

From the intensity profile above, if , the intensity will have little dependency on , hence the wavefront emerging from the slit would resemble a cylindrical wave with azimuthal symmetry; If , only would have appreciable intensity, hence the wavefront emerging from the slit would resemble that of geometrical optics.

When the incident angle of the light onto the slit is non-zero (which causes a change in the path length), the intensity profile in the Fraunhofer regime (i.e. far field) becomes:

The choice of plus/minus sign depends on the definition of the incident angle .

2-slit (top) and 5-slit diffraction of red laser light
Diffraction of a red laser using a diffraction grating
A diffraction pattern of a 633 nm laser through a grid of 150 slits

Diffraction grating

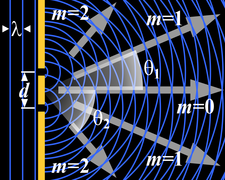
A diffraction grating is an optical component with a regular pattern. The form of the light diffracted by a grating depends on the structure of the elements and the number of elements present, but all gratings have intensity maxima at angles θm which are given by the grating equation

where is the angle at which the light is incident, is the separation of grating elements, and is an integer which can be positive or negative.

The light diffracted by a grating is found by summing the light diffracted from each of the elements, and is essentially a convolution of diffraction and interference patterns.

The figure shows the light diffracted by 2-element and 5-element gratings where the grating spacings are the same; it can be seen that the maxima are in the same position, but the detailed structures of the intensities are different.

Circular aperture

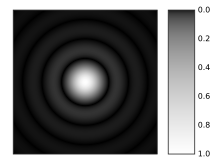
A computer-generated image of an Airy disk
Diffraction pattern from a circular aperture at various distances

The far-field diffraction of a plane wave incident on a circular aperture is often referred to as the Airy disk. The variation in intensity with angle is given by

where is the radius of the circular aperture, is equal to and is a Bessel function. The smaller the aperture, the larger the spot size at a given distance, and the greater the divergence of the diffracted beams.

General aperture

The wave that emerges from a point source has amplitude at location that is given by the solution of the frequency domain wave equation for a point source (the Helmholtz equation),

where is the 3-dimensional delta function. The delta function has only radial dependence, so the Laplace operator (a.k.a. scalar Laplacian) in the spherical coordinate system simplifies to

(See del in cylindrical and spherical coordinates.) By direct substitution, the solution to this equation can be readily shown to be the scalar Green's function, which in the spherical coordinate system (and using the physics time convention ) is

This solution assumes that the delta function source is located at the origin. If the source is located at an arbitrary source point, denoted by the vector and the field point is located at the point , then we may represent the scalar Green's function (for arbitrary source location) as

Therefore, if an electric field is incident on the aperture, the field produced by this aperture distribution is given by the surface integral

On the calculation of Fraunhofer region fields

where the source point in the aperture is given by the vector

In the far field, wherein the parallel rays approximation can be employed, the Green's function,

simplifies to
as can be seen in the adjacent figure.

The expression for the far-zone (Fraunhofer region) field becomes

Now, since

and
the expression for the Fraunhofer region field from a planar aperture now becomes

Letting

and
the Fraunhofer region field of the planar aperture assumes the form of a Fourier transform

In the far-field / Fraunhofer region, this becomes the spatial Fourier transform of the aperture distribution. Huygens' principle when applied to an aperture simply says that the far-field diffraction pattern is the spatial Fourier transform of the aperture shape, and this is a direct by-product of using the parallel-rays approximation, which is identical to doing a plane wave decomposition of the aperture plane fields (see Fourier optics).

Propagation of a laser beam

The way in which the beam profile of a laser beam changes as it propagates is determined by diffraction. When the entire emitted beam has a planar, spatially coherent wave front, it approximates Gaussian beam profile and has the lowest divergence for a given diameter. The smaller the output beam, the quicker it diverges. It is possible to reduce the divergence of a laser beam by first expanding it with one convex lens, and then collimating it with a second convex lens whose focal point is coincident with that of the first lens. The resulting beam has a larger diameter, and hence a lower divergence. Divergence of a laser beam may be reduced below the diffraction of a Gaussian beam or even reversed to convergence if the refractive index of the propagation media increases with the light intensity. This may result in a self-focusing effect.

When the wave front of the emitted beam has perturbations, only the transverse coherence length (where the wave front perturbation is less than 1/4 of the wavelength) should be considered as a Gaussian beam diameter when determining the divergence of the laser beam. If the transverse coherence length in the vertical direction is higher than in horizontal, the laser beam divergence will be lower in the vertical direction than in the horizontal.

Diffraction-limited imaging

The Airy disk around each of the stars from the 2.56 m telescope aperture can be seen in this lucky image of the binary star zeta Boötis.

The ability of an imaging system to resolve detail is ultimately limited by diffraction. This is because a plane wave incident on a circular lens or mirror is diffracted as described above. The light is not focused to a point but forms an Airy disk having a central spot in the focal plane whose radius (as measured to the first null) is

where is the wavelength of the light and is the f-number (focal length divided by aperture diameter ) of the imaging optics; this is strictly accurate for (paraxial case). In object space, the corresponding angular resolution is
where is the diameter of the entrance pupil of the imaging lens (e.g., of a telescope's main mirror).

Two point sources will each produce an Airy pattern – see the photo of a binary star. As the point sources move closer together, the patterns will start to overlap, and ultimately they will merge to form a single pattern, in which case the two point sources cannot be resolved in the image. The Rayleigh criterion specifies that two point sources are considered "resolved" if the separation of the two images is at least the radius of the Airy disk, i.e. if the first minimum of one coincides with the maximum of the other.

Thus, the larger the aperture of the lens compared to the wavelength, the finer the resolution of an imaging system. This is one reason astronomical telescopes require large objectives, and why microscope objectives require a large numerical aperture (large aperture diameter compared to working distance) in order to obtain the highest possible resolution.

Speckle patterns

The speckle pattern seen when using a laser pointer is another diffraction phenomenon. It is a result of the superposition of many waves with different phases, which are produced when a laser beam illuminates a rough surface. They add together to give a resultant wave whose amplitude, and therefore intensity, varies randomly.

Babinet's principle

Babinet's principle is a useful theorem stating that the diffraction pattern from an opaque body is identical to that from a hole of the same size and shape, but with differing intensities. This means that the interference conditions of a single obstruction would be the same as that of a single slit.

"Knife edge"

The knife-edge effect or knife-edge diffraction is a truncation of a portion of the incident radiation that strikes a sharp well-defined obstacle, such as a mountain range or the wall of a building. The knife-edge effect is explained by the Huygens–Fresnel principle, which states that a well-defined obstruction to an electromagnetic wave acts as a secondary source, and creates a new wavefront. This new wavefront propagates into the geometric shadow area of the obstacle.

Knife-edge diffraction is an outgrowth of the "half-plane problem", originally solved by Arnold Sommerfeld using a plane wave spectrum formulation. A generalization of the half-plane problem is the "wedge problem", solvable as a boundary value problem in cylindrical coordinates. The solution in cylindrical coordinates was then extended to the optical regime by Joseph B. Keller, who introduced the notion of diffraction coefficients through his geometrical theory of diffraction (GTD). Pathak and Kouyoumjian extended the (singular) Keller coefficients via the uniform theory of diffraction (UTD).

Patterns

The upper half of this image shows a diffraction pattern of He-Ne laser beam on an elliptic aperture. The lower half is its 2D Fourier transform approximately reconstructing the shape of the aperture.

Several qualitative observations can be made of diffraction in general:

  • The angular spacing of the features in the diffraction pattern is inversely proportional to the dimensions of the object causing the diffraction. In other words: The smaller the diffracting object, the 'wider' the resulting diffraction pattern, and vice versa. (More precisely, this is true of the sines of the angles.)
  • The diffraction angles are invariant under scaling; that is, they depend only on the ratio of the wavelength to the size of the diffracting object.
  • When the diffracting object has a periodic structure, for example in a diffraction grating, the features generally become sharper. The third figure, for example, shows a comparison of a double-slit pattern with a pattern formed by five slits, both sets of slits having the same spacing, between the center of one slit and the next.

Matter wave diffraction

According to quantum theory every particle exhibits wave properties and can therefore diffract. Diffraction of electrons and neutrons is one of the powerful arguments in favor of quantum mechanics. The wavelength associated with a particle is the de Broglie wavelength

where is the Planck constant and is the momentum of the particle (mass × velocity for slow-moving particles). For example, a sodium atom traveling at about 300 m/s would have a de Broglie wavelength of about 50 picometres.

Diffraction of matter waves has been observed for small particles, like electrons, neutrons, atoms, and even large molecules. The short wavelength of these matter waves makes them ideally suited to study the atomic crystal structure of solids, small molecules and proteins.

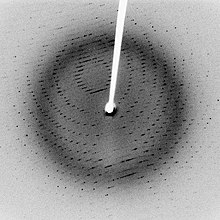
Bragg diffraction

Following Bragg's law, each dot (or reflection) in this diffraction pattern forms from the constructive interference of X-rays passing through a crystal. The data can be used to determine the crystal's atomic structure.

Diffraction from a large three-dimensional periodic structure such as many thousands of atoms in a crystal is called Bragg diffraction. It is similar to what occurs when waves are scattered from a diffraction grating. Bragg diffraction is a consequence of interference between waves reflecting from many different crystal planes. The condition of constructive interference is given by Bragg's law:

where is the wavelength, is the distance between crystal planes, is the angle of the diffracted wave, and is an integer known as the order of the diffracted beam.

Bragg diffraction may be carried out using either electromagnetic radiation of very short wavelength like X-rays or matter waves like neutrons (and electrons) whose wavelength is on the order of (or much smaller than) the atomic spacing. The pattern produced gives information of the separations of crystallographic planes , allowing one to deduce the crystal structure.

For completeness, Bragg diffraction is a limit for a large number of atoms with X-rays or neutrons, and is rarely valid for electron diffraction or with solid particles in the size range of less than 50 nanometers.

Coherence

The description of diffraction relies on the interference of waves emanating from the same source taking different paths to the same point on a screen. In this description, the difference in phase between waves that took different paths is only dependent on the effective path length. This does not take into account the fact that waves that arrive at the screen at the same time were emitted by the source at different times. The initial phase with which the source emits waves can change over time in an unpredictable way. This means that waves emitted by the source at times that are too far apart can no longer form a constant interference pattern since the relation between their phases is no longer time independent.

The length over which the phase in a beam of light is correlated is called the coherence length. In order for interference to occur, the path length difference must be smaller than the coherence length. This is sometimes referred to as spectral coherence, as it is related to the presence of different frequency components in the wave. In the case of light emitted by an atomic transition, the coherence length is related to the lifetime of the excited state from which the atom made its transition.

If waves are emitted from an extended source, this can lead to incoherence in the transversal direction. When looking at a cross section of a beam of light, the length over which the phase is correlated is called the transverse coherence length. In the case of Young's double-slit experiment, this would mean that if the transverse coherence length is smaller than the spacing between the two slits, the resulting pattern on a screen would look like two single-slit diffraction patterns.

In the case of particles like electrons, neutrons, and atoms, the coherence length is related to the spatial extent of the wave function that describes the particle.

Applications

Diffraction before destruction

A new way to image single biological particles has emerged since the 2010s, utilising the bright X-rays generated by X-ray free-electron lasers. These femtosecond-duration pulses will allow for the (potential) imaging of single biological macromolecules. Due to these short pulses, radiation damage can be outrun, and diffraction patterns of single biological macromolecules will be able to be obtained.

money market fund

From Wikipedia, the free encyclopedia A money market fund (also called a mo...