Albedo (/ælˈbiːdoʊ/ al-BEE-doh; from Latin albedo 'whiteness') is the fraction of sunlight that is diffusely reflected by a body. It is measured on a scale from 0 (corresponding to a black body that absorbs all incident radiation) to 1 (corresponding to a body that reflects all incident radiation). Surface albedo is defined as the ratio of radiosity Je to the irradiance Ee (flux per unit area) received by a surface. The proportion reflected is not only determined by properties of the surface itself, but also by the spectral and angular distribution of solar radiation reaching the Earth's surface. These factors vary with atmospheric composition, geographic location, and time (see position of the Sun).
While directional-hemispherical reflectance factor is calculated for a single angle of incidence (i.e., for a given position of the Sun), albedo is the directional integration of reflectance over all solar angles in a given period. The temporal resolution may range from seconds (as obtained from flux measurements) to daily, monthly, or annual averages.
Unless given for a specific wavelength (spectral albedo), albedo refers to the entire spectrum of solar radiation. Due to measurement constraints, it is often given for the spectrum in which most solar energy reaches the surface (between 0.3 and 3 μm). This spectrum includes visible light (0.4–0.7 μm), which explains why surfaces with a low albedo appear dark (e.g., trees absorb most radiation), whereas surfaces with a high albedo appear bright (e.g., snow reflects most radiation).
Ice–albedo feedback is a positive feedback climate process where a change in the area of ice caps, glaciers, and sea ice alters the albedo and surface temperature of a planet. Ice is very reflective, therefore it reflects far more solar energy back to space than the other types of land area or open water. Ice–albedo feedback plays an important role in global climate change. Albedo is an important concept in climate science.
Terrestrial albedo
| Surface | Typical albedo |
|---|---|
| Fresh asphalt | 0.04 |
| Open ocean | 0.06 |
| Worn asphalt | 0.12 |
| Conifer forest, summer |
0.08, 0.09 to 0.15 |
| Deciduous forest | 0.15 to 0.18 |
| Bare soil | 0.17 |
| Green grass | 0.25 |
| Desert sand | 0.40 |
| New concrete | 0.55 |
| Ocean ice | 0.50 to 0.70 |
| Fresh snow | 0.80 |
| Aluminium | 0.85 |
Any albedo in visible light falls within a range of about 0.9 for fresh snow to about 0.04 for charcoal, one of the darkest substances. Deeply shadowed cavities can achieve an effective albedo approaching the zero of a black body. When seen from a distance, the ocean surface has a low albedo, as do most forests, whereas desert areas have some of the highest albedos among landforms. Most land areas are in an albedo range of 0.1 to 0.4. The average albedo of Earth is about 0.3. This is far higher than for the ocean primarily because of the contribution of clouds.
Earth's surface albedo is regularly estimated via Earth observation satellite sensors such as NASA's MODIS instruments on board the Terra and Aqua satellites, and the CERES instrument on the Suomi NPP and JPSS. As the amount of reflected radiation is only measured for a single direction by satellite, not all directions, a mathematical model is used to translate a sample set of satellite reflectance measurements into estimates of directional-hemispherical reflectance and bi-hemispherical reflectance (e.g.,). These calculations are based on the bidirectional reflectance distribution function (BRDF), which describes how the reflectance of a given surface depends on the view angle of the observer and the solar angle. BDRF can facilitate translations of observations of reflectance into albedo.
Earth's average surface temperature due to its albedo and the greenhouse effect is currently about 15 °C (59 °F). If Earth were frozen entirely (and hence be more reflective), the average temperature of the planet would drop below −40 °C (−40 °F). If only the continental land masses became covered by glaciers, the mean temperature of the planet would drop to about 0 °C (32 °F). In contrast, if the entire Earth was covered by water – a so-called ocean planet – the average temperature on the planet would rise to almost 27 °C (81 °F).
In 2021, scientists reported that Earth dimmed by ~0.5% over two decades (1998–2017) as measured by earthshine using modern photometric techniques. This may have both been co-caused by climate change as well as a substantial increase in global warming. However, the link to climate change has not been explored to date and it is unclear whether or not this represents an ongoing trend.
White-sky, black-sky, and blue-sky albedo
For land surfaces, it has been shown that the albedo at a particular solar zenith angle θi can be approximated by the proportionate sum of two terms:
- the directional-hemispherical reflectance at that solar zenith angle, , sometimes referred to as black-sky albedo, and
- the bi-hemispherical reflectance, , sometimes referred to as white-sky albedo.
with being the proportion of direct radiation from a given solar angle, and being the proportion of diffuse illumination, the actual albedo (also called blue-sky albedo) can then be given as:
This formula is important because it allows the albedo to be calculated for any given illumination conditions from a knowledge of the intrinsic properties of the surface.
Changes to albedo due to human activities
Human activities (e.g., deforestation, farming, and urbanization) change the albedo of various areas around the globe. Human impacts to "the physical properties of the land surface can perturb the climate by altering the Earth’s radiative energy balance" even on a small scale or when undetected by satellites.
Urbanization generally decreases albedo (commonly being 0.01–0.02 lower than adjacent croplands), which contributes to global warming. Deliberately increasing albedo in urban areas can mitigate the urban heat island effect. An estimate in 2022 found that on a global scale, "an albedo increase of 0.1 in worldwide urban areas would result in a cooling effect that is equivalent to absorbing ~44 Gt of CO2 emissions."
Intentionally enhancing the albedo of the Earth's surface, along with its daytime thermal emittance, has been proposed as a solar radiation management strategy to mitigate energy crises and global warming known as passive daytime radiative cooling (PDRC). Efforts toward widespread implementation of PDRCs may focus on maximizing the albedo of surfaces from very low to high values, so long as a thermal emittance of at least 90% can be achieved.
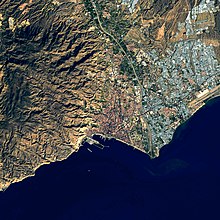
The tens of thousands of hectares of greenhouses in Almería, Spain form a large expanse of whitened plastic roofs. A 2008 study found that this anthropogenic change lowered the local surface area temperature of the high-albedo area, although changes were localized. A follow-up study found that "CO2-eq. emissions associated to changes in surface albedo are a consequence of land transformation" and can reduce surface temperature increases associated with climate change.
Examples of terrestrial albedo effects
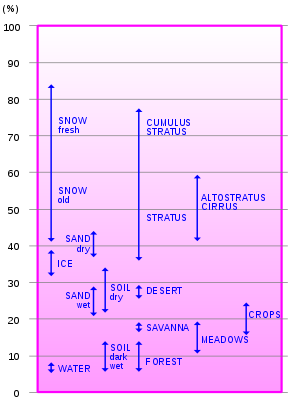
Illumination
Albedo is not directly dependent on the illumination because changing the amount of incoming light proportionally changes the amount of reflected light, except in circumstances where a change in illumination induces a change in the Earth's surface at that location (e.g. through melting of reflective ice). However, albedo and illumination both vary by latitude. Albedo is highest near the poles and lowest in the subtropics, with a local maximum in the tropics.
Insolation effects
The intensity of albedo temperature effects depends on the amount of albedo and the level of local insolation (solar irradiance); high albedo areas in the Arctic and Antarctic regions are cold due to low insolation, whereas areas such as the Sahara Desert, which also have a relatively high albedo, will be hotter due to high insolation. Tropical and sub-tropical rainforest areas have low albedo, and are much hotter than their temperate forest counterparts, which have lower insolation. Because insolation plays such a big role in the heating and cooling effects of albedo, high insolation areas like the tropics will tend to show a more pronounced fluctuation in local temperature when local albedo changes.
Arctic regions notably release more heat back into space than what they absorb, effectively cooling the Earth. This has been a concern since arctic ice and snow has been melting at higher rates due to higher temperatures, creating regions in the arctic that are notably darker (being water or ground which is darker color) and reflects less heat back into space. This feedback loop results in a reduced albedo effect.
Climate and weather

Albedo affects climate by determining how much radiation a planet absorbs. The uneven heating of Earth from albedo variations between land, ice, or ocean surfaces can drive weather.
The response of the climate system to an initial forcing is modified by feedbacks: increased by "self-reinforcing" or "positive" feedbacks and reduced by "balancing" or "negative" feedbacks. The main reinforcing feedbacks are the water-vapour feedback, the ice–albedo feedback, and the net effect of clouds.
Albedo–temperature feedback
When an area's albedo changes due to snowfall, a snow–temperature feedback results. A layer of snowfall increases local albedo, reflecting away sunlight, leading to local cooling. In principle, if no outside temperature change affects this area (e.g., a warm air mass), the raised albedo and lower temperature would maintain the current snow and invite further snowfall, deepening the snow–temperature feedback. However, because local weather is dynamic due to the change of seasons, eventually warm air masses and a more direct angle of sunlight (higher insolation) cause melting. When the melted area reveals surfaces with lower albedo, such as grass, soil, or ocean, the effect is reversed: the darkening surface lowers albedo, increasing local temperatures, which induces more melting and thus reducing the albedo further, resulting in still more heating.
Snow
Snow albedo is highly variable, ranging from as high as 0.9 for freshly fallen snow, to about 0.4 for melting snow, and as low as 0.2 for dirty snow. Over Antarctica snow albedo averages a little more than 0.8. If a marginally snow-covered area warms, snow tends to melt, lowering the albedo, and hence leading to more snowmelt because more radiation is being absorbed by the snowpack (the ice–albedo positive feedback).
In Switzerland, the citizens have been protecting their glaciers with large white tarpaulins to slow down the ice melt. These large white sheets are helping to reject the rays from the sun and defecting the heat. Although this method is very expensive, it has been shown to work, reducing snow and ice melt by 60%.
Just as fresh snow has a higher albedo than does dirty snow, the albedo of snow-covered sea ice is far higher than that of sea water. Sea water absorbs more solar radiation than would the same surface covered with reflective snow. When sea ice melts, either due to a rise in sea temperature or in response to increased solar radiation from above, the snow-covered surface is reduced, and more surface of sea water is exposed, so the rate of energy absorption increases. The extra absorbed energy heats the sea water, which in turn increases the rate at which sea ice melts. As with the preceding example of snowmelt, the process of melting of sea ice is thus another example of a positive feedback. Both positive feedback loops have long been recognized as important for global warming.
Cryoconite, powdery windblown dust containing soot, sometimes reduces albedo on glaciers and ice sheets.
The dynamical nature of albedo in response to positive feedback, together with the effects of small errors in the measurement of albedo, can lead to large errors in energy estimates. Because of this, in order to reduce the error of energy estimates, it is important to measure the albedo of snow-covered areas through remote sensing techniques rather than applying a single value for albedo over broad regions.
Small-scale effects
Albedo works on a smaller scale, too. In sunlight, dark clothes absorb more heat and light-coloured clothes reflect it better, thus allowing some control over body temperature by exploiting the albedo effect of the colour of external clothing.
Solar photovoltaic effects
Albedo can affect the electrical energy output of solar photovoltaic devices. For example, the effects of a spectrally responsive albedo are illustrated by the differences between the spectrally weighted albedo of solar photovoltaic technology based on hydrogenated amorphous silicon (a-Si:H) and crystalline silicon (c-Si)-based compared to traditional spectral-integrated albedo predictions. Research showed impacts of over 10% for vertically (90°) mounted systems, but such effects were substantially lower for systems with lower surface tilts. Spectral albedo strongly affects the performance of bifacial solar cells where rear surface performance gains of over 20% have been observed for c-Si cells installed above healthy vegetation. An analysis on the bias due to the specular reflectivity of 22 commonly occurring surface materials (both human-made and natural) provided effective albedo values for simulating the performance of seven photovoltaic materials mounted on three common photovoltaic system topologies: industrial (solar farms), commercial flat rooftops and residential pitched-roof applications.
Trees
Forests generally have a low albedo because the majority of the ultraviolet and visible spectrum is absorbed through photosynthesis. For this reason, the greater heat absorption by trees could offset some of the carbon benefits of afforestation (or offset the negative climate impacts of deforestation). In other words: The climate change mitigation effect of carbon sequestration by forests is partially counterbalanced in that reforestation can decrease the reflection of sunlight (albedo).
In the case of evergreen forests with seasonal snow cover, albedo reduction may be significant enough for deforestation to cause a net cooling effect. Trees also impact climate in extremely complicated ways through evapotranspiration. The water vapor causes cooling on the land surface, causes heating where it condenses, acts as strong greenhouse gas, and can increase albedo when it condenses into clouds. Scientists generally treat evapotranspiration as a net cooling impact, and the net climate impact of albedo and evapotranspiration changes from deforestation depends greatly on local climate.
Mid-to-high-latitude forests have a much lower albedo during snow seasons than flat ground, thus contributing to warming. Modeling that compares the effects of albedo differences between forests and grasslands suggests that expanding the land area of forests in temperate zones offers only a temporary mitigation benefit.
In seasonally snow-covered zones, winter albedos of treeless areas are 10% to 50% higher than nearby forested areas because snow does not cover the trees as readily. Deciduous trees have an albedo value of about 0.15 to 0.18 whereas coniferous trees have a value of about 0.09 to 0.15. Variation in summer albedo across both forest types is associated with maximum rates of photosynthesis because plants with high growth capacity display a greater fraction of their foliage for direct interception of incoming radiation in the upper canopy. The result is that wavelengths of light not used in photosynthesis are more likely to be reflected back to space rather than being absorbed by other surfaces lower in the canopy.
Studies by the Hadley Centre have investigated the relative (generally warming) effect of albedo change and (cooling) effect of carbon sequestration on planting forests. They found that new forests in tropical and midlatitude areas tended to cool; new forests in high latitudes (e.g., Siberia) were neutral or perhaps warming.
Research in 2023, drawing from 176 flux stations globally, revealed a climate trade-off: increased carbon uptake from afforestation results in reduced albedo. Initially, this reduction may lead to moderate global warming over a span of approximately 20 years, but it is expected to transition into significant cooling thereafter.
Water
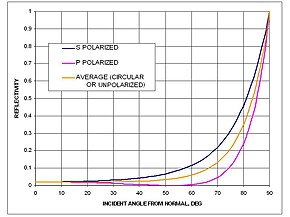
Water reflects light very differently from typical terrestrial materials. The reflectivity of a water surface is calculated using the Fresnel equations.
At the scale of the wavelength of light even wavy water is always smooth so the light is reflected in a locally specular manner (not diffusely). The glint of light off water is a commonplace effect of this. At small angles of incident light, waviness results in reduced reflectivity because of the steepness of the reflectivity-vs.-incident-angle curve and a locally increased average incident angle.
Although the reflectivity of water is very low at low and medium angles of incident light, it becomes very high at high angles of incident light such as those that occur on the illuminated side of Earth near the terminator (early morning, late afternoon, and near the poles). However, as mentioned above, waviness causes an appreciable reduction. Because light specularly reflected from water does not usually reach the viewer, water is usually considered to have a very low albedo in spite of its high reflectivity at high angles of incident light.
Note that white caps on waves look white (and have high albedo) because the water is foamed up, so there are many superimposed bubble surfaces which reflect, adding up their reflectivities. Fresh 'black' ice exhibits Fresnel reflection. Snow on top of this sea ice increases the albedo to 0.9.
Clouds
Cloud albedo has substantial influence over atmospheric temperatures. Different types of clouds exhibit different reflectivity, theoretically ranging in albedo from a minimum of near 0 to a maximum approaching 0.8. "On any given day, about half of Earth is covered by clouds, which reflect more sunlight than land and water. Clouds keep Earth cool by reflecting sunlight, but they can also serve as blankets to trap warmth."
Albedo and climate in some areas are affected by artificial clouds, such as those created by the contrails of heavy commercial airliner traffic. A study following the burning of the Kuwaiti oil fields during Iraqi occupation showed that temperatures under the burning oil fires were as much as 10 °C (18 °F) colder than temperatures several miles away under clear skies.
Aerosol effects
Aerosols (very fine particles/droplets in the atmosphere) have both direct and indirect effects on Earth's radiative balance. The direct (albedo) effect is generally to cool the planet; the indirect effect (the particles act as cloud condensation nuclei and thereby change cloud properties) is less certain.
Black carbon
Another albedo-related effect on the climate is from black carbon particles. The size of this effect is difficult to quantify: the Intergovernmental Panel on Climate Change estimates that the global mean radiative forcing for black carbon aerosols from fossil fuels is +0.2 W m−2, with a range +0.1 to +0.4 W m−2. Black carbon is a bigger cause of the melting of the polar ice cap in the Arctic than carbon dioxide due to its effect on the albedo.
Astronomical albedo

In astronomy, the term albedo can be defined in several different ways, depending upon the application and the wavelength of electromagnetic radiation involved.
Optical or visual albedo
The albedos of planets, satellites and minor planets such as asteroids can be used to infer much about their properties. The study of albedos, their dependence on wavelength, lighting angle ("phase angle"), and variation in time composes a major part of the astronomical field of photometry. For small and far objects that cannot be resolved by telescopes, much of what we know comes from the study of their albedos. For example, the absolute albedo can indicate the surface ice content of outer Solar System objects, the variation of albedo with phase angle gives information about regolith properties, whereas unusually high radar albedo is indicative of high metal content in asteroids.
Enceladus, a moon of Saturn, has one of the highest known optical albedos of any body in the Solar System, with an albedo of 0.99. Another notable high-albedo body is Eris, with an albedo of 0.96. Many small objects in the outer Solar System and asteroid belt have low albedos down to about 0.05. A typical comet nucleus has an albedo of 0.04. Such a dark surface is thought to be indicative of a primitive and heavily space weathered surface containing some organic compounds.
The overall albedo of the Moon is measured to be around 0.14, but it is strongly directional and non-Lambertian, displaying also a strong opposition effect. Although such reflectance properties are different from those of any terrestrial terrains, they are typical of the regolith surfaces of airless Solar System bodies.
Two common optical albedos that are used in astronomy are the (V-band) geometric albedo (measuring brightness when illumination comes from directly behind the observer) and the Bond albedo (measuring total proportion of electromagnetic energy reflected). Their values can differ significantly, which is a common source of confusion.
| Planet | Geometric | Bond |
|---|---|---|
| Mercury | 0.142 | 0.088 or 0.068 |
| Venus | 0.689 | 0.76 or 0.77 |
| Earth | 0.434 | 0.294 |
| Mars | 0.170 | 0.250 |
| Jupiter | 0.538 | 0.343±0.032 and also 0.503±0.012 |
| Saturn | 0.499 | 0.342 |
| Uranus | 0.488 | 0.300 |
| Neptune | 0.442 | 0.290 |
In detailed studies, the directional reflectance properties of astronomical bodies are often expressed in terms of the five Hapke parameters which semi-empirically describe the variation of albedo with phase angle, including a characterization of the opposition effect of regolith surfaces. One of these five parameters is yet another type of albedo called the single-scattering albedo. It is used to define scattering of electromagnetic waves on small particles. It depends on properties of the material (refractive index), the size of the particle, and the wavelength of the incoming radiation.
An important relationship between an object's astronomical (geometric) albedo, absolute magnitude and diameter is given by: where is the astronomical albedo, is the diameter in kilometers, and is the absolute magnitude.
Radar albedo
In planetary radar astronomy, a microwave (or radar) pulse is transmitted toward a planetary target (e.g. Moon, asteroid, etc.) and the echo from the target is measured. In most instances, the transmitted pulse is circularly polarized and the received pulse is measured in the same sense of polarization as the transmitted pulse (SC) and the opposite sense (OC). The echo power is measured in terms of radar cross-section, , , or (total power, SC + OC) and is equal to the cross-sectional area of a metallic sphere (perfect reflector) at the same distance as the target that would return the same echo power.
Those components of the received echo that return from first-surface reflections (as from a smooth or mirror-like surface) are dominated by the OC component as there is a reversal in polarization upon reflection. If the surface is rough at the wavelength scale or there is significant penetration into the regolith, there will be a significant SC component in the echo caused by multiple scattering.
For most objects in the solar system, the OC echo dominates and the most commonly reported radar albedo parameter is the (normalized) OC radar albedo (often shortened to radar albedo):
where the denominator is the effective cross-sectional area of the target object with mean radius, . A smooth metallic sphere would have .
Radar albedos of Solar System objects
| Object | |
|---|---|
| Moon | 0.06 |
| Mercury | 0.05 |
| Venus | 0.10 |
| Mars | 0.06 |
| Avg. S-type asteroid | 0.14 |
| Avg. C-type asteroid | 0.13 |
| Avg. M-type asteroid | 0.26 |
| Comet P/2005 JQ5 | 0.02 |
The values reported for the Moon, Mercury, Mars, Venus, and Comet P/2005 JQ5 are derived from the total (OC+SC) radar albedo reported in those references.
Relationship to surface bulk density
In the event that most of the echo is from first surface reflections ( or so), the OC radar albedo is a first-order approximation of the Fresnel reflection coefficient (aka reflectivity) and can be used to estimate the bulk density of a planetary surface to a depth of a meter or so (a few wavelengths of the radar wavelength which is typically at the decimeter scale) using the following empirical relationships:
- .


